Waiting for lower timeframe confirmation is our main tool to confirm strength within higher timeframe zones, and has really been the key to our trading success. It takes a little time to understand the subtle nuances, however, as each trade is never the same, but once you master the rhythm so to speak, you will be saved from countless unnecessary losing trades. The following is a list of what we look for:
- A break/retest of supply or demand dependent on which way you’re trading.
- A trendline break/retest.
- Buying/selling tails/wicks – essentially we look for a cluster of very obvious spikes off of lower timeframe support and resistance levels within the higher timeframe zone.
- Candlestick patterns. We tend to stick with pin bars and engulfing bars as these have proven to be the most effective.
We typically search for lower-timeframe confirmation between the M15 and H1 timeframes, since most of our higher-timeframe areas begin with the H4. Stops are usually placed 1-3 pips beyond confirming structures.
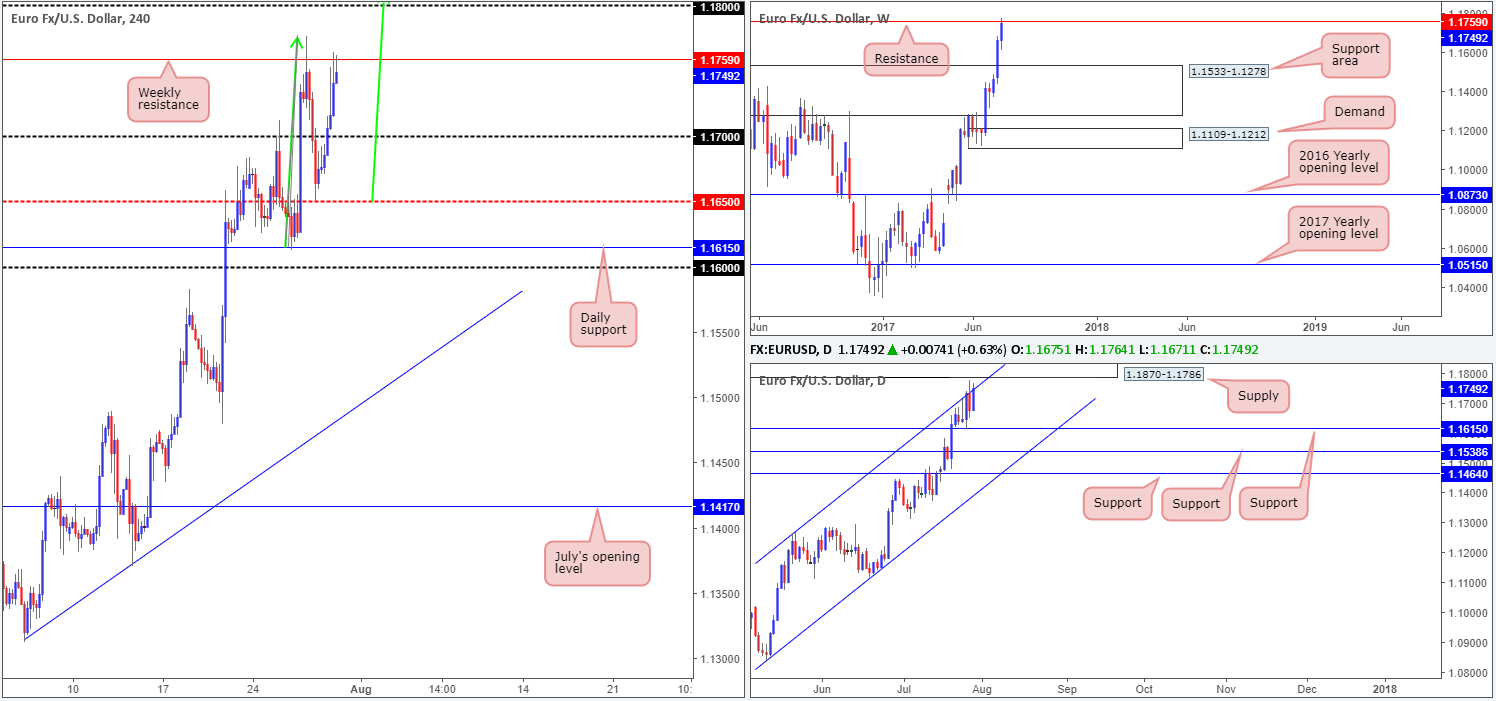
EUR/USD:
Weekly gain/loss: + 86 pips
Weekly closing price: 1.1749
The EUR/USD market enjoyed another relatively successful week, chalking in its third consecutive weekly bullish candle. In order for the bulls to continue pushing higher this week, however, weekly resistance at 1.1759 will need to be taken out. A decisive close above this line will likely see the major approach a weekly resistance planted at 1.2044.
Turning our attention to the daily timeframe, we can see that price spent the majority of the week clinging to the underside of a channel resistance extended from the high 1.1268. Also noteworthy is the fresh (strong-looking) supply lurking a few pips ahead of current price at 1.1870-1.1786.
A quick recap of Friday’s action on the H4 chart shows the unit extended Thursday’s bounce from the mid-level support at 1.1650 on Friday. The 1.17 handle was all but ignored, allowing price to end the week shaking hands with weekly resistance at 1.1759 going into the close.
Our suggestions: Upside momentum is, we agree, incredibly strong at the moment. Nevertheless, is it about time for the single currency to reverse? The reason we ask this is due to the following technical elements:
- Weekly resistance at 1.1759.
- Daily channel resistance, followed closely by daily supply at 1.1870-1.1786.
- H4 round number 1.1800, H4 resistance at 1.1812 and a nice-looking H4 AB=CD approach in the making (see green arrows) that terminates around the 127.2% Fib ext. at 1.1823.
Personally speaking, we feel a bounce is likely to be seen from the 1.1823/1.1800 H4 area sometime this week. Not only is it packed full of H4 confluence, it is also located just above weekly resistance and seen positioned within the walls of a daily supply!
Data points to consider: No high-impacting news events scheduled on the docket today.
Levels to watch/live orders:
- Buys: Flat (stop loss: N/A).
- Sells: 1.1823/1.1800 region (stop loss: aggressive –1.1825, conservative –1.1872).
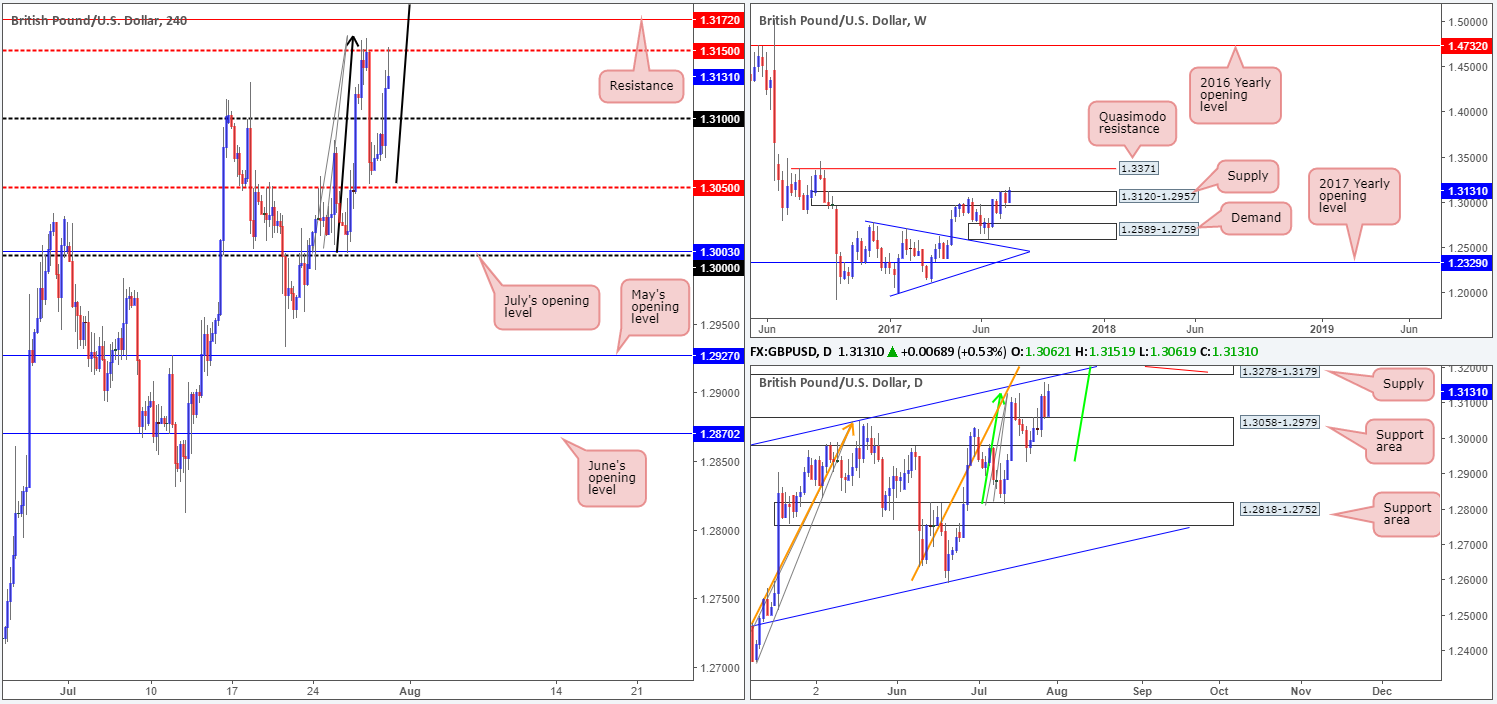
GBP/USD:
Weekly gain/loss: + 138 pips
Weekly closing price: 1.3131
(UPDATED STRUCTURE SINCE LAST POST)
Weekly supply at 1.3120-1.2957 is, once again, trading under pressure. A near-full-bodied weekly bull candle was printed during last week’s segment, forcing the market to a fresh high of 1.3158. Assuming that the buyers continue to govern direction here, this could eventually lead to a move being seen up to a weekly Quasimodo resistance planted at 1.3371.
Although the bulls look set to lift the unit higher on the weekly chart, the candles are painting an entirely different landscape on the daily chart right now! Directly ahead of price is a supply seen at 1.3278-1.3179 that is overflowing with confluence to sell. We have a channel resistance line drawn from the high1.2774, a trendline resistance taken from the high 1.3477 and two converging AB=CD (green/orange arrows) 127.2 Fib extensions at 1.3222/1.3223 (taken from the lows 1.2811/1.2365).
Looking across to the H4 timeframe, the 1.31 handle, although it did manage to hold price lower for a couple of hours, was engulfed on Friday, consequently opening up the path north for the market to challenge the mid-level resistance at 1.3150. Interestingly, this has seen price begin forming a D-Leg to a potential AB=CD bearish pattern (black arrows) that completes a few pips above the 1.32 handle at 1.3207 (the 127.2% Fib ext.).
Our suggestions: Given that it is not yet clear whether the weekly bears have given up the fight at the current weekly supply, there’s a strong possibility that this market may turn lower from the aforementioned daily supply in the coming week. We say this simply due to the amount of confluence we’ve been able to note.
An ideal selling spot for us is between 1.3223 and 1.32. The harmonics in play here is just mouthwatering: two daily AB=CD bearish formations coupled with another H4 AB=CD bearish pattern! Bundle this together with the daily channel resistance, the daily trendline resistance and the daily supply, and we have ourselves a strong sell zone!
Data points to consider: No high-impacting news events scheduled on the docket today.
Levels to watch/live orders:
- Buys: Flat (stop loss: N/A).
- Sells: 1.3223/1.32 region (stop loss: aggressive – 1.3225, conservative –1.3280).
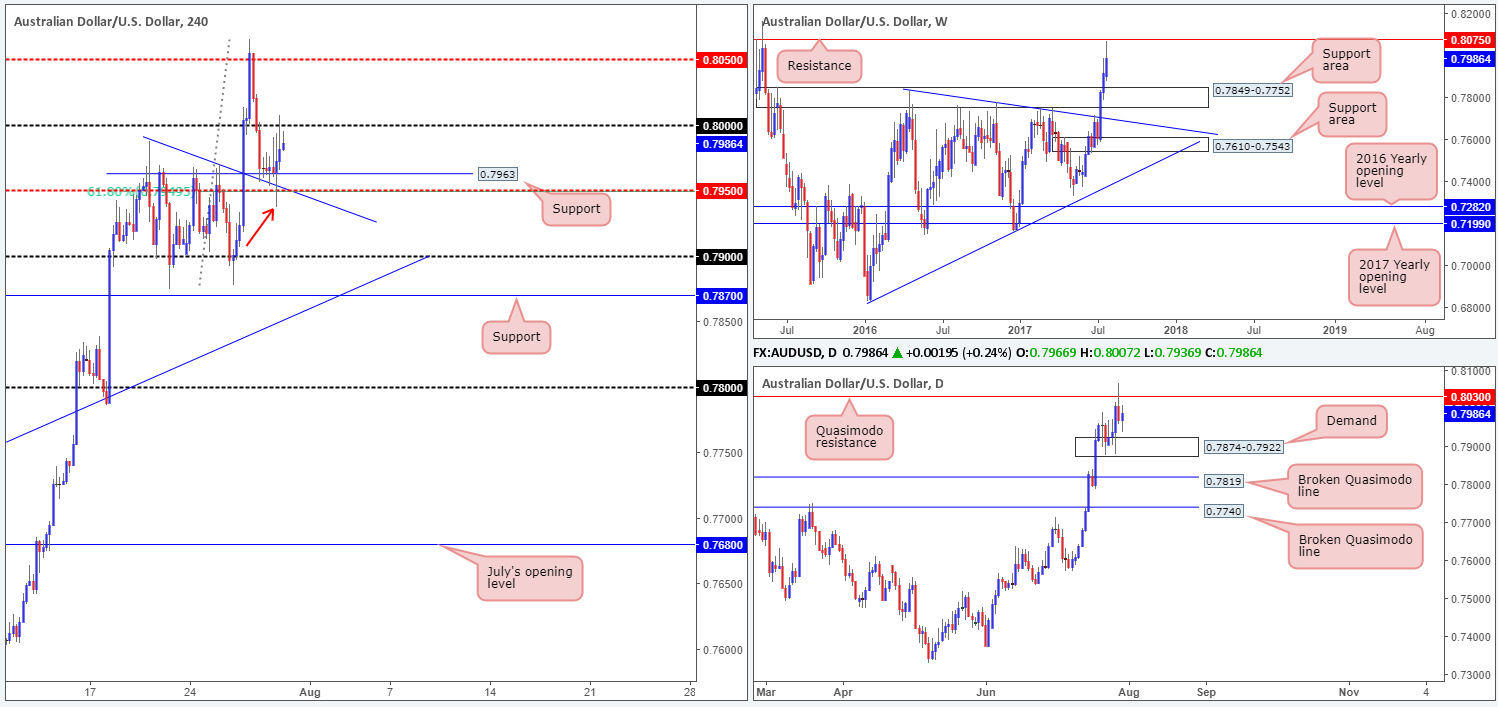
AUD/USD:
Weekly gain/loss: + 74 pips
Weekly closing price: 0.7986
Although buyers printed a third consecutive weekly bull candle last week, a moderate end-of-week correction was seen after the commodity currency came within touching distance of a weekly resistance pegged at 0.8075. Should this encourage sellers into the market, we could see price trade as low as the weekly support area marked at 0.7849-0.7752.
In conjunction with the weekly timeframe, the daily Quasimodo resistance at 0.8030 managed to cap upside on Thursday, which could lead to a move being seen down to daily demand located nearby at 0.7874-0.7922. A break below this area, nonetheless, would almost immediately bring one into close contact with the top edge of the said weekly support area, which, as you can see, also holds a daily broken Quasimodo line at 0.7819 within.
Given how close weekly price came to testing resistance, and the recent interaction with the daily Quasimodo resistance, we are a tad surprised to see how well the H4 support at 0.7963 (converges with a H4 trendline support taken from the high 0.7987, a nearby H4 mid-level support at 0.7950 and also a H4 61.8% Fib support at 0.7950 drawn from the low 0.7877) held on Friday.
Our suggestions: The low seen marked with a red arrow on the H4 chart at 0.7936 likely triggered a truckload of stop-loss orders, and thus weakened the 0.7950/0.7963 area .So, with that said, what about shorting from the 0.80 handle? This could be something to consider, but do bear in mind that beyond the 0.7950 neighborhood price may struggle to reach 0.79 seeing as how the top edge of the current daily demand is sited at 0.7922.
For us, we have decided to remain flat for the time being and will look to reassess price action going into Tuesday’s open…
Data points to consider: No high-impacting news events scheduled on the docket today.
Levels to watch/live orders:
- Buys: Flat (stop loss: N/A).
- Sells: Flat (stop loss: N/A).
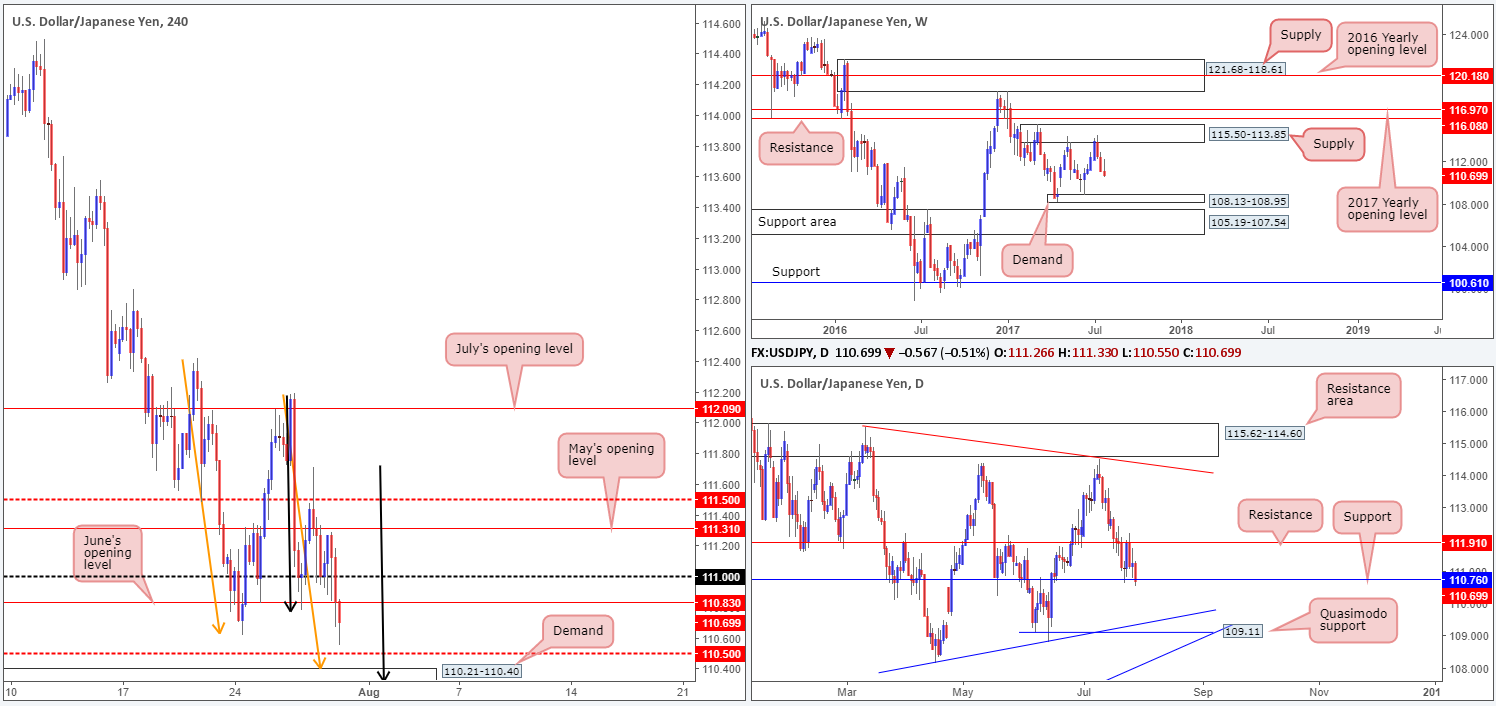
USD/JPY:
Weekly gain/loss: – 43 pips
Weekly closing price: 110.69
From the weekly timeframe it’s clear to see that the pair sustained further losses last week, registering its third weekly bearish close. Technically speaking, the market looks as though it could continue to press lower until we reach the small demand base seen at 108.13-108.95.
Zooming in and looking at the daily picture shows us that price concluded the week marginally closing beyond support at 110.76. In theory, this move could have potentially cleared the river south down to a Quasimodo support logged at 109.11, which happens to unite closely with a trendline support etched from the low 108.13.
A brief look at recent dealings on the H4 chart reveals that the bulls eventually threw in the towel around the 111 handle, allowing the unit to test, and ultimately engulf, June’s opening level at 110.83. What’s also notable from a technical perspective here is the two AB=CD bullish patterns in the making (black/orange arrows). Both terminating around the top edge of a small demand base at 110.21-110.40, this area is, in our opinion, stable enough to bounce price this week since it was formed on the break of a Quasimodo left shoulder at 110.27. In addition to the Harmonics, we also like the fact that the mid-level number 110.50 is positioned directly above. A great deal of traders look to buy these levels and place stops a few pips below. By driving through this level, sell stops will be filled from both buyers looking to long and sellers looking to play the breakout, and therefore provide liquidity for the big boys to buy.
Understandably, the only grumble we have buying from the small H4 demand is the higher-timeframe picture, which suggests further selling may be on the horizon (see above).
Our suggestions: Watch for H4 price to test demand at 110.21-110.40 and, depending on the time of day, look to buy at market with stops positioned just below the said demand at 110.19. Ideally, we’d be looking to target June’s opening level at 110.83 to take partial profits. We would also adivse moving stops to breakeven as soon as a H4 close is registered above 110.50, since let’s not forget that we would effectively be going against higher-timeframe flow here!
Data points to consider: No high-impacting news events scheduled on the docket today.

Levels to watch/live orders:
- Buys: 110.21-110.40 (stop loss: 110.19).
- Sells: Flat (stop loss: N/A).
USD/CAD:
Weekly gain/loss: – 105 pips
Weekly closing price: 1.2435
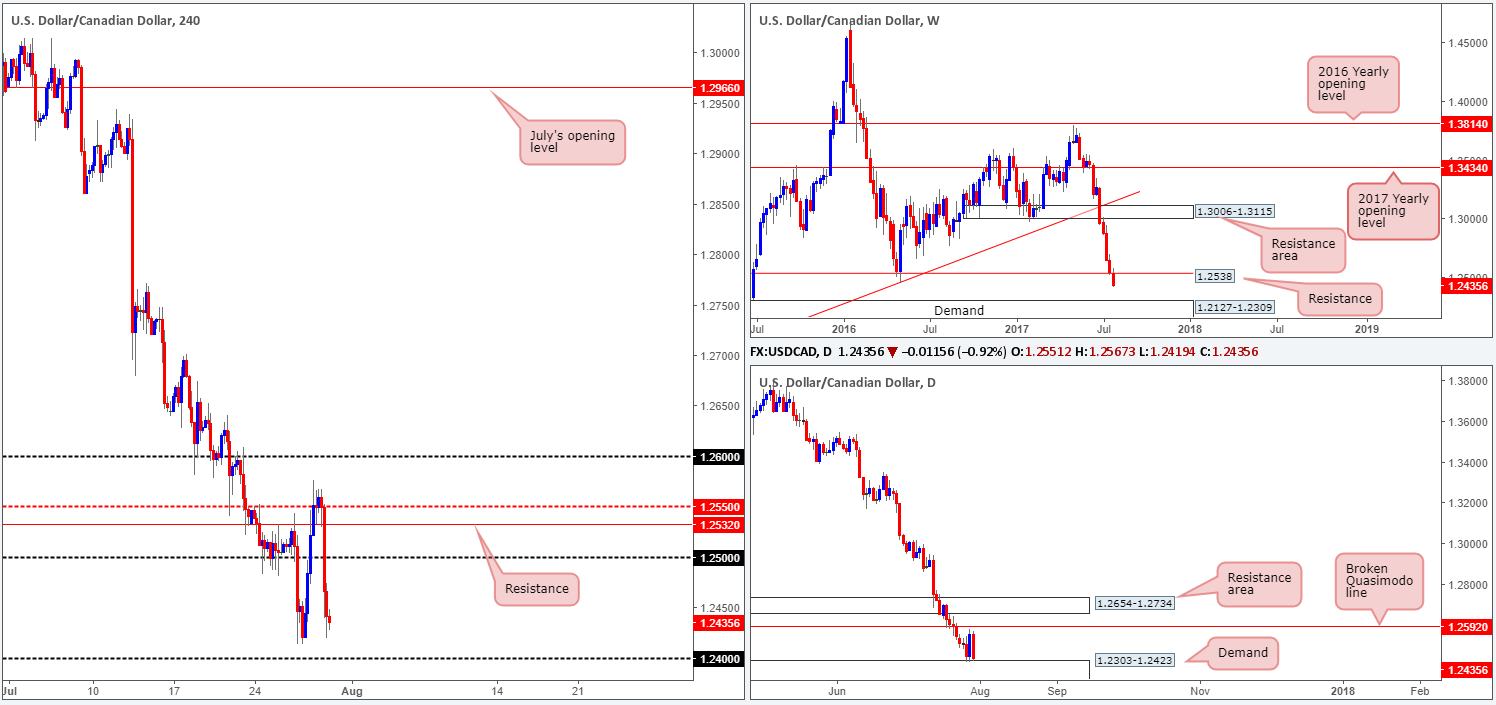
For approximately three months now, the USD/CAD has been entrenched within a rather strong down move. Of late, we saw the unit cross below a major weekly support level coming in at 1.2538. Should further selling be seen as a result of this, the next target on the hit list can be seen around weekly demand pegged at 1.2127-1.2309.
Stepping down to the daily timeframe, nevertheless, price is seen supported by demand coming in at 1.2303-1.2423, which happens to be glued to the top edge of the weekly demand mentioned above. Also of note here are Thursday and Friday’s candles, as combined they form a strong selling wick i.e. a bearish pin-bar candle.
Influenced by a robust Canadian growth report on Friday, the H4 candles aggressively drove lower. The move took out the 1.25 handle and eventually pushed to lows of 1.2419 on the day. As should be obvious from looking at the H4 chart, the next support level on tap is the psychological band 1.24. Additionally, we can see that directly below this number is a support level marked at 1.2362.
Our suggestions: At the time of writing, we do not see much to hang our hat on. Buying from 1.24 or even the H4 support below it at 1.2362 is tempting, given that they’re both positioned within the walls of the current daily demand. However, judging by the strength of the sellers over the past few months, it is likely that weekly price will want to connect with the aforesaid weekly demand before any serious buyers get involved.
Therefore, we have decided to hold fire for the time being and remain on the sidelines.
Data points to consider: No high-impacting news events scheduled on the docket today.
Levels to watch/live orders:
- Buys: Flat (Stop loss: N/A).
- Sells: Flat (Stop loss: N/A).
USD/CHF:
Weekly gain/loss: + 229 pips
Weekly closing price: 0.9685
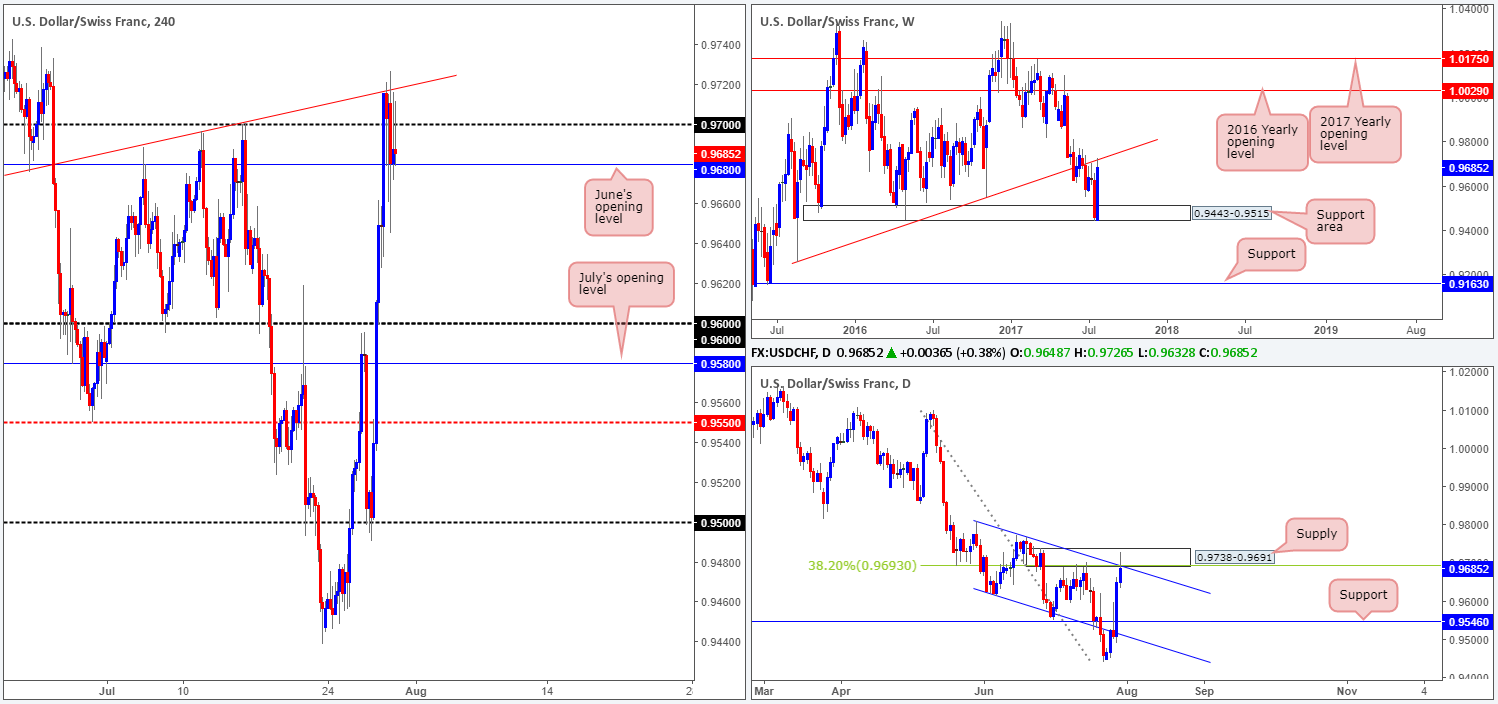
A stronger-than-expected bounce was seen from the weekly support area at 0.9443-0.9515 last week, consequently lifting the market to a high of 0.9726. As you can see, the move erased all of the prior week’s losses and engulfed two additional weekly candles in the process. What’s also interesting is price reacted nicely to a trendline resistance extended from the low 0.9257, which is something we failed to see before.
Turning over a page to the daily timeframe, price recently connected with supply logged at 0.9738-0.9691. This area also happens to converge with a channel resistance extended from the high 0.9808 and a 38.2% Fib resistance at 0.9693 taken from the high 1.0099.
For those who read Friday’s report you will likely remember that our desk took a short from 0.9694 and placed a stop above the current daily supply at 0.9740. From the H4 chart, you’ll notice that the unit also reacted from a nice-looking minor trendline resistance extended from the low 0.9675 seen positioned just above 0.97. Once our position hit one times our risk following US growth data, we moved the stop-loss order to breakeven since we were not keen (unless price was over two times the risk) on leaving the trade open over the weekend. Unfortunately, shortly after moving to breakeven we were stopped out!
Our suggestions: With H4 price currently seen bolstered by June’s opening level at 0.9680, we would not advise selling this market right now. A decisive H4 close below this number on the other hand would, in our humble opinion, be a valid sell signal. Be that as it may, before we’d consider selling we would need to see the pair retest 0.9680 as resistance and hold firm in the shape of a full or near-full-bodied bear candle. The initial take-profit target on this scale would be the 0.96 handle, followed closely by July’s opening level at 0.9580 and then daily support positioned at 0.9546.
Data points to consider: No high-impacting news events scheduled on the docket today.
Levels to watch/live orders:
- Buys: Flat (stop loss: N/A).
- Sells: Watch for H4 price to engulf 0.9680 and then look to trade any retest seen thereafter ([waiting for a full or near-full-bodied bearish candle to emerge following the retest is advised] stop loss: ideally beyond the candle wick).
DOW 30:
Weekly gain/loss: + 263 points
Weekly closing price: 21822
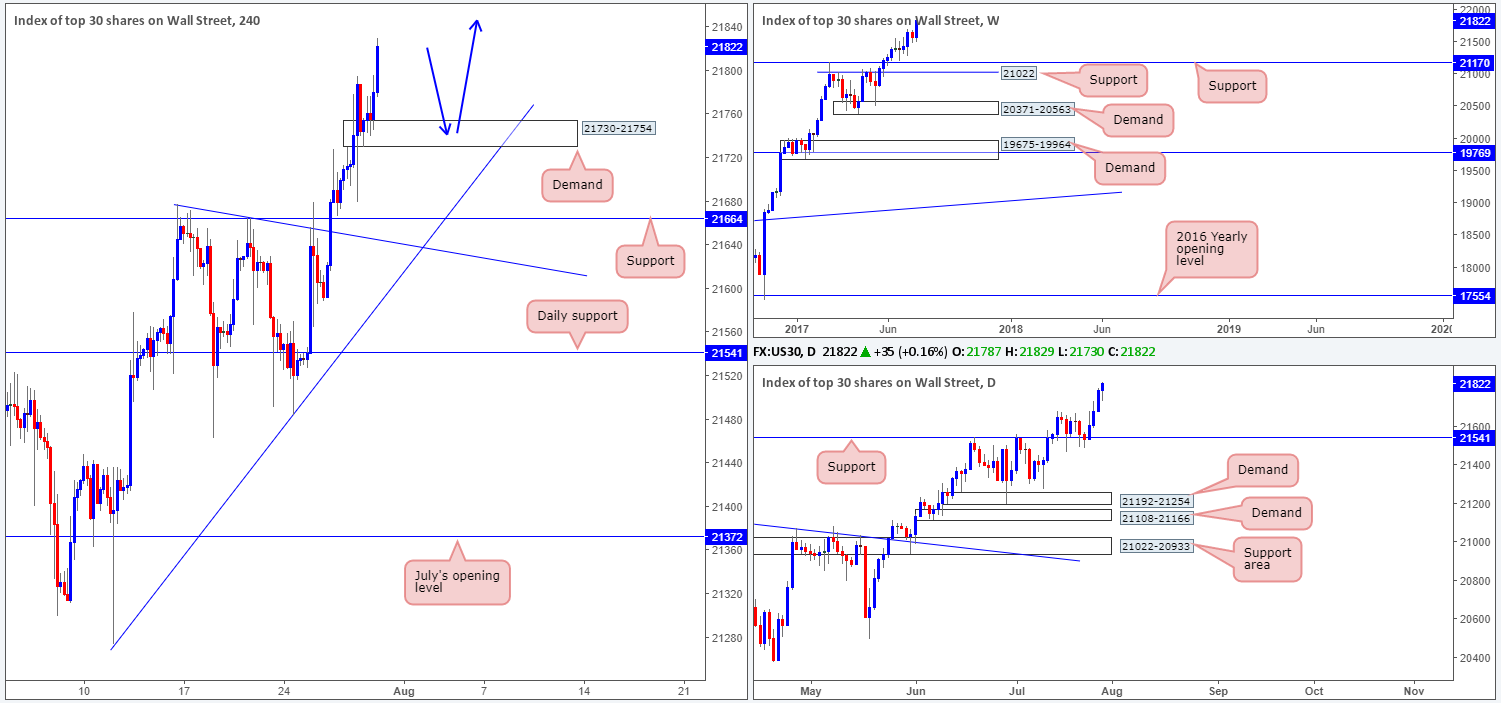
US equities put in a dominant performance last week, printing a sold full-bodied weekly bullish candle at record highs of 21829. From the weekly timeframe, it is clear to see that this market’s underlying trend remains strong. However, should the index pullback, the support level drawn from 21170 is likely the area where we’ll see the bulls recover from.
On the daily timeframe, the candles show that the index gravitated higher since Tuesday after finding a pocket of strong bids from the 21541 neighborhood. Since the unit is trading at all-time highs, we feel that there’s not much else to report on this scale.
With both the weekly and daily charts showing room for further buying, we are now watching for H4 price to pullback and test the newly formed H4 demand base at 21730-21754 for a possible long trade (blue arrows). While we expect a bounce to be seen from the aforesaid demand zone, we would not feel comfortable placing pending orders here as there’s absolutely no H4 confluence surrounding the area.
Our suggestions: Wait for a H4 bull candle to form (preferably a full-bodied candle) from the current H4 demand and prepare to enter long. The idea behind the additional candle confirmation is that it shows buyer intent, and therefore adds weight to the zone before committing.
Data points to consider: No high-impacting news events scheduled on the docket today.
Levels to watch/live orders:
- Buys: 21730-21754 ([waiting for a full, or near-full-bodied H4 bull candle to form is advised] stop loss: ideally beyond the candle’s tail).
- Sells: Flat (stop loss: N/A).
GOLD:
Weekly gain/loss: + $13.8
Weekly closing price: 1268.7
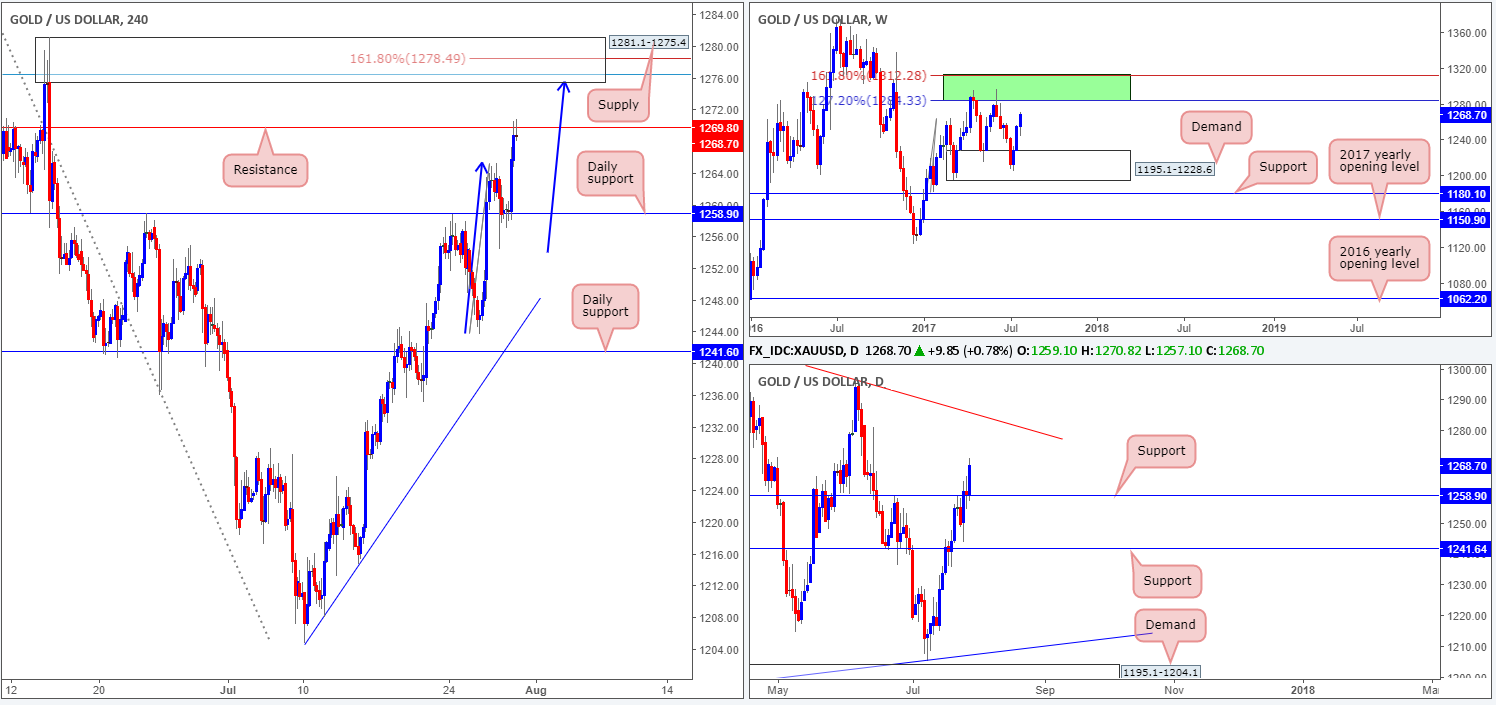
As can be seen from the weekly timeframe the gold market remained strongly bid last week, placing the metal within striking distance of an area comprised of two Fibonacci extensions 161.8/127.2% at 1312.2/1284.3 taken from the low 1188.1 (green zone). Already capping upside on two occasions, will we see history repeat itself from the green area this week?
A closer look at price action on the daily timeframe shows price used support at 1258.9 to trade higher on Friday. Should the bulls remain in position, the next upside hurdle in the firing range will likely be the trendline resistance extended from the high 1337.3.
Moving across to the H4 timeframe, we can see that price stalled at resistance drawn from 1269.8 going into the closing bell. The H4 supply at 1281.1-1275.4 seen above this line, however, is interesting. Encased within the area is a H4 AB=CD (blue arrows) 161.8% Fib ext. at 1278.4 drawn from the low 1243.6, and a H4 78.6% Fib resistance (blue line) at 1276.5 taken from the high 1296.0. The question is, will this H4 supply be enough to halt further buying, as both the weekly and daily timeframes show room to trade beyond this zone?
Our suggestions: Despite the confluence, we would strongly recommend waiting for additional candle confirmation to form from the current H4 supply, before pulling the trigger. Should one short the current H4 supply, you are effectively trading against higher-timeframe flow here and by doing so you are putting yourself at extra risk, in our opinion.
Personally speaking, we are going to refrain from taking shorts here. The feeling of going against higher-timeframe buyers from the H4 area just doesn’t sit right with us.
Levels to watch/live orders:
- Buys: Flat (stop loss: N/A).
- Sells: Flat (stop loss: N/A).


