
Key risk events today:
Limited.
(Previous analysis as well as outside sources – italics).
EUR/USD:
Weekly gain/loss: +0.92%
Weekly close: 1.1902
Weekly perspective:
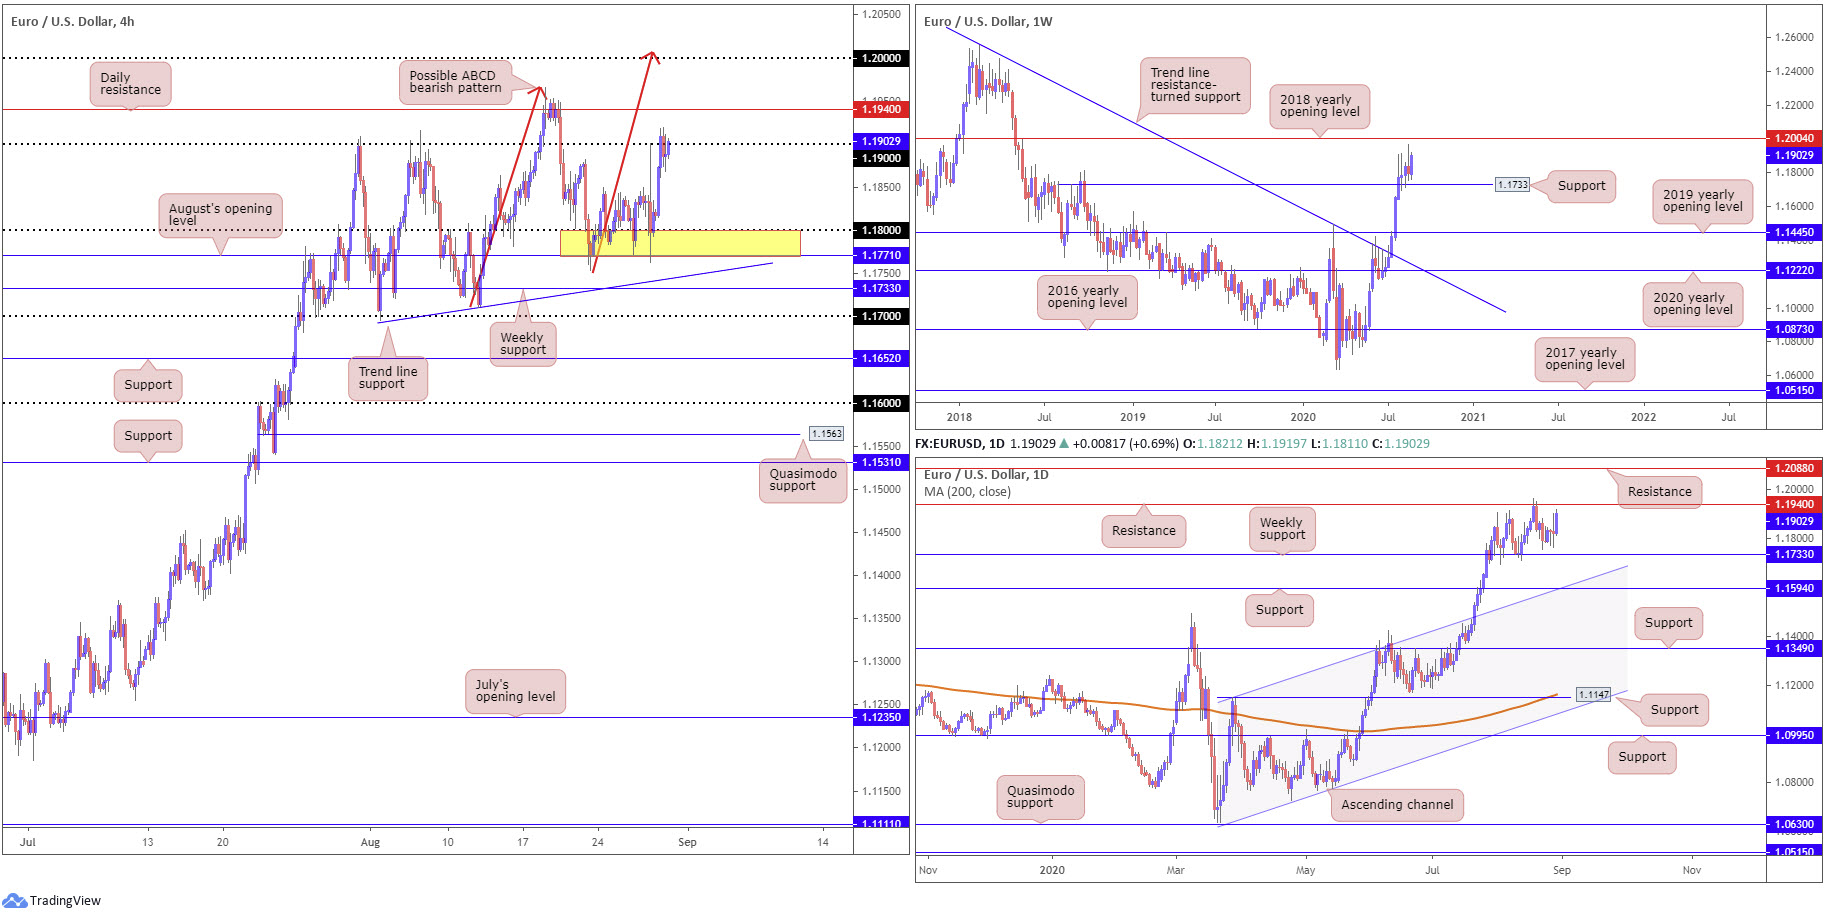
Recent USD softness – the US dollar index explored space beneath 92.50 – has likely side-lined hopes of a recovery, with the DXY now perhaps pushing for the 91.00 handle. As Europe’s shared currency represents the largest component in the dollar index, EUR/USD left support at 1.1733, a prior Quasimodo resistance level, unchallenged and approached higher levels last week.
The break of trendline resistance (July 13), extended from the high 1.2555, and recent upside, shows buyers are in control right now, with the 2018 yearly opening level at 1.2004 arranged as the next resistance target this week.
Daily perspective:
Resistance at 1.1940 was brought to attention in recent trading, a level displaying history as far back as December 2017.
As weekly support, mentioned above at 1.1733, failed to make an appearance last week, the aforementioned daily resistance level could enter the fold in early trading this week, with a break not only providing an early cue that we may reach for the 2018 yearly opening level at 1.2004 on the weekly timeframe, but also daily resistance fixed at 1.2088.
H4 perspective:
Combined, August’s opening level at 1.1771 and the 1.18 handle (yellow) did a superb job capping downside attempts during the week and concluded with Friday shaking hands with the 1.19 neighbourhood. As evident from the H4 chart, daily resistance at 1.1940 resides above 1.19, with a break here potentially setting the technical stage towards the key figure 1.20. Traders may also wish to acknowledge a possible H4 ABCD bearish approach (red arrows) at 1.2007.
Areas of consideration:
According to chart studies, a couple of scenarios could come about this week:
- A fakeout above 1.19 could be seen, tripping buy-stop liquidity and testing daily resistance at 1.1940. A H4 close back under 1.19 (off 1.1940) may be considered an intraday sell signal to pullback to 1.18.
- 20 is likely a watched figure this week, not only as a take-profit target for bullish themes, but also as a potential reversal zone given the H4 ABCD confluence and weekly resistance at 1.2004.
- Failure to sustain gains above 1.19 could lead to price revisiting August’s opening level at 1.1771 and the 1.18 handle (yellow [H4]), which could contain selling pressure and offer bullish scenarios to consider.
GBP/USD:
Weekly gain/loss: +2.01%
Weekly close: 1.3347
Weekly perspective:
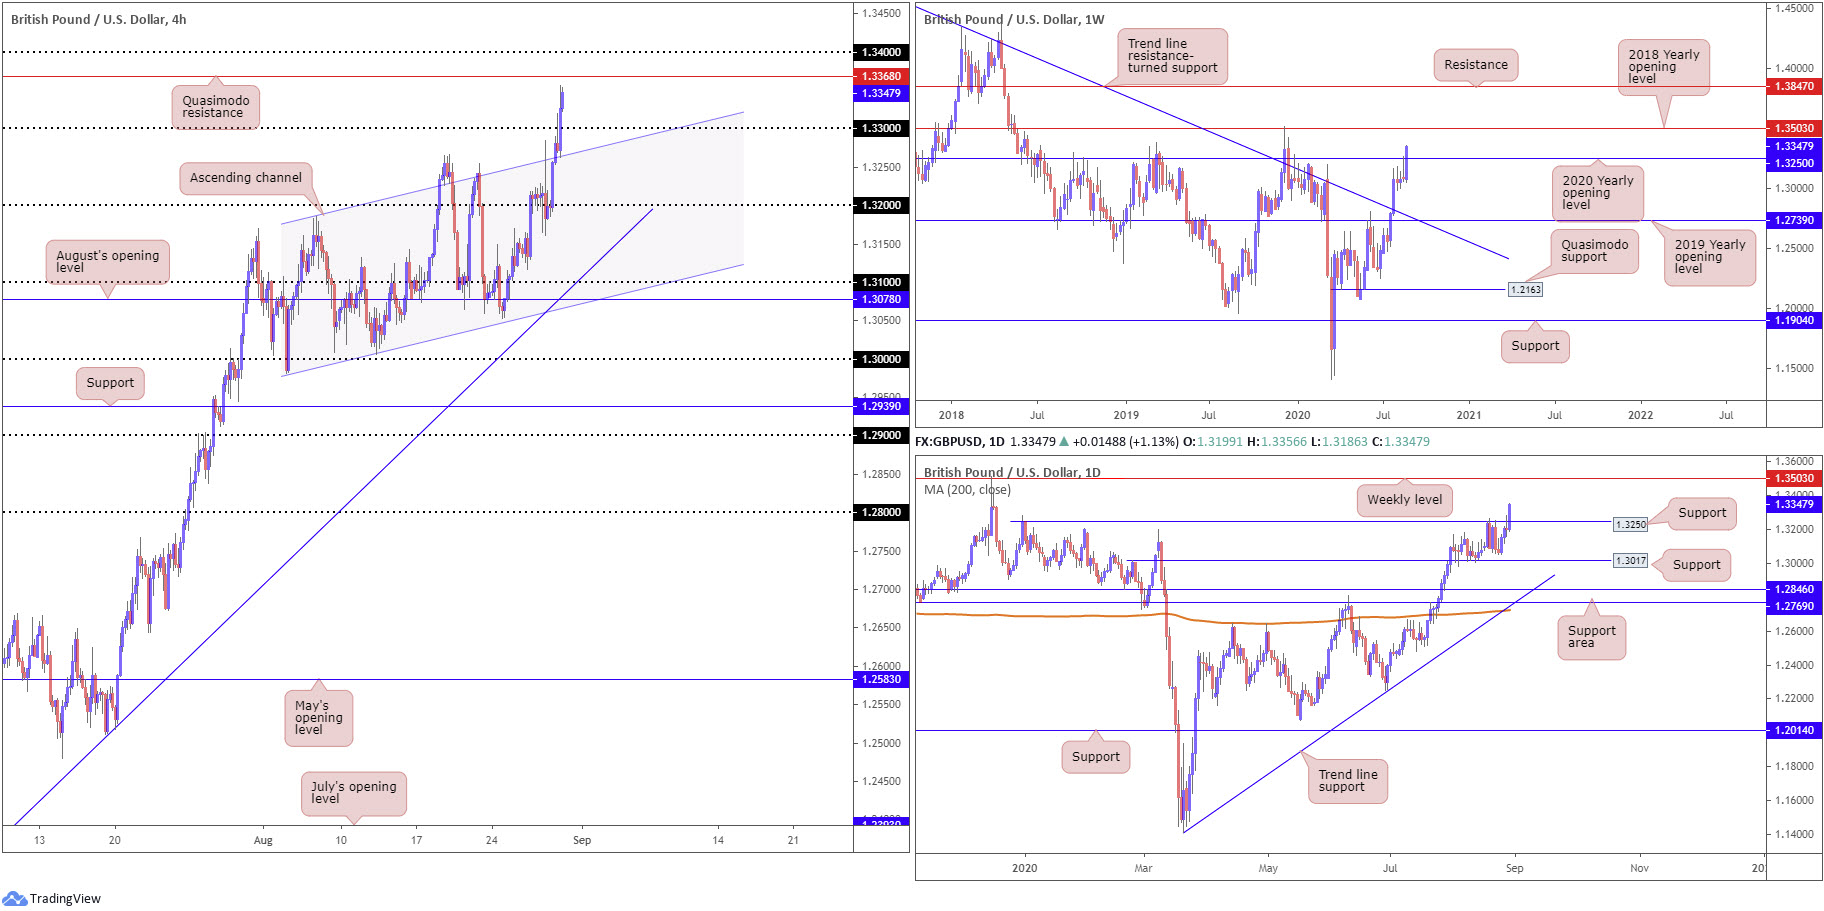
Sterling brushed aside no-deal Brexit jitters last week to pencil in a fresh 2020 peak at 1.3356 against the dollar. This also had price action dominate the 2020 yearly opening level at 1.3250 to perhaps unlock the door to 1.3503, the 2018 yearly opening level.
Before stretching for northerly ground, nevertheless, a 1.3250 retest could take shape.
Daily perspective:
Following a series of attempts to crack through resistance at 1.3250 on the daily timeframe, a barrier sharing the same space with resistance on the weekly timeframe, the 2020 yearly opening level, Friday went forward and mustered enough strength to navigate higher terrain.
This has, in similar fashion to the weekly timeframe, possibly placed the 2018 yearly opening level at 1.3503 on the hit list this week.
H4 perspective:
Fuelled on the back of the DXY sinking to waters beneath 92.50 and a GBP/USD retest at channel resistance-turned support, taken from the high 1.3185, Friday observed H4 candles take on another big figure. Scope for further buying north of 1.33 is seen towards Quasimodo resistance plotted at 1.3368, and ultimately, with a push, the 1.34 handle.
Areas of consideration:
Higher timeframe action securing ground above 1.3250 (the 2020 yearly opening level) and, on the H4 timeframe, above 1.33, motions across a bullish environment this week.
H4 traders may already be long the break of 1.33 after noting weekly resistance at 1.3250 suffered a hit, with eyeballs fixed on H4 Quasimodo resistance at 1.3368. Conservative players, on the other hand, are likely still on the side lines waiting to see if a retest at 1.33 forms before taking action.
AUD/USD:
Weekly gain/loss: +2.88%
Weekly close: 0.7364
Weekly perspective:
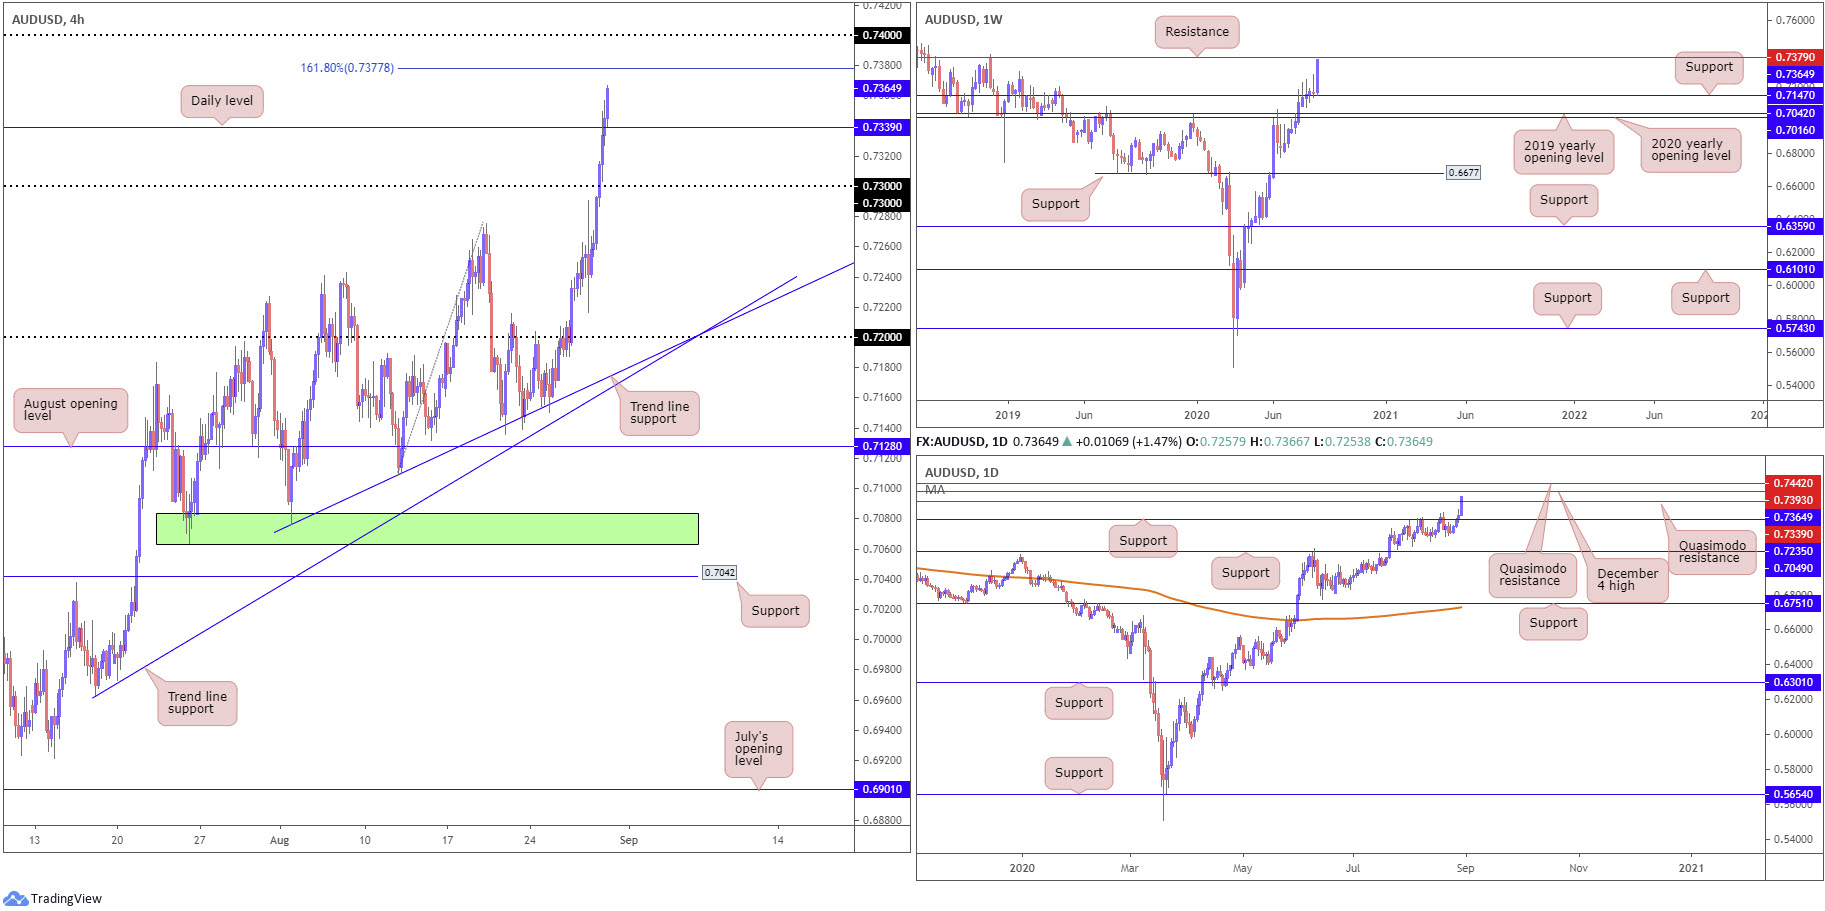
The Australian dollar, as you can see, posted a strong week, rallying nearly 3% against its US counterpart.
Price action forged a near-full-bodied bullish candle above support at 0.7147 and is seen fast approaching resistance coming in at 0.7379, a level that has boasted reasonably strong S/R since mid-2015.
Daily perspective:
Quasimodo resistance at 0.7339 was taken on Friday, consequently opening upside to the December 4 high at 0.7393 and Quasimodo resistance at 0.7442.
Support on this timeframe rests at 0.7235 this week.
Based on the daily timeframe exhibiting a strong position above its 200-day SMA (orange – 0.6729), along with the dynamic value also clearly rotating higher, this market is considered to be in a reasonably strong uptrend right now.
H4 perspective:
With the US dollar index softening through 92.50 Friday, intraday activity on AUD/USD pulled above the 0.73 handle on the H4 timeframe and shined the spotlight on a 161.8% Fibonacci extension point at 0.7377, followed by the 0.74 handle.
Just above the noted Fibonacci level, traders will note the weekly resistance stationed at 0.7379 and then Dec 4 high at 0.7393 mentioned on the daily timeframe.
Areas of consideration:
Although the market’s trend faces a northerly trajectory right now, considerable resistance is on the horizon. From the weekly timeframe we have marked 0.7379, along with the daily timeframe showing potential resistance at the December 4 high drawn from 0.7393 and Quasimodo resistance at 0.7442, in addition to the H4 timeframe pinning a 161.8% Fibonacci extension point at 0.7377, followed by the 0.74 handle.
In light of the above, bullish themes off 0.7339, the recently engulfed daily Quasimodo resistance, could take form in early trading this week, targeting the above noted resistances.
USD/JPY:
Weekly gain/loss: -0.40%
Weekly close: 105.33
Weekly perspective:
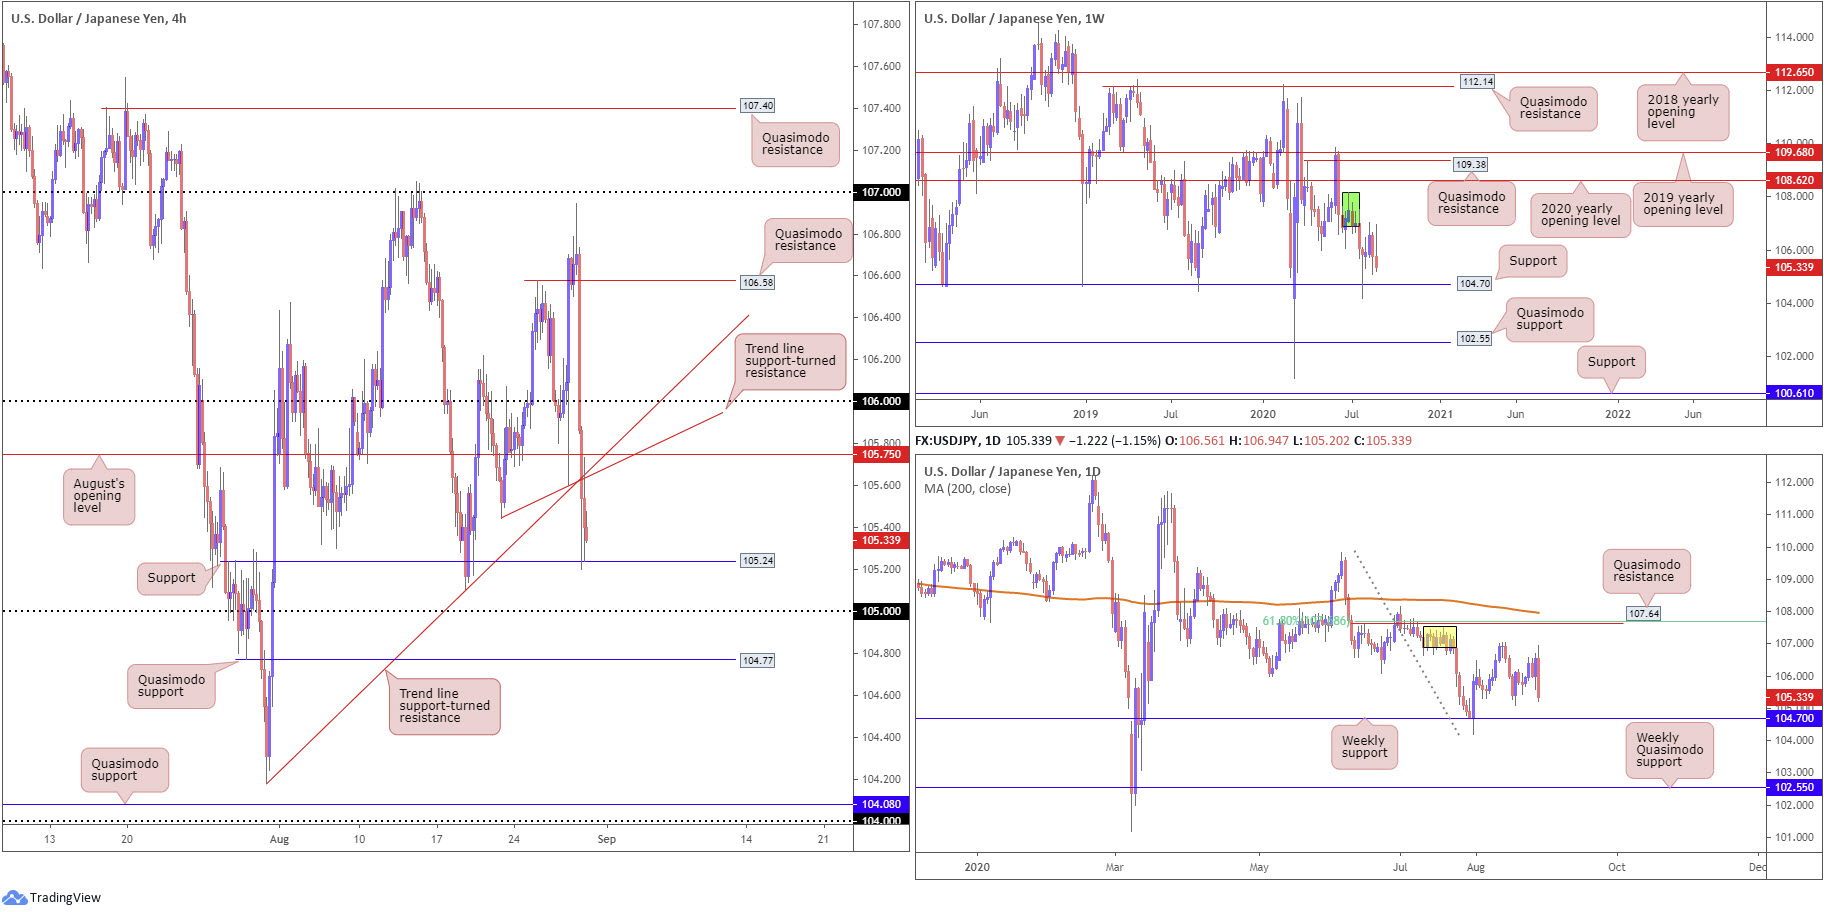
From the weekly timeframe, we can see supply remains prominent at 108.16-106.88 (dark green) after price made its way off support at 104.70 at the end of July. Last week’s movement ended in the form of a strong selling wick, positioning the aforementioned support back in the fold.
Should buyers regain consciousness, the 2020 yearly opening level at 108.62 may enter view, closely followed by Quasimodo resistance at 109.38.
Daily perspective:
Supply at 107.55/106.89 (yellow), an area housed within the lower boundary of the weekly supply mentioned above at 108.16-106.88, is also proving a tough nut to crack. Friday sent across a prominent bearish outside day reversal, shifting focus back to the weekly support underlined above at 104.70.
In the event buyers make a comeback, Quasimodo resistance at 107.64 might enter play, reinforced by a 61.8% Fibonacci retracement ratio at 107.68 and the 200-day SMA (orange – 107.96).
H4 perspective:
USD/JPY plunged more than 1% on Friday as the buck continued to seek lower terrain following the Federal Reserve’s new policy strategy. Also notable was the Japanese Prime Minister Shinzo Abe’s resignation due to health concerns.
Technically, we have sunk through a number of key technical levels and landed at support coming in from 105.24, a prior Quasimodo resistance level. A retest at recently broken trend line supports was also observed (104.18/105.44). As you can see, the 105 handle calls for attention below current support, along with a nearby Quasimodo formation at 104.77.
Areas of consideration:
As both weekly and daily timeframes appear poised to approach weekly support at 104.70, the H4 Quasimodo support at 104.77 may be a location buyers watch this week.
Before voyaging to lower levels, nonetheless, traders are urged to pencil in the possibility of a retest forming at August’s opening level from 105.75 on the H4 timeframe. This could, given the local trend line supports-turned resistances from 104.18 and 105.44, provide a platform for traders to consider bearish strategies, with an ultimate target placed on the weekly support 104.70.
USD/CAD:
Weekly gain/loss: -0.57%
Weekly close: 1.3094
Weekly perspective:
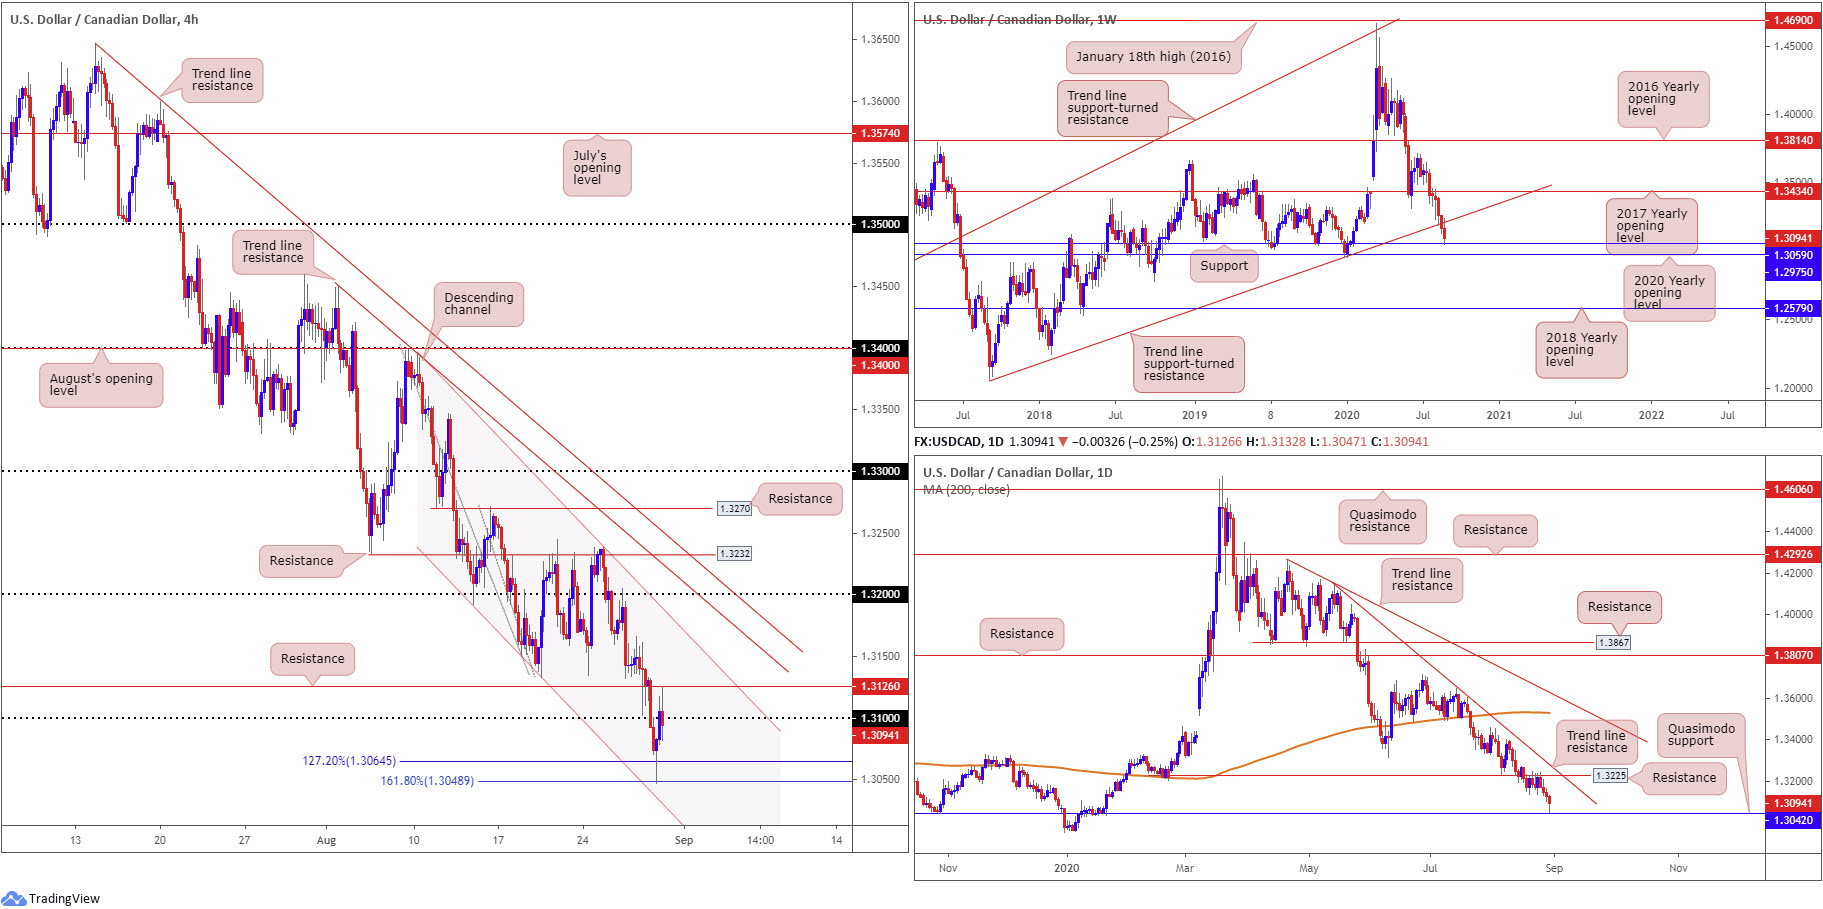
Gliding to a seventh consecutive losing week, price action, after securing ground under the 2017 yearly opening level at 1.3434 in early August and later, the trend line support (taken from the low 1.2061), crossed swords with support at 1.3059, a level positioned just north of the 2020 yearly opening level at 1.2975.
Despite the ongoing retracement slide from the March 16 high at 1.4667, we may observe a recovery attempt form from current support at 1.3059 this week.
Daily perspective:
Since August 18 probed south of Quasimodo support at 1.3225, the level has served well as a resistance. Only in recent sessions, however, have we seen sellers make a show, which elbowed price to within striking distance of Quasimodo support at 1.3042.
Another level worth keeping an eye on this week is trend line resistance, pencilled in from the high 1.4140.
H4 perspective:
Friday, as you can see, recovered from multi-month lows around 1.3047, strengthened on the back of a 127.2% Fibonacci extension point at 1.3064 and a 161.8% Fibonacci extension point at 1.3048 (levels sited just north of channel support [taken from the low 1.3133]). This saw H4 candles whipsaw above 1.31 to resistance at 1.3126 into the close.
Areas of consideration:
Recent moves to the upside, particularly on the H4 scale around resistance at 1.3126/1.31, may be viewed as a selling opportunity this week. This, of course, is in line with the current bearish slide.
However, weekly support at 1.3059 entered the frame last week, which, along with Quasimodo support on the daily timeframe at 1.3042, could stir a recovery and push price through H4 resistances. Therefore, those traders seeking bearish scenarios on the H4 timeframe are likely to wait and see if additional candlestick confirmation forms before pulling the trigger.
USD/CHF:
Weekly gain/loss: -0.78%
Weekly close: 0.9038
Weekly perspective:
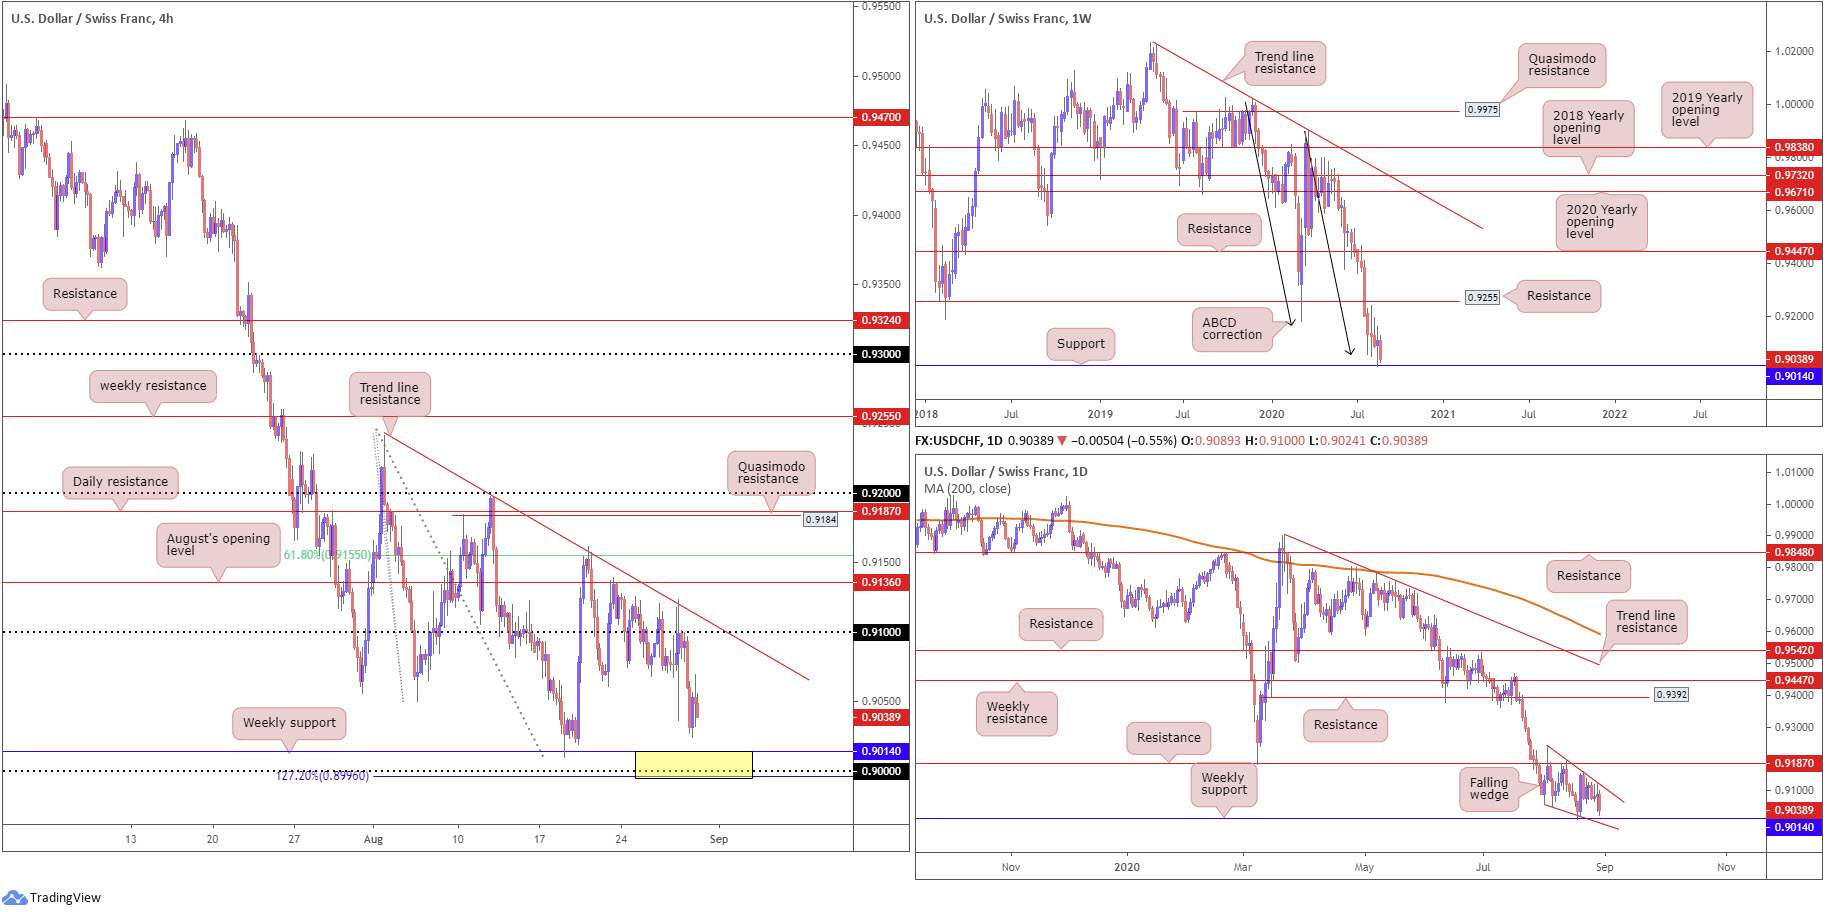
Recent analysis, despite last week concluding lower by 70 pips, discovered support on the weekly timeframe at 0.9014, a level potentially garnering additional impetus from ABCD support at 0.9051 (black arrows). This shines the spotlight on resistance at 0.9255, a prior Quasimodo support level, should we turn higher. Beyond current support, nevertheless, in line with the current trend, the next layer of support is not visible until reaching 0.8792.
Daily perspective:
Out of the daily timeframe, we can see price action still presenting a falling wedge pattern, pencilled in from the high 0.9241 and a low of 0.9056, ahead of the current weekly support. Penetrating this pattern to the upside is likely to shift things to resistance at 0.9187, with a violation then leaning things towards at least weekly resistance mentioned above at 0.9255, and the falling wedge take-profit target (can be measured once a breakout occurs).
H4 perspective:
Following Thursday’s spike through 0.91 to test trend line resistance, taken from the high 0.9241, follow-through selling emerged Friday, in line with the DXY crunching to lows at 92.20. This has, of course, thrown weekly support mentioned above at 0.9014 in the pot as a potential floor this week. What’s interesting is the weekly support comes packed with key psychological support at 0.90 along with a 127.2% Fibonacci extension point at 0.8996 on the H4.
Areas of consideration:
Weekly support at 0.9014 is significant in this market, particularly as it’s joined with a weekly ABCD bullish formation and a falling wedge pattern on the daily timeframe. As such, the area between 0.8996, the 0.90 handle and weekly support from 0.9014 (yellow [H4]) could deliver a solid recovery this week.
Brushing through 0.8996/0.9014, however, is likely to unshackle downside and present healthy breakout signals to at least the 0.89ish region.
Dow Jones Industrial Average:
Weekly gain/loss: +2.69%
Weekly close: 28664
Weekly perspective:
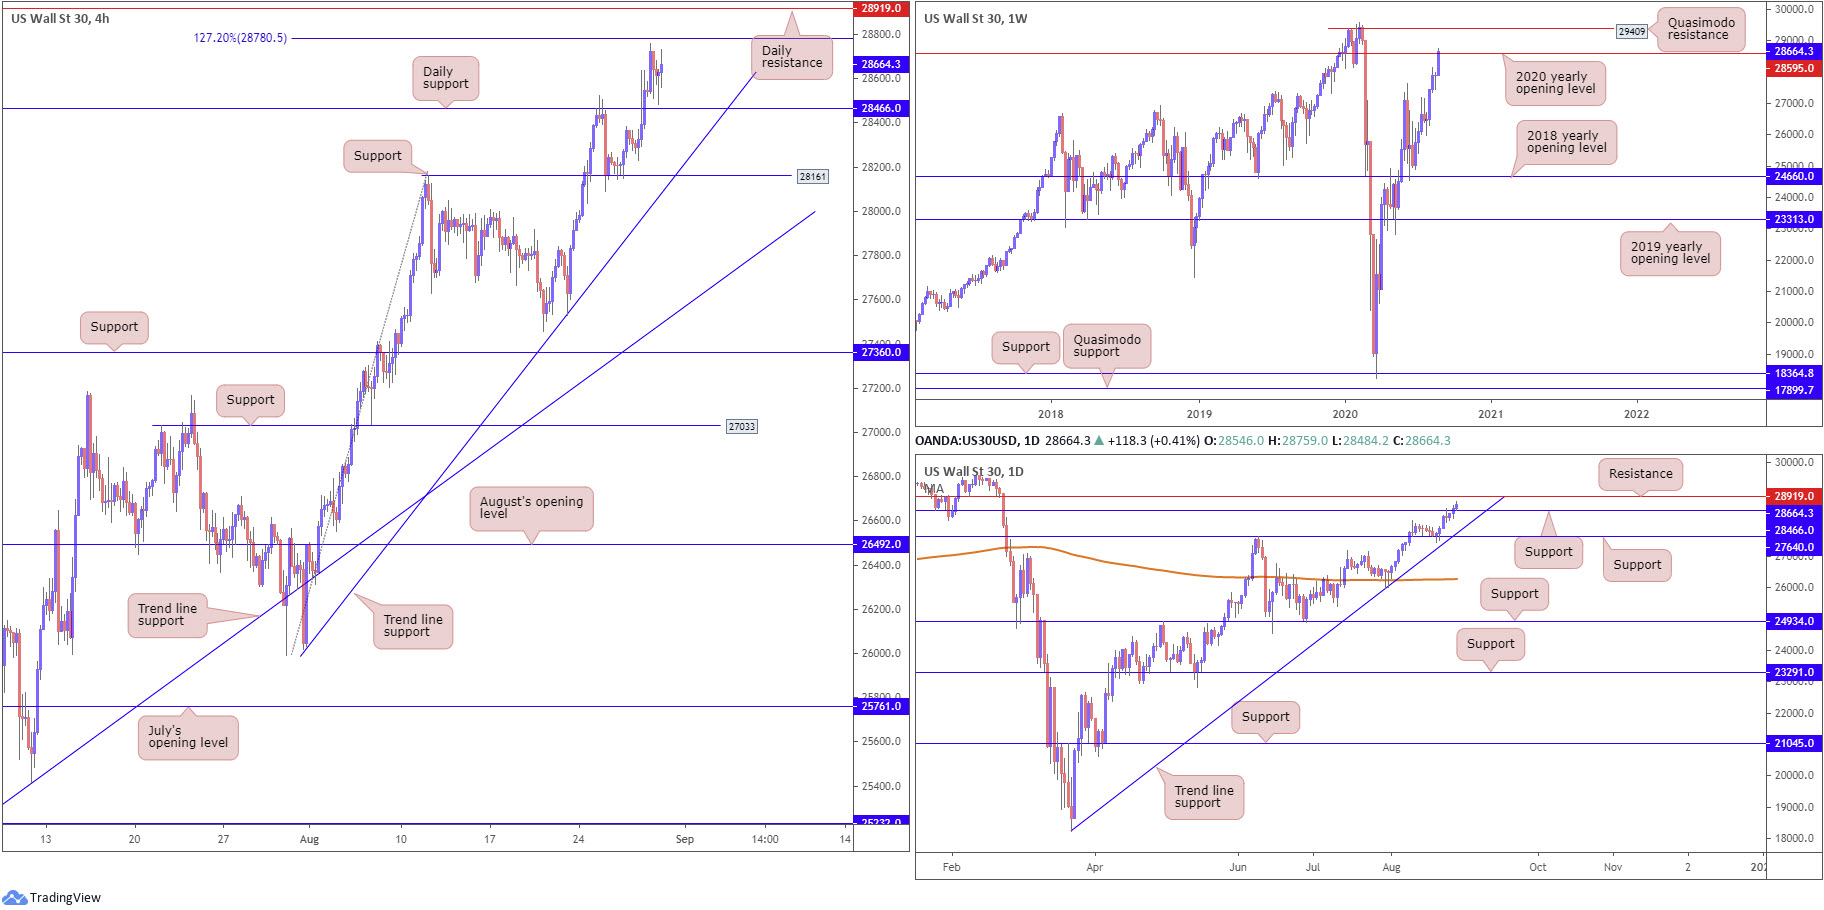
US equities gathered traction last week, adding more than 750 points and eking out a fifth consecutive bullish gain. Overall, the trend has been strongly higher since late March.
Although the pendulum appears to be swinging towards more of a continuation move this week after marginally rupturing the 2020 yearly opening level at 28595, it may be worth waiting for additional bullish activity before presuming the level to be consumed. Further buying, nevertheless, may target Quasimodo resistance seen at 29409.
Daily perspective:
A closer examination of price action on the daily timeframe reveals that current upside still likely has some gas left in the tank after splitting resistance at 28466 (now a serving support), at least until shaking hands with resistance at 28919.
Traders will also acknowledge the 200-day SMA (orange – 26282) has been in a phase of flattening since early July.
H4 perspective:
Major US equity benchmarks finished higher Friday, with the Dow Jones Industrial Average erasing the majority of the year’s losses as investors digested the Fed’s recent announcement surrounding a new strategic framework. The Dow Jones Industrial Average rallied 161.60 points, or 0.57%; the S&P 500 advanced 23.46 points, or 0.67% and the tech-heavy Nasdaq 100 traded higher by 69.69 points, or 0.58%.
With H4 action holding north of daily support at 28466, the 127.2% Fibonacci extension point at 28780 is likely to be tested in early trading this week, followed by daily resistance at 28919 should we push higher. Technical traders will also note, in the event we head south this week, we have H4 support positioned at 28161, sited nearby trend line support, taken from the low 26017.
Areas of consideration:
The mild break of the 2020 yearly opening level at 28595 on the weekly timeframe could be seen by some traders as a bullish signal. Supporting further upside is the daily timeframe recently crossing above resistance at 28466 and H4 showing room to push for at least 28780.
As a result, a retest at daily support from 28466 could be at hand in early trade this week, a move that is likely to entice buying pressure, targeting 28780 on the H4, and possibly daily resistance at 28919.
XAU/USD (GOLD):
Weekly gain/loss: +1.26%
Weekly close: $1,965.02
Weekly perspective:
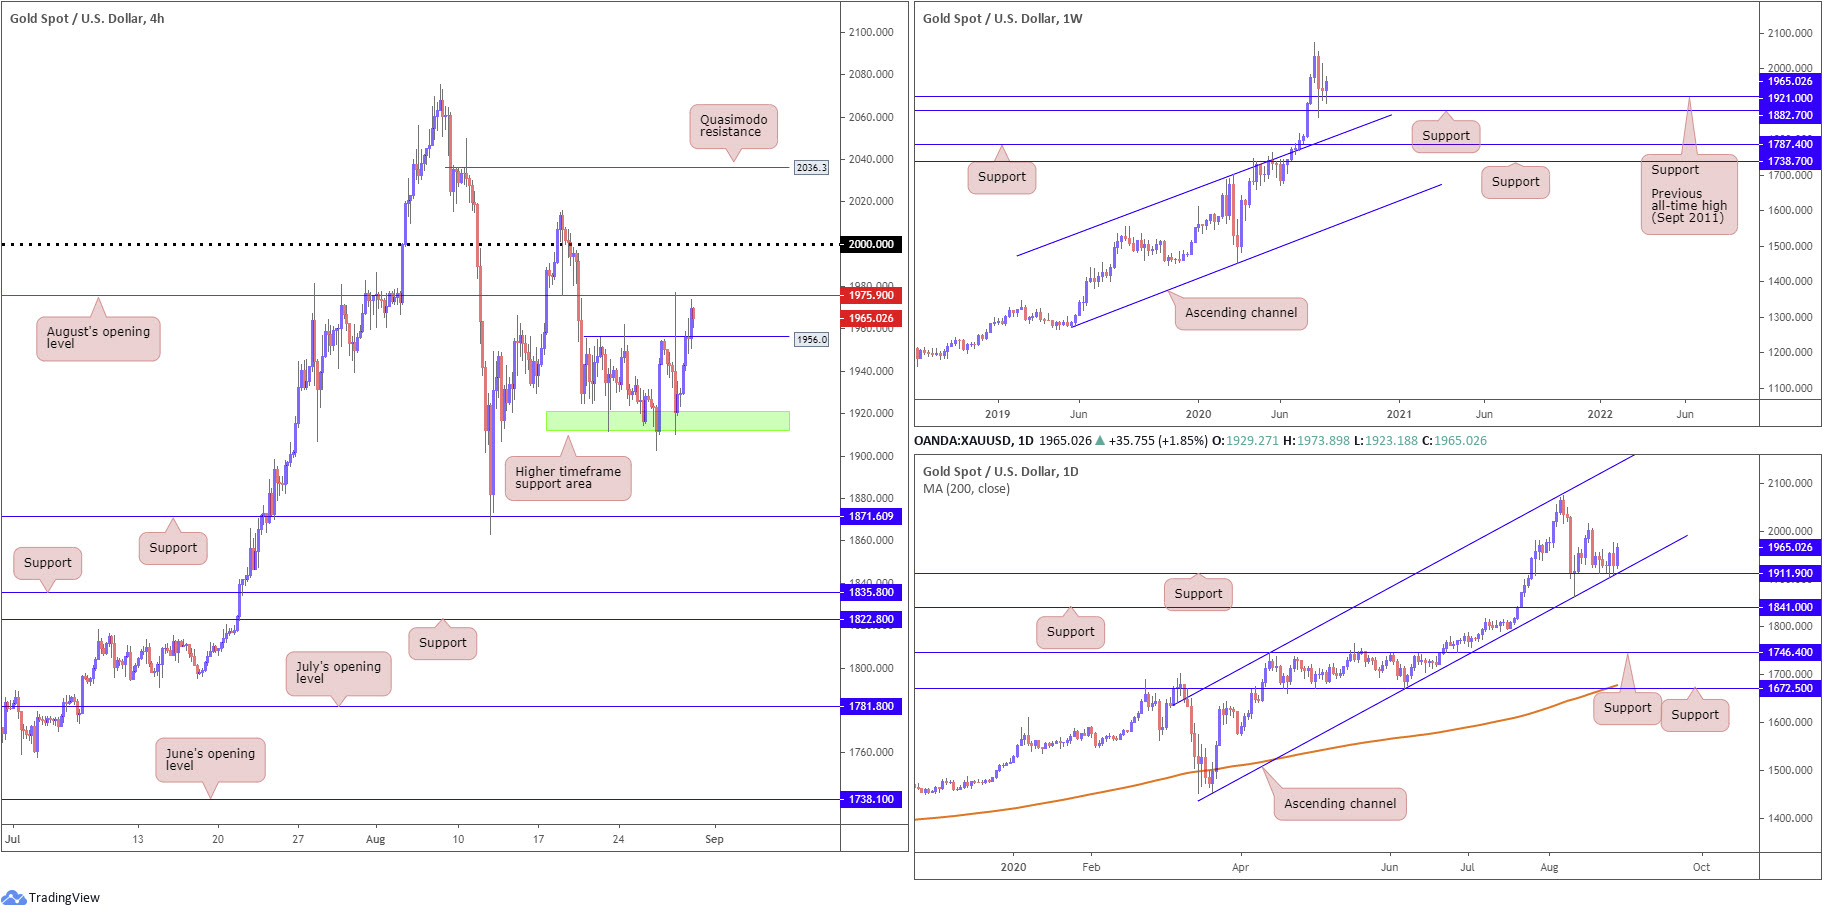
Spot gold finished the week in modestly positive territory, noticeably off $1,921.00 support, the previous major all-time high (September 2011). This is a level sited ahead of support at $1,882.70.
With the current trend trekking north since 2016, the combination of $1,882.70 and $1,921.00 may be enough to encourage additional buying this week, with most targeting all-time peaks at $2,075.28 as the initial point.
Failure to hold gains, we could see channel resistance-turned support, etched from the high $1,703.28, enter play.
Daily perspective:
Channel support, taken from the low $1,455.32, coupled with support at $1,911.90, remains a key point of interest on the daily timeframe. Buyers, as you can see, defended this area last week, with Friday chalking up a near-2% move.
The $2,015.72 August 18 high represents the next possible resistance area, should we continue to climb this week.
H4 perspective:
$1,911.90-$1,921.00 (daily support/weekly support – green) served the market well last week as a support area. This was, you may recall, a noted area to keep a tab on.
Friday, as you can see, had price run through resistance at $1,956.08 (now a serving support), buoyed on the back of the DXY trading lower. Consequently, price movement is now within touching distance of August’s opening level at $1,975.90 (possible resistance).
A break higher exposes $2,000.00 as a potential resistance, followed by the $2,015.72 August 18 high mentioned above on the daily timeframe and then the H4 Quasimodo resistance at $2,036.30.
Areas of consideration:
The reaction from higher timeframe supports at $1,911.90-$1,921.00, together with the current uptrend firmly intact, implies buyers have the upper hand going into the week.
Therefore, a H4 close above August’s opening level at $1,975.90 is likely to trigger breakout buying. A retest of the latter may also draw in additional buying, particularly conservative traders.
Irrespective of the entry above $1,975.90, $2,000.00 is in place as an initial upside hurdle to be aware of.
The accuracy, completeness and timeliness of the information contained on this site cannot be guaranteed. IC Markets does not warranty, guarantee or make any representations, or assume any liability regarding financial results based on the use of the information in the site.
News, views, opinions, recommendations and other information obtained from sources outside of www.icmarkets.com.au, used in this site are believed to be reliable, but we cannot guarantee their accuracy or completeness. All such information is subject to change at any time without notice. IC Markets assumes no responsibility for the content of any linked site.
The fact that such links may exist does not indicate approval or endorsement of any material contained on any linked site. IC Markets is not liable for any harm caused by the transmission, through accessing the services or information on this site, of a computer virus, or other computer code or programming device that might be used to access, delete, damage, disable, disrupt or otherwise impede in any manner, the operation of the site or of any user’s software, hardware, data or property.


