
Key risk events today:
UK Final Manufacturing PMI; Canada Manufacturing PMI; US ISM Manufacturing PMI.
(Previous analysis as well as outside sources – italics).
EUR/USD:
Weekly gain/loss: -1.79%
Weekly close: 1.1645
Weekly perspective:
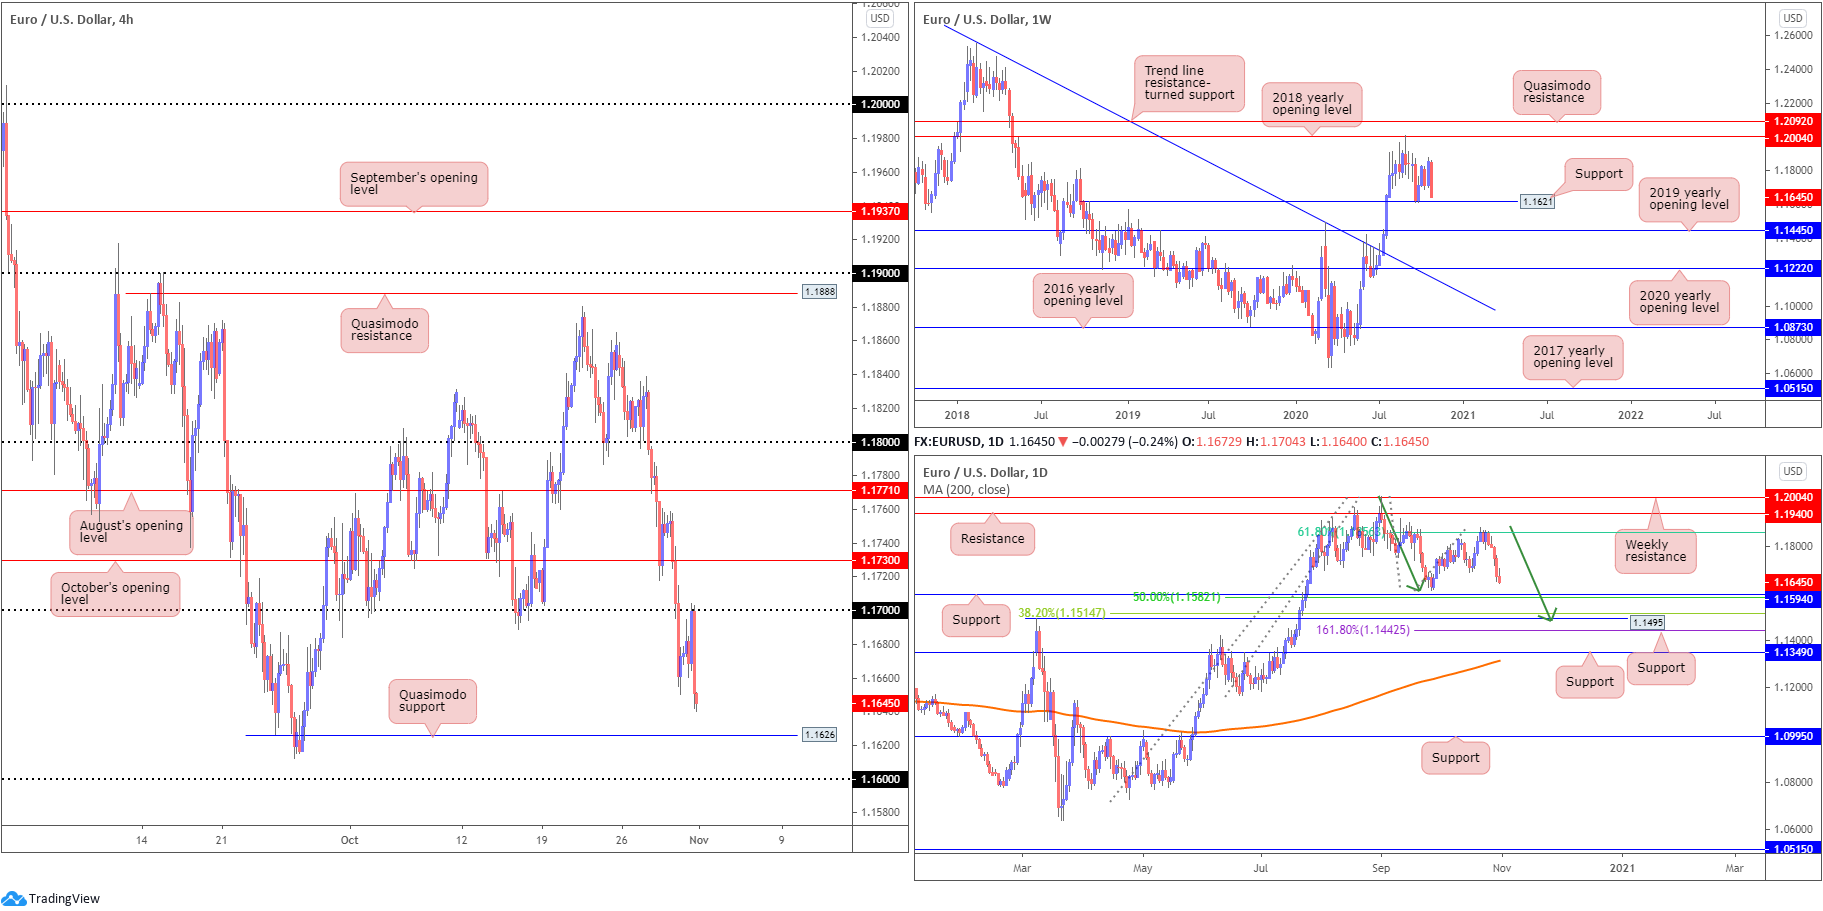
Europe’s single currency subsided nearly 2% against a broadly stronger US dollar last week, side-lining hopes of reaching the 2018 yearly opening value at 1.2004.
In the shape of a near-full-bodied bearish candle, price dramatically engulfed previous gains and closed within striking distance of support at 1.1621. While a recovery off the aforementioned support is not out of the question this week, follow-through selling highlights the 2019 yearly opening value at 1.1445
Daily perspective:
Organised in the form of five consecutive daily bearish candles, sellers strengthened their grip from a 61.8% Fibonacci retracement ratio at 1.1856 last week. This sheds light on support at 1.1594 and a 50.0% retracement ratio at 1.1582.
Gnawing through the aforementioned supports this week, however, could be interesting, spinning the limelight to support at 1.1495 and a 38.2% Fibonacci retracement ratio at 1.1514. Also connecting closely with these levels is a potential AB=CD correction (green arrows) at 1.1476 and 1.618 BC projection at 1.1442.
H4 perspective:
For those who read Friday’s technical briefing you may recall the following (italics):
Retesting the 1.17ish region as resistance today may spark a bearish theme, targeting at least H4 Quasimodo support from 1.1626.
Persistent risk aversion benefitting the USD witnessed EUR/USD pivot lower from the 1.17 handle on Friday in strong fashion, with enough firepower to shift interest to Quasimodo support at 1.1626, followed closely by the 1.16 handle.
Aligning closely with the H4 Quasimodo is weekly support at 1.1621. In addition, daily support takes up position under 1.16 at 1.1594, accompanied by a 50.0% retracement ratio at 1.1582.
Areas of consideration:
- Ultimately, the pair appears headed into reasonably firm support, underlining a possible recovery play this week.
- H4 Quasimodo support at 1.1626 and weekly support at 1.1621 provide tight support to work with this week, a location 1.17 shorts may look to liquidate partial profits.
- Between the daily 50.0% retracement ratio at 1.1582 (and daily support at 1.1594) and the 1.16 handle on the H4 also gifts traders a reasonably tight area of support this week, in the event we cross lower.
GBP/USD:
Weekly gain/loss: -0.72%
Weekly close: 1.2945
Weekly perspective:
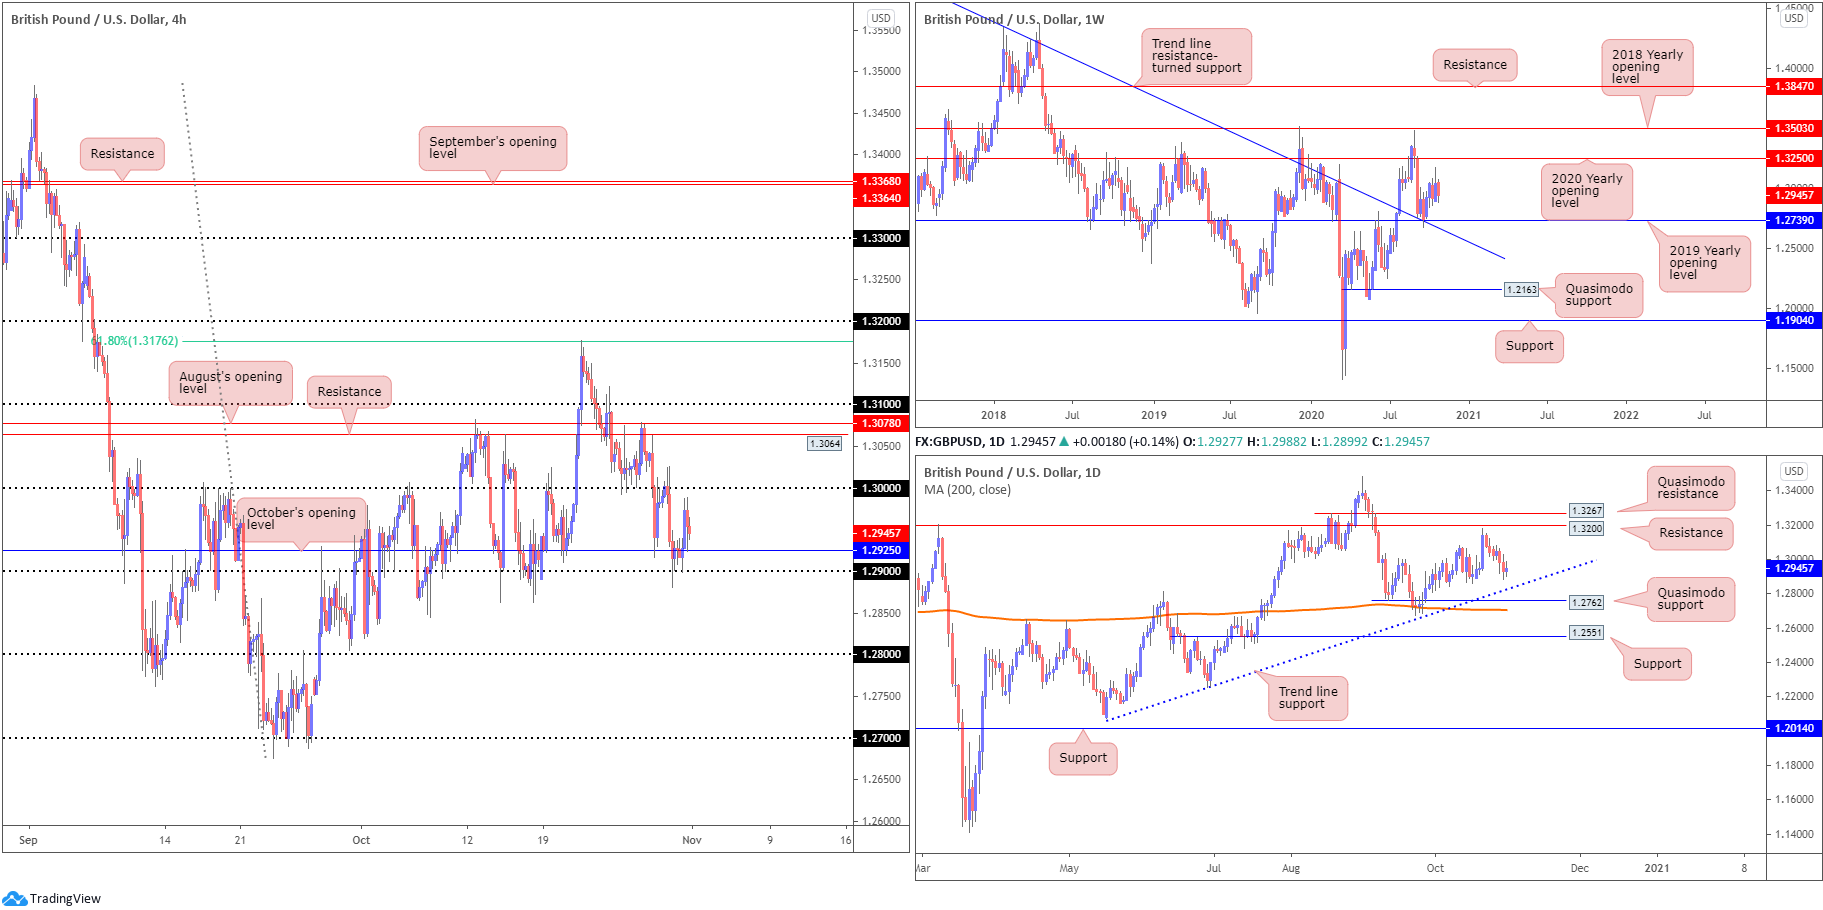
The situation on the weekly chart portrays an image of consolidation right now – perhaps even indecision.
Since the month of October, price has fluctuated between gains/losses around the 1.2960 neighbourhood.
The chart shows support at 1.2739, a 2019 yearly opening value that blends with trend line resistance-turned support, extended from the high 1.5930. Concerning resistance, the 2020 yearly opening value is seen at 1.3250.
Should 1.2739 fail, the 1.2251 low (June 29) is in sight, shadowed by Quasimodo support from 1.2163.
It is also worth pointing out the aforementioned trend line was engulfed in July of this year, announcing an uptrend could be on the cards.
Daily perspective:
After coming within touching distance of resistance at 1.3200, buyers clearly lost their flavour.
This, as you can see, triggered modest selling over the course of last week and shined the spotlight on trend line support, extended from the low 1.2075, followed by Quasimodo support at 1.2762. Also close by is the 200-day SMA (orange – 1.2705).
H4 perspective:
The British pound found itself slightly on the winning side of the table against the buck Friday, gleaning fresh impetus off the 1.29 handle and October’s opening value at 1.2925. Despite an earnest effort to sustain upside, the unit corrected south of the 1.30 level.
As aired in Friday’s technical briefing, although 1.29 holds as support, the higher timeframes suggest sellers still have some gas left in the tank (room is seen to move lower).
Areas of consideration:
- The 1.29 handle continues to echo instability. A break under the aforementioned number this week potentially sets the stage for a bearish play to 1.28 (limited [active] demand seen to the left of price). Conservative sellers, nonetheless, may opt to wait and see if a 1.29 retest (as resistance) forms before committing.
- Before sellers push beyond 1.29, assuming they do of course, a retest at 1.30 is still also on the table.
AUD/USD:
Weekly gain/loss: -1.49%
Weekly close: 0.7026
Weekly perspective:
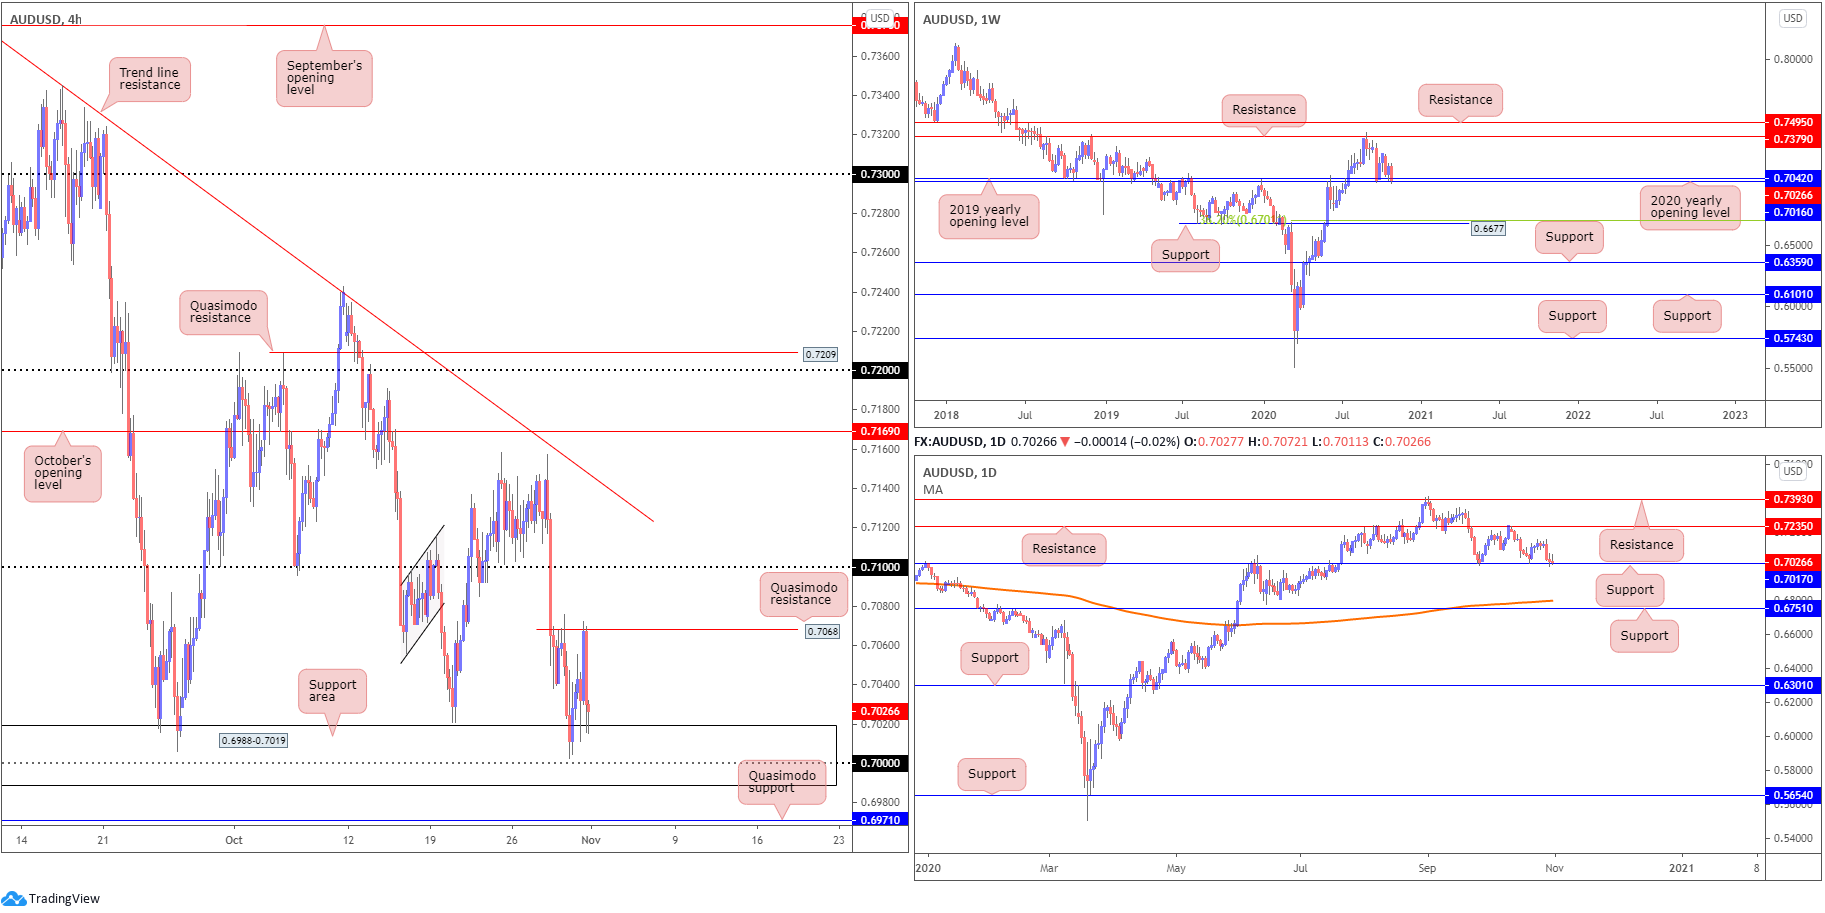
The 2020 (0.7016) and 2019 (0.7042) yearly opening values continue to be recognised as support on the weekly timeframe, both of which are currently under attack due to last week’s 100-pip slump. Resistance at 0.7379 lines up as the next upside hurdle should an advance materialise this week. It should also be pointed out that the trend in this market remains to the upside.
Failure to maintain position off 0.7016/0.7042 shifts motivation towards support plotted at 0.6677, and a corresponding 38.2% Fibonacci retracement ratio at 0.6701.
Daily perspective:
In partnership with weekly supports, support on the daily timeframe made an appearance at 0.7017 in the second half of last week. As of Friday’s close, though, buyers have expressed a lack of interest, drawing the light away from tops at 0.7157ish (and resistance at 0.7235) and shifting attention to levels south of 0.7017.
If a push through 0.7017 is seen this week, support appears to be somewhat light until the 200-day SMA (orange – 0.6799) and support at 0.6751.
H4 perspective:
Downbeat risk sentiment somewhat boosted demand for the safe-haven greenback Friday and consequently capped AUD/USD upside off Quasimodo resistance at 0.7068 (clearer level on the H1). As demonstrated on the chart, bearish pressure from 0.7068 guided candles back to the support area at 0.6988-0.7019, an area that encompasses the key figure 0.70 and takes up position just north of Quasimodo support at 0.6971.
Areas of consideration:
- The H4 support area at 0.6988-0.7019 is likely to be on the watchlists of many traders this week, on account of where we trade on the bigger picture: weekly and daily supports. The 0.70 handle may also be of particular interest.
- Another possible scenario to be conscious of is a push to H4 Quasimodo support at 0.6971, in order to form a bear trap. The liquidity (protective stop-loss orders) present beneath 0.70, if triggered, becomes sells and provide LQ to buy into. This is the theory anyway!
USD/JPY:
Weekly gain/loss: -0.04%
Weekly close: 104.64
Weekly perspective:
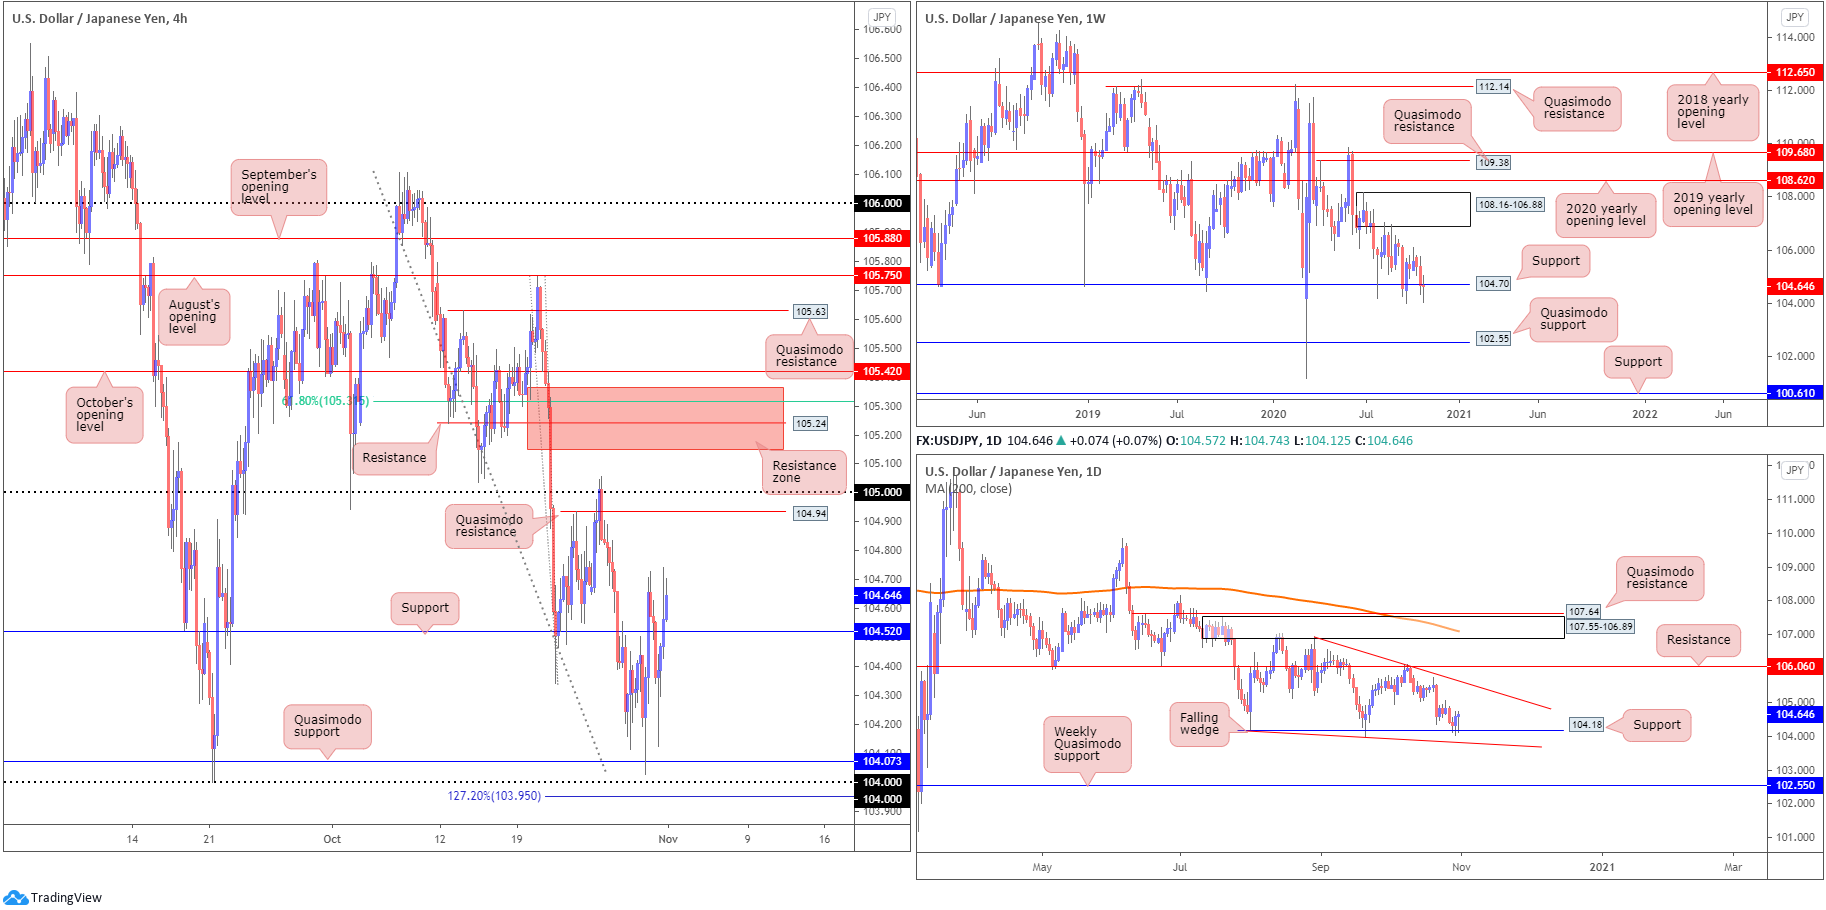
Although concluding the week unmoved, the pair managed to chalk up a range between 105.05/104.02.
Long-term support from 104.70 came under pressure last week, yet price is attempting to keep hold of the level, similar to July and September’s movement. However, the lack of buying pressure seen September onwards has been less than impressive, suggesting the support is fragile as we head into trading this week.
Quasimodo support at 102.55 offers a feasible target beyond current support, while a 104.70 rejection places supply back in the mix at 108.16-106.88.
Daily perspective:
Movement on the daily timeframe is visibly compressing between two converging descending lines taken from 104.18/106.94, establishing a falling wedge pattern. Due to the series of lower lows and lower highs since March, the current falling wedge is likely to be interpreted as a reversal signal should a breakout higher take shape.
What’s also interesting from a technical perspective is not only is weekly flow holding at support, the pair is also rebounding from daily support coming in at 104.18.
H4 perspective:
The modest risk recovery seen during US hours on Friday undermined demand for the safe-haven Japanese yen, consequently lifting USD/JPY north of support at 104.52.
This has shifted the technical radar towards Quasimodo resistance at 104.94 and the round number 105. Although a bearish response from the aforementioned levels is likely to be expected this week, the resistance area above between 105.36-105.14 represents the more attractive base, holding a number of key levels within and benefiting from any buy-stop liquidity above the 105 handle.
Areas of consideration:
- A correction/retest at H4 support drawn from 104.52, given the charts recognise higher timeframe supports, could encourage a bullish scenario to target the 105 region this week.
- Bearish themes are also a possibility off the 105 handle this week, though the H4 resistance area above the round number is likely more inviting for bearish eyes.
USD/CAD:
Weekly gain/loss: +1.48%
Weekly close: 1.3315
Weekly perspective:
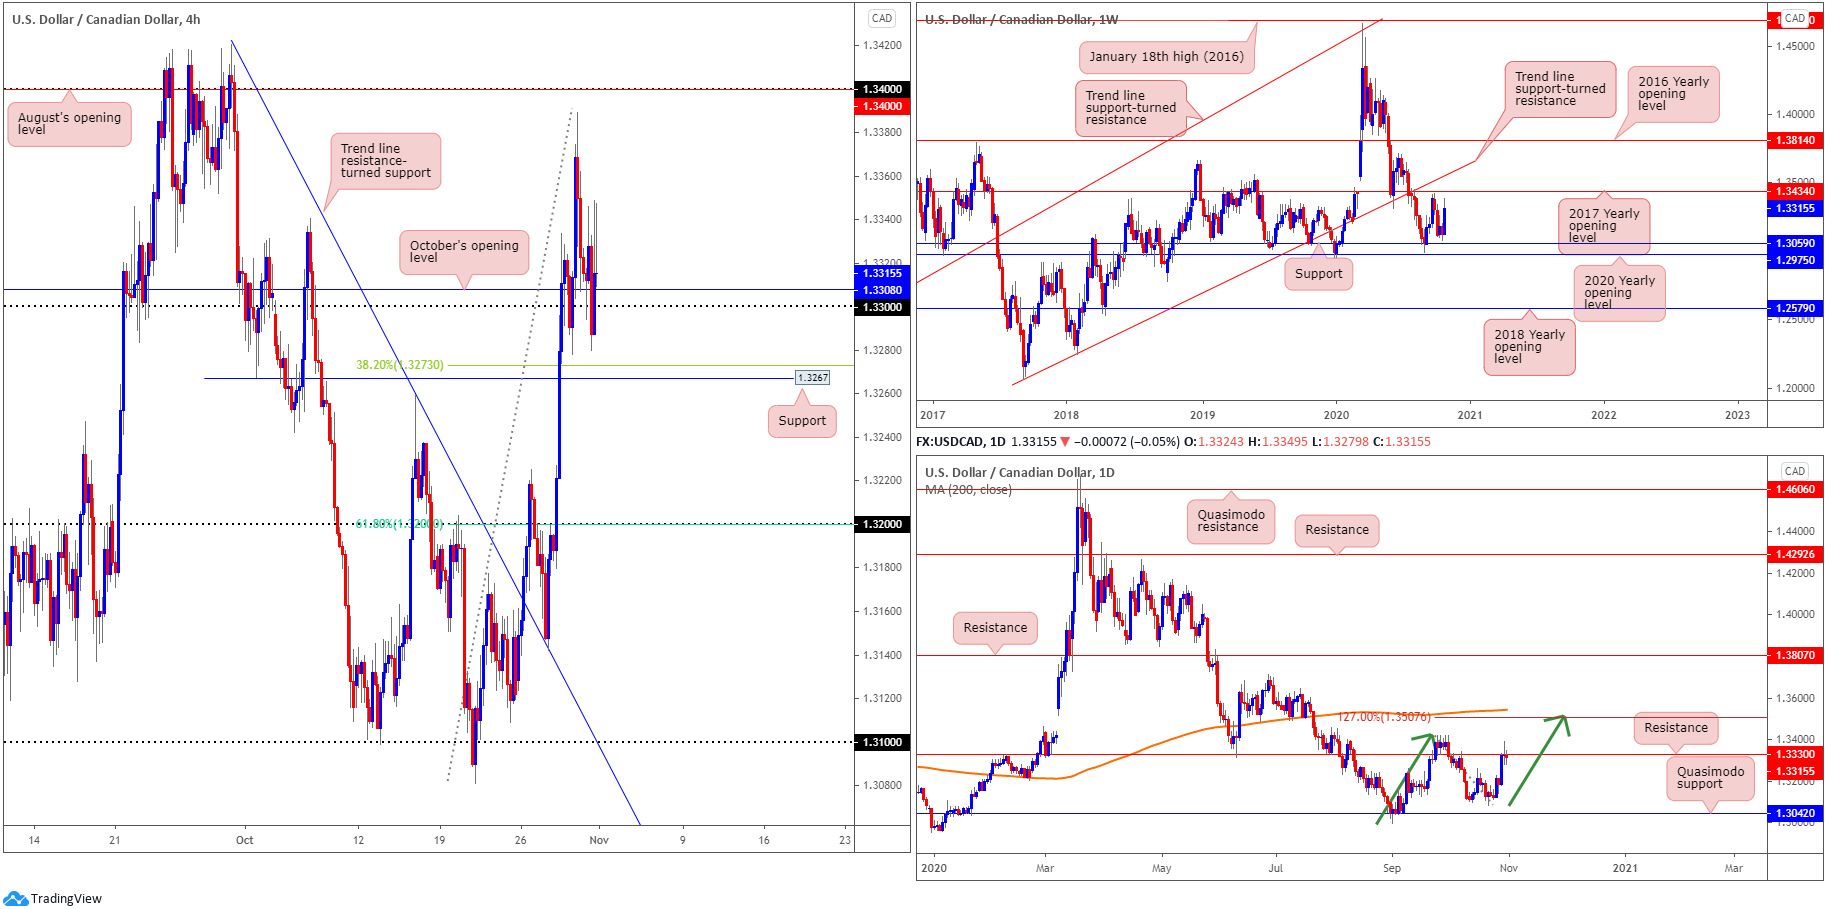
Higher timeframe action, based on the weekly timeframe, exhibits scope to approach the 2017 yearly opening value at 1.3434, after a week of solid gains north of support at 1.3059 (positioned just above the 2020 yearly opening value at 1.2975).
A continuation move above 1.3434 this week places trend line support-turned resistance, taken from the low 1.2061, in the firing range.
Daily perspective:
From the daily timeframe, however, buyers and sellers are battling for position around resistance at 1.3330. Breaching this level, although there are some tops to contend with around the 1.3420ish neighbourhood, could see buyers hone in on the 200-day SMA (orange – 1.3543), which happens to merge closely with an ABCD bearish pattern and 1.27 BC projection at 1.3507.
A rejection off 1.3330, however, pins focus on bottoms around the 1.3100 area.
H4 perspective:
Friday, as you can see, exhibited choppy price action, initiating whipsaws under both October’s opening value at 1.3308 and the 1.33 handle.
With buyers theoretically weakened around 1.33, this week could have support at 1.3267 make an appearance, established a few pips below a 38.2% Fibonacci retracement ratio at 1.3273. Beyond here, apart from 1.3259, support appears absent until the 1.32 handle and 61.8% Fibonacci retracement ratio.
Should buyers find their feet above 1.33, on the other hand, the 1.34 level jumps out as a feasible upside target, converging with August’s opening value.
Areas of consideration:
- Room for weekly price to rally and test the 2017 yearly opening value at 1.3434 could see H4 candles continue to grip the 1.33 handle this week and take a shot at the 1.34 base. Buyers off 1.33, in light of Friday’s mess, are likely to seek H4 candlestick confirmation before pulling the trigger.
- H4 support is a tidy area at 1.3267, arranged nearby a 38.2% Fibonacci retracement ratio at 1.3273.
- Longer-term, traders could be looking at the space above daily resistance from 1.3330 in favour of a rally to complete the ABCD bearish pattern around the 200-day SMA at 1.3500/50ish.
USD/CHF:
Weekly gain/loss: +1.43%
Weekly close: 0.9165
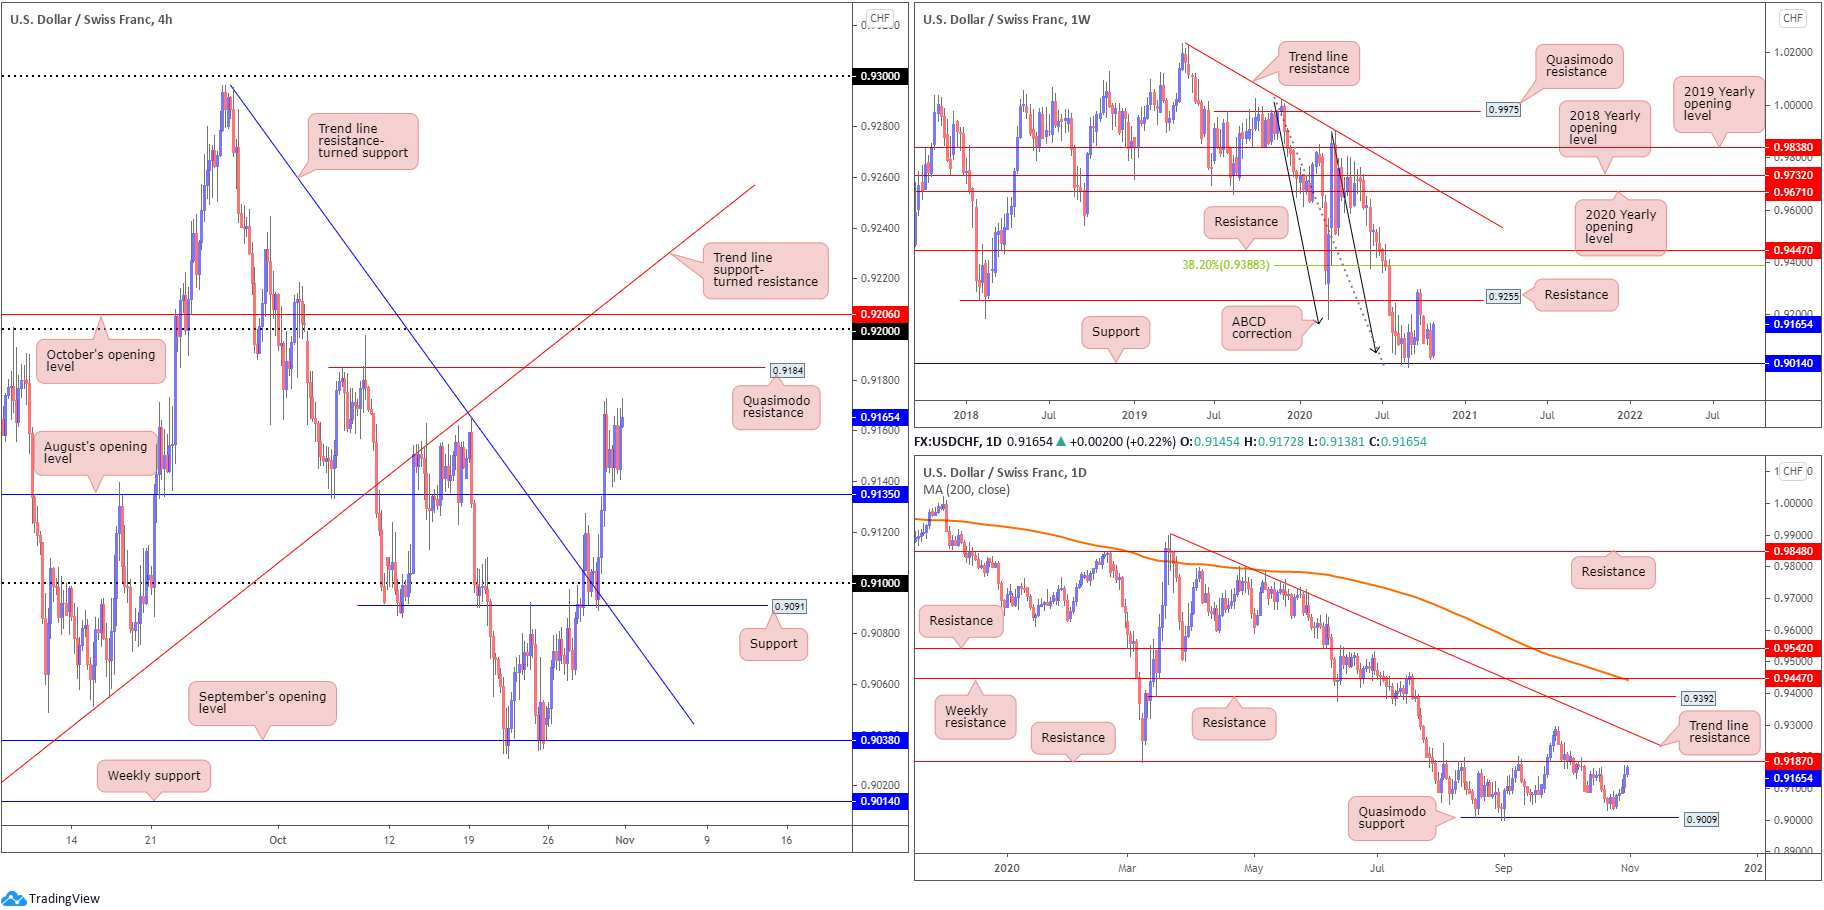
Weekly perspective:
The week witnessed weekly price reclaim previous losses ahead of support at 0.9014.
For those who read previous analysis on this pair, you will also note current support is bolstered by ABCD support at 0.9051 (black arrows).
An extension to the upside going forward throws resistance at 0.9255 back into the spotlight, a previous Quasimodo support level.
Daily perspective:
The story on the daily timeframe reveals price spent the week closing in on resistance at 0.9187, after bottoming a touch above Quasimodo support at 0.9009. A decisive break higher this week exposes trend line resistance, extended from the high 0.9901.
H4 perspective:
Following Thursday’s short-lived retest at 0.91 (assisted by H4 support at 0.9091 and trend line resistance-turned support [0.9295]), USD/CHF entered into a phase of consolidation Friday, balanced just above August’s opening value at 0.9135.
Also registering a fifth consecutive daily gain Friday, H4 has eyes on Quasimodo resistance at 0.9184, closely followed by the 0.92 handle and October’s opening value at 0.9206.
Areas of consideration:
- Retesting August’s opening value at 0.9135 on the H4 could be a scenario we see play out, movement that possibly interests buyers, with room to advance to H4 Quasimodo resistance at 0.9184. We can also see there’s still space for USD/CHF to rally on the higher timeframes, too.
- Should a rally come to pass this week, bearish themes off H4 Quasimodo resistance at 0.9184 could take form, converging with daily resistance at 0.9187.
Dow Jones Industrial Average:
Weekly gain/loss: -6.01%
Weekly close: 26614
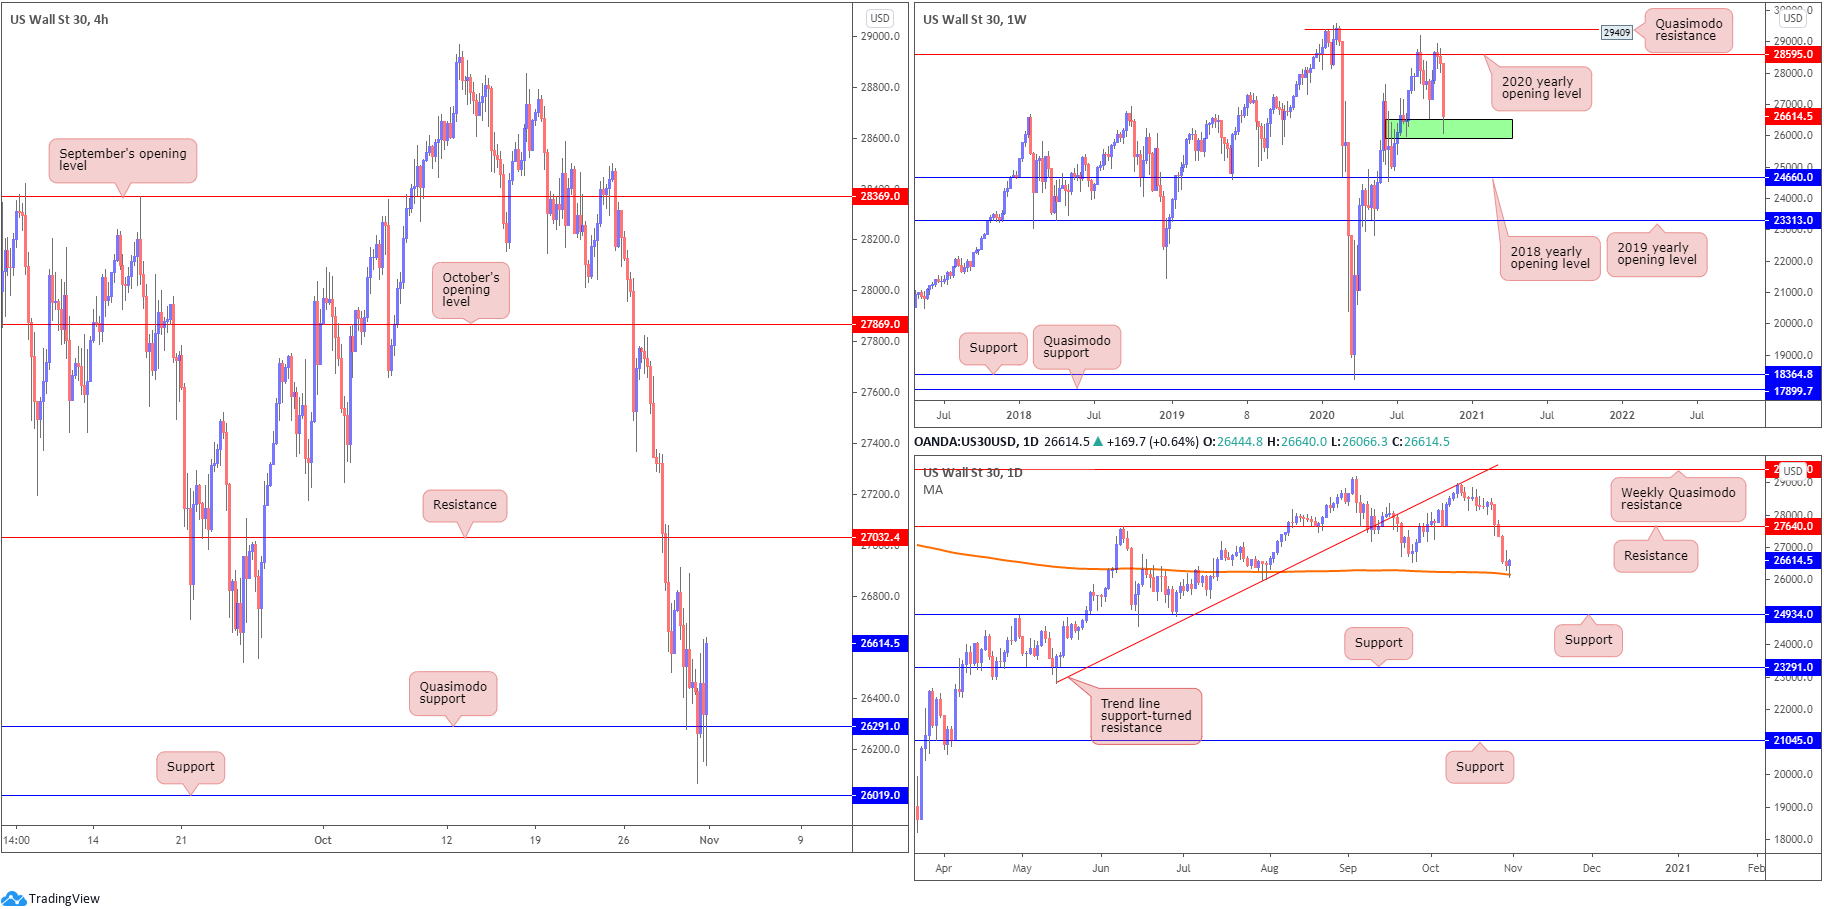
Weekly perspective:
Wrapping up its worst month since March, price concluded lower by a whopping 1,700 points in the final full week before the US election.
Technical price action is seen occupying the upper base of demand at (green) 25916-26523, which if a break eventually comes to pass could direct price flow towards the 2018 yearly opening value at 24660. Should buyers regain consciousness this week, the 2020 yearly opening value at 28595 is seen.
Daily perspective:
Alongside the weekly demand area, daily price crossed swords with the 200-day SMA (orange – 26163) on Friday and established a hammer candlestick pattern. Technically, this may feed a bullish vibe this week. Support at 24934, however, is next on tap should sellers jump back in the driving seat.
H4 perspective:
At the close of trade Friday (New York), US equity benchmarks finished lower across the board.
The Dow Jones Industrial Average shed 157.51 points, or 0.59%, the S&P 500 declined 40.15 points, or 1.21% and the Nasdaq traded lower by 274.00 points, or 2.45%.
Quasimodo support at 26291 recently became active, a level that withstood a number of violent downside attempts on Friday (just missing support priced in at 26019 but enough to obviously draw in the 200-day SMA on the daily timeframe). As evident from the chart, a H4 outside reversal formation also formed into the close, prompting a bullish course towards resistance at 27032.
Areas of consideration:
- H4 Quasimodo support at 26291 could be enough to entice a recovery this week, knowing the area shares space with weekly demand at 25916-26523, as well as Friday’s H4 bullish candlestick print and daily price shaking hands with the 200-day SMA in the form of a hammer candle pattern.
XAU/USD (GOLD):
Weekly gain/loss: -1.21%
Weekly close: $1,878
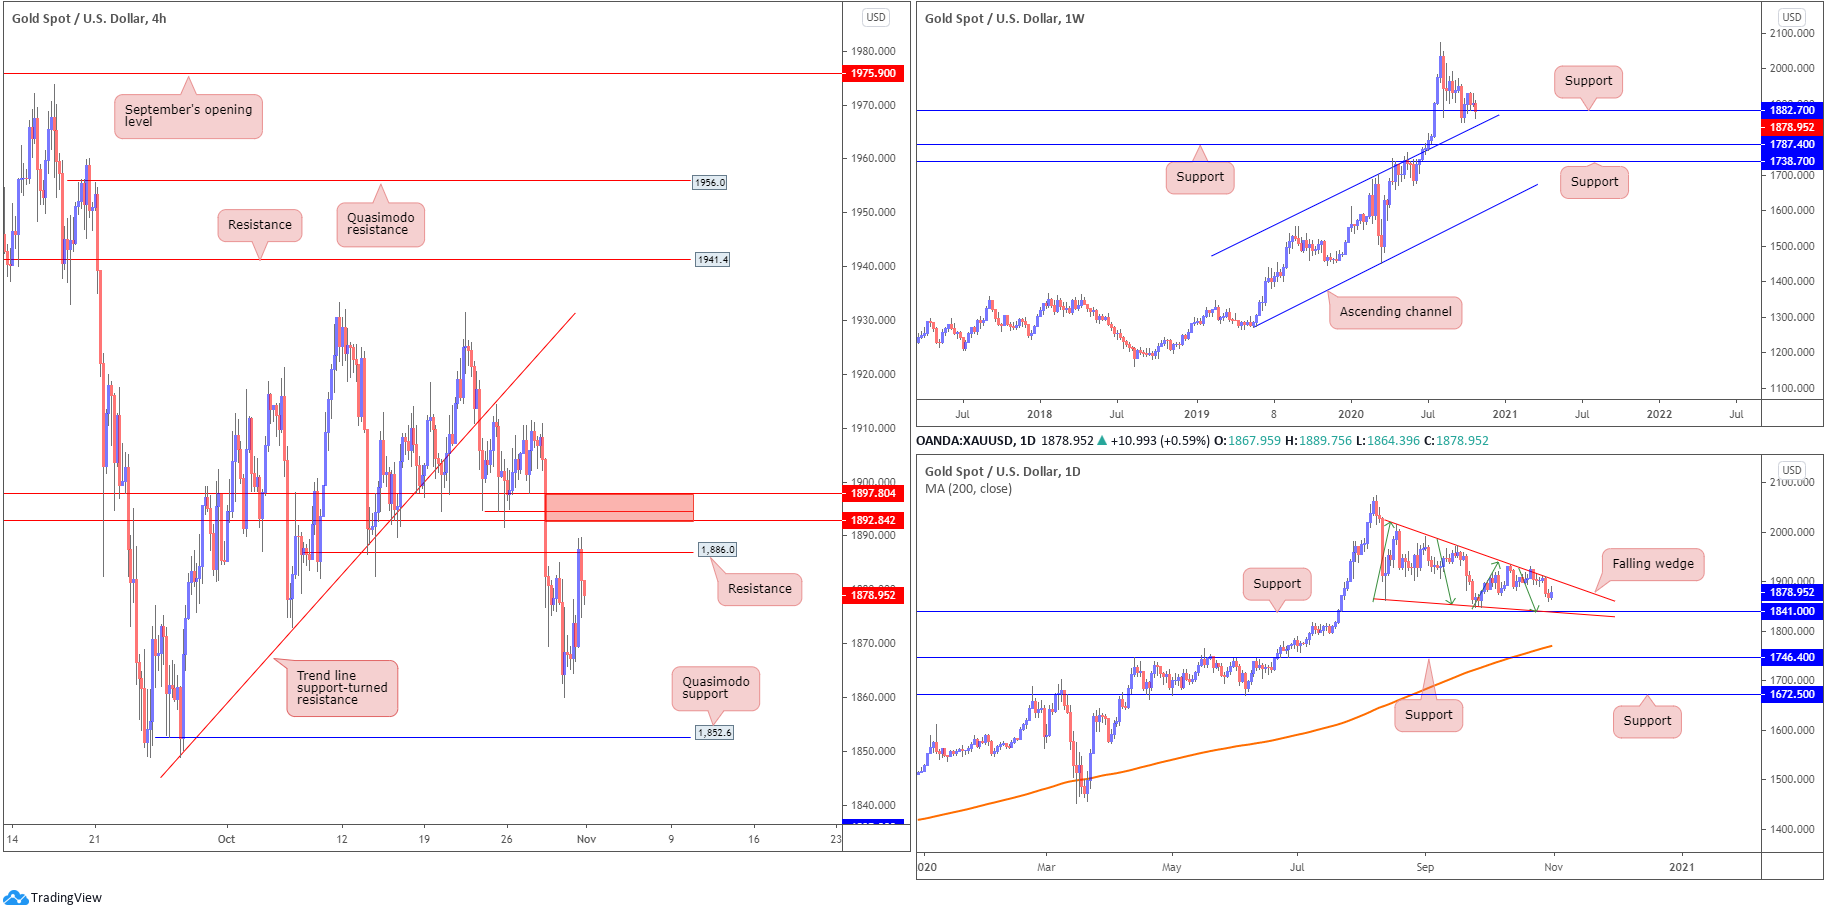
Weekly perspective:
The precious metal whipsawed through support at $1,882 in recent trading and spiked to lows at $1,860. This, as you can see, just missed channel resistance-turned support, taken from the high $1,703.
Traders are urged to pencil in supports at $1,787 and $1,738 in the event buyers fail to make an appearance. Though should a wave of buying emerge, long-term traders’ crosshairs are likely focussed on the all-time peak $2,075.
Daily perspective:
The daily timeframe appears to be in the process of creating a falling wedge pattern between $2,015 and $1,862 (the lower boundary also lines up closely with support at $1,841), which may be interpreted as a continuation signal in the event of a breakout north.
The noted support level is a level to keep an eye on this week, due to not only weekly structure displaying support, but also because the yellow metal has been DECISIVELY gravitating higher since 2016 (although price has been trending higher much longer than this overall).
H4 perspective:
Friday took to higher levels, extending Thursday’s recovery off lows at $1,860 (ahead of Quasimodo support at $1,852). Resistance at $1,886 put on a show as we moved into US hours, a level located just south of another area of resistance between $1,897-$1,892.
Areas of consideration:
- Weekly support at $1,882 is under pressure. This, in addition to room seen for daily price to approach support at $1,841, might be enough to encourage traders to pursue bearish setups this week off either H4 resistance at $1,886 or resistance between $1,897-$1,892.
- Long term, nonetheless, an eventual breakout above the daily falling wedge could spark bullish moves off weekly supports ($1,882 or channel support).
The accuracy, completeness and timeliness of the information contained on this site cannot be guaranteed. IC Markets does not warranty, guarantee or make any representations, or assume any liability regarding financial results based on the use of the information in the site.
News, views, opinions, recommendations and other information obtained from sources outside of www.icmarkets.com.au, used in this site are believed to be reliable, but we cannot guarantee their accuracy or completeness. All such information is subject to change at any time without notice. IC Markets assumes no responsibility for the content of any linked site.
The fact that such links may exist does not indicate approval or endorsement of any material contained on any linked site. IC Markets is not liable for any harm caused by the transmission, through accessing the services or information on this site, of a computer virus, or other computer code or programming device that might be used to access, delete, damage, disable, disrupt or otherwise impede in any manner, the operation of the site or of any user’s software, hardware, data or property


