
Key risk events today:
BoE Gov Bailey Speaks; US Pending Home Sales m/m.
(Previous analysis as well as outside sources – italics).
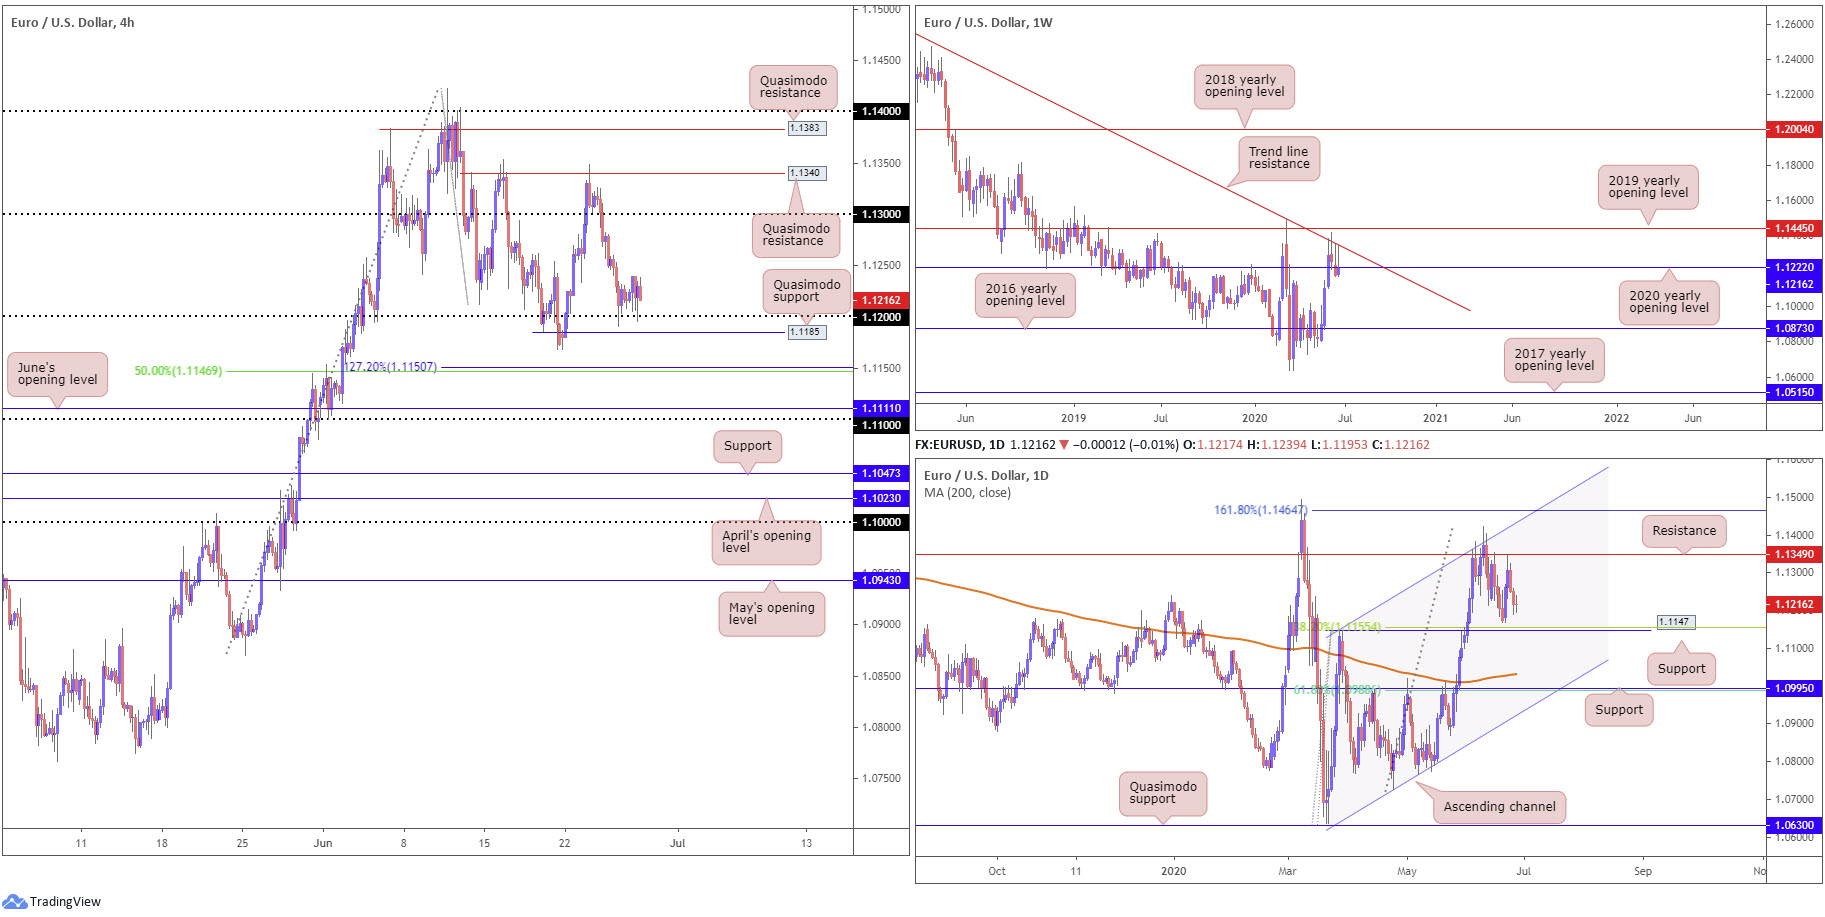
EUR/USD:
Weekly gain/loss: +0.38%
Weekly close: 1.1216
Weekly perspective:
In the shape of back-to-back shooting star candlestick patterns, price movement is seen fading long-standing trend line resistance, taken from the high 1.2555. Consequently, the 2020 yearly opening level at 1.1222 is under fire.
Any sustained move under the aforementioned barrier this week seats the 2016 yearly opening level at 1.0873 on the hit list, while a EUR/USD bid shines light on the possibility of reaching the 2019 yearly opening level at 1.1445.
Daily perspective:
Since the beginning of June, price has been languishing south of resistance at 1.1349.
Support derived from the 1.1147 27 March high, therefore, could soon become a reality, a level that merges closely with a 38.2% Fibonacci retracement ratio at 1.1155. Interestingly, breaching 1.1147 reveals the 200-day SMA (orange – 1.1031), closely followed by support at 1.0995 and a 61.8% Fibonacci retracement ratio at 1.0988.
H4 perspective:
Europe’s shared currency settled Friday little moved, with downside attempts contained at 1.12. Quasimodo support at 1.1185 remains in the crosshairs south of the round number, as does the 127.2% Fibonacci extension point at 1.1150 and 50.00% retracement ratio at 1.1146. Overhead, however, chart studies indicate an absence of obvious resistance until shaking hands with the 1.13 handle, closely shadowed by Quasimodo resistance at 1.1340.
On the data front, the US PCE price index increased 0.1%. Excluding food and energy, the PCE price index also increased 0.1%. The University of Michigan’s Survey of Consumers also revealed the Index of Consumer Sentiment ticked higher to 78.1 in June from 72.3 in May.
Areas of consideration:
In light of recent support derived from 1.12 on the H4, buyers have likely tucked protective stop-loss orders under the round number.
This unlocks the door to a possible fakeout scenario this week, involving a dip through 1.12 into H4 Quasimodo support at 1.1185. Not only would this move trip sell-stop liquidity below 1.12, it would drag in any willing buyers off the Quasimodo formation. A H4 close back above 1.12 off 1.1185, therefore, would likely be a welcomed sight for buyers, targeting 1.13.
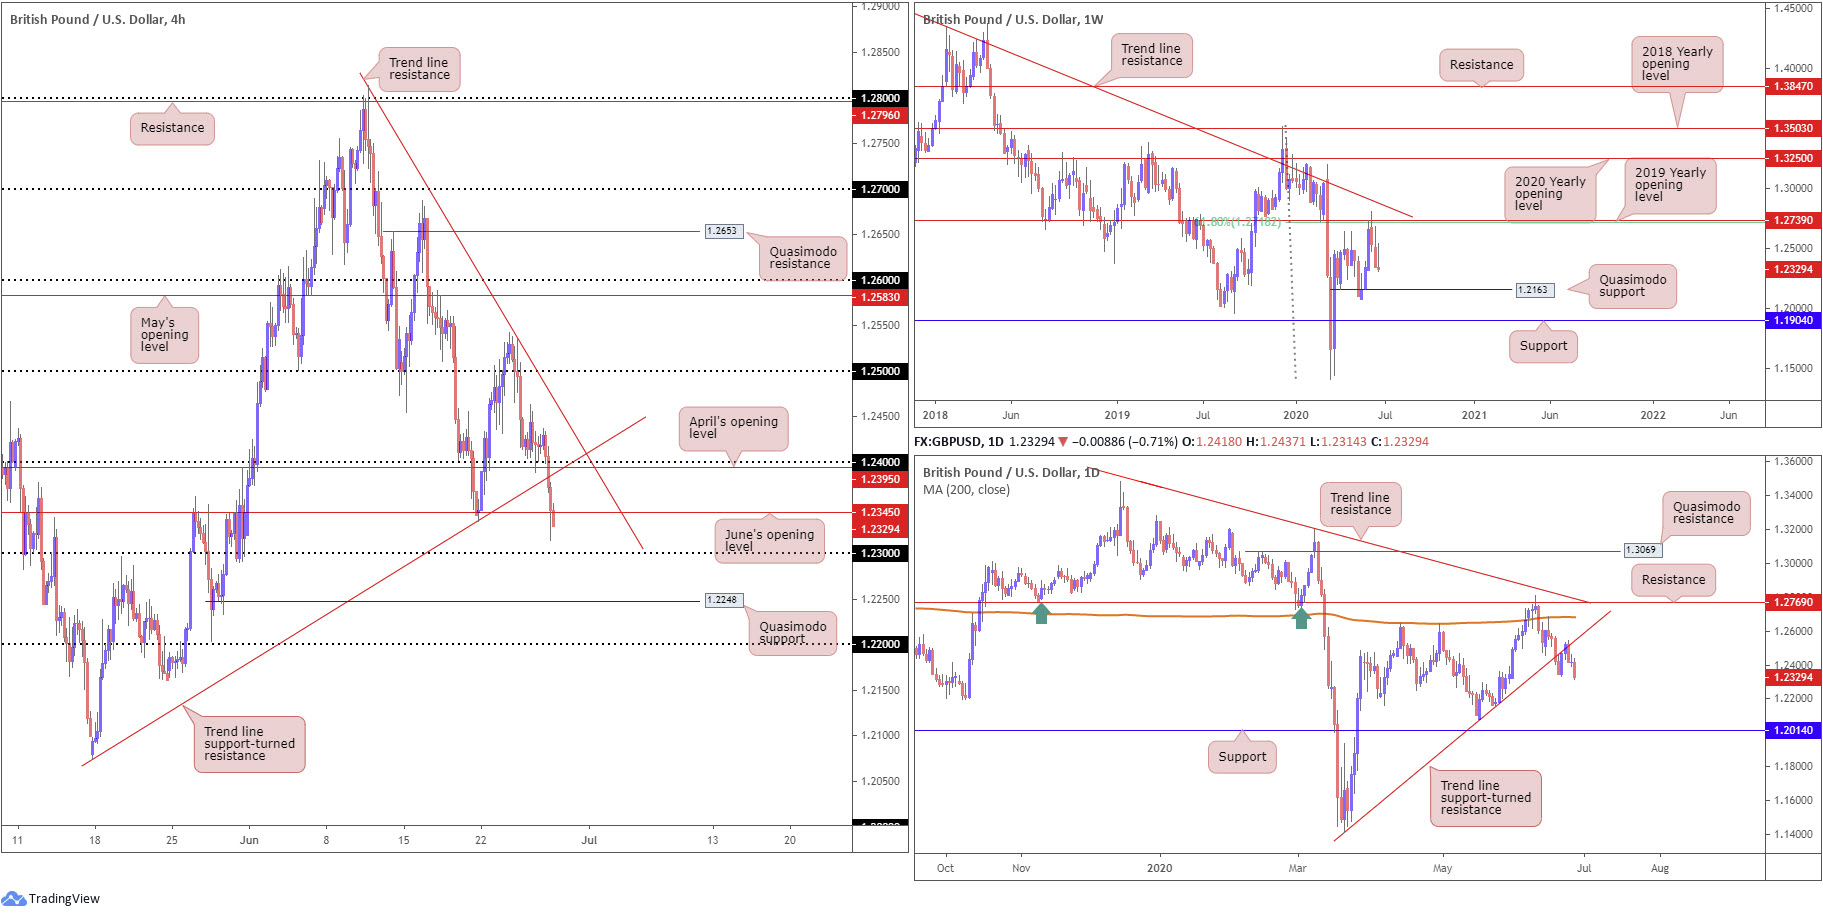
GBP/USD:
Weekly gain/loss: -0.10%
Weekly close: 1.2329
Weekly perspective:
Following two consecutive losing weeks south of a 61.8% Fibonacci retracement ratio at 1.2718 and 2019 yearly opening level at 1.2739, GBP/USD finished unchanged last week, though considerably off best levels.
Navigating deeper waters from here this week invites an approach to Quasimodo support at 1.2163.
Daily perspective:
The daily timeframe, meanwhile, has price action stationed beneath trend line support-turned resistance, taken from the low 1.1409, following a mid-week retest. The route lower appears one-way towards support coming in at 1.2014, sited just south of the 1.2075 May 18 low. Before reaching this far south, though, weekly Quasimodo support must be absorbed at 1.2163.
H4 perspective:
Friday witnessed the US dollar index extend gains to highs at 97.68 as US equities tumbled. GBP/USD explored territory sub 1.24 and April’s opening level at 1.2395 heading into US hours, leading to a break of trend line support, extended from the low 1.2075.
In the hours leading up to the close, a break of June’s opening level at 1.2345 also materialised, perhaps clearing the rubble for 1.23 to make an entrance this week.
Areas of consideration:
With the weekly timeframe pointing to the likelihood of further selling over the coming week, targeting 1.2163, bearish scenarios south of June’s opening level at 1.2345 on the H4 and on a break of 1.23 may be of interest. Conservative traders will likely seek a retest at the underside of the aforesaid levels before committing.
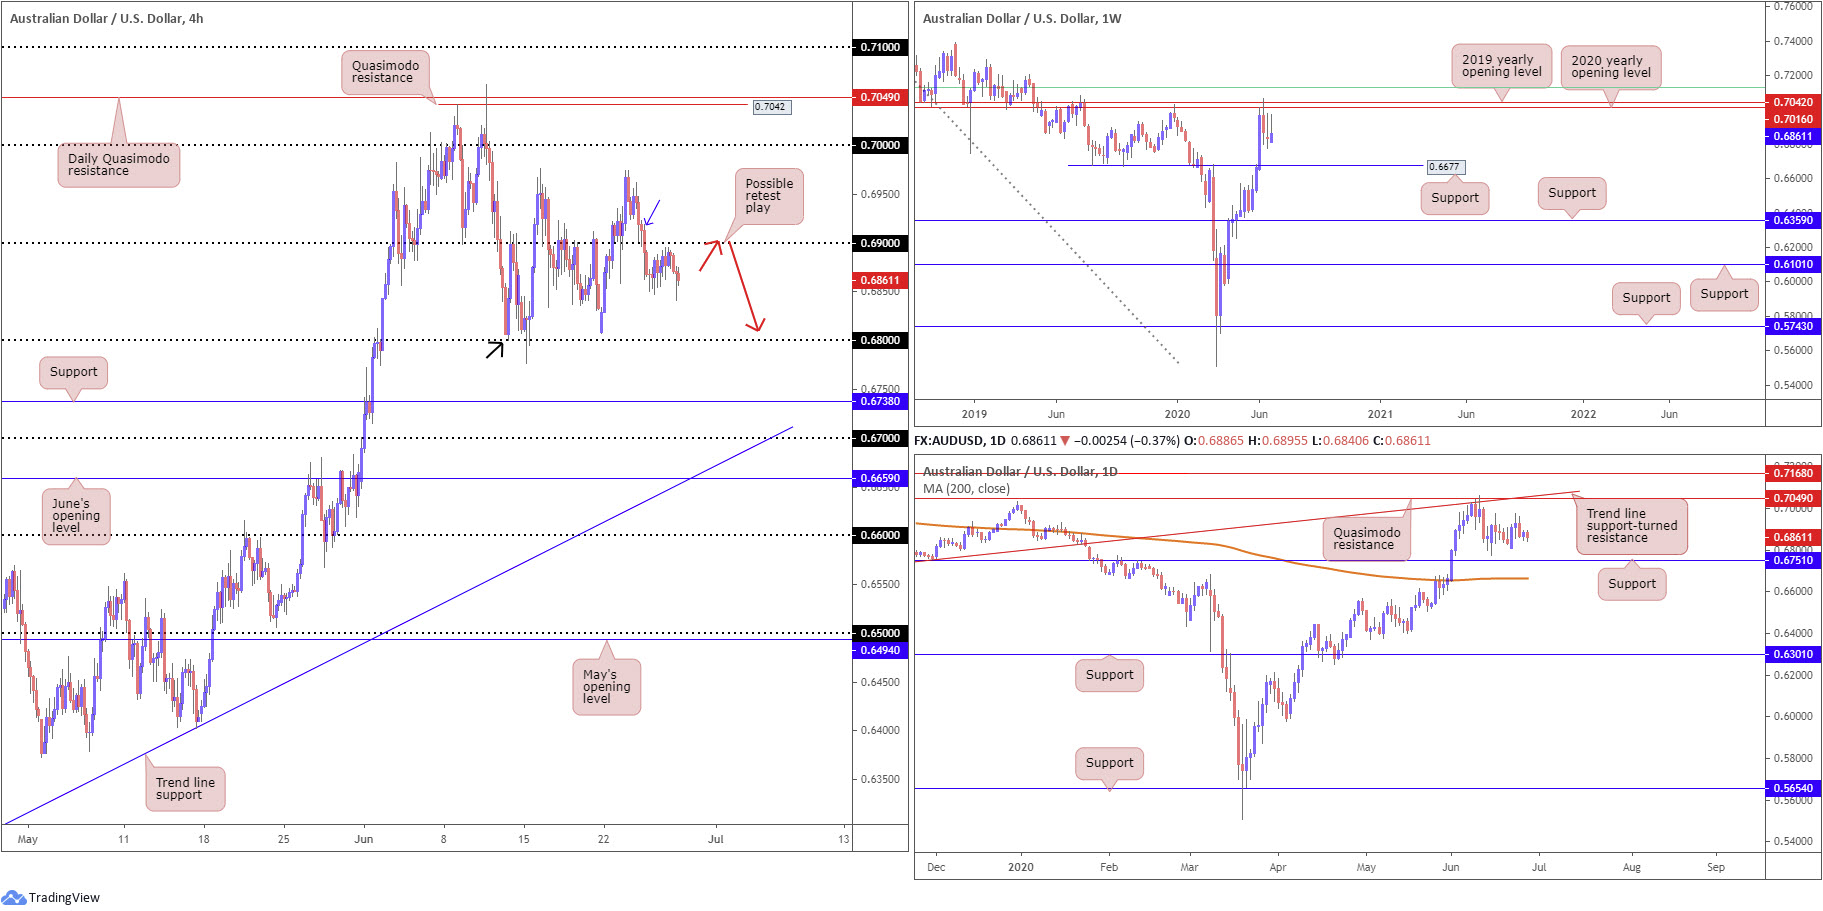
AUD/USD:
Weekly gain/loss: +0.41%
Weekly close: 0.6861
Weekly perspective:
Resistance, forged in the shape of a 2020 yearly opening level and a 2019 yearly opening level, at 0.7016 and 0.7042, respectively, continues to offer a dominant presence.
It might also interest traders to note that just above the said resistances we have a 61.8% Fibonacci retracement ratio at 0.7128 (green). In terms of support, crosshairs are perhaps fixed on 0.6677.
Daily perspective:
From the daily timeframe, Quasimodo resistance at 0.7049 is in sight, merging closely with trend line support-turned resistance, taken from the low 0.6670. Attention on this timeframe also remains at support coming in from 0.6751. Interestingly, lurking beneath here we also have the 200-day SMA (orange – 0.6664), located close by weekly support mentioned above at 0.6677.
H4 perspective:
The Australian dollar finished a shade lower against the buck Friday, pressured amid a DXY bid to highs at 97.68. Structurally, we remain flagging sub 0.69, with downside currently contained around 0.6850ish.
Sidestepping 0.6850, the highway south seems clear until the 0.68 juncture. Technically speaking, this figure also throws across a Quasimodo support (black arrow denotes the left shoulder).
Areas of consideration:
According to technical research, in particular the breach of 0.69 to the downside, sellers may have the upper hand heading into the new week.
A retest at the underside of 0.69 (red arrows), one that preferably holds by way of a H1/H4 bearish candlestick pattern, would likely appeal to sellers this week, targeting the 0.68 neighbourhood as an initial take-profit zone. Aggressive traders, on the other hand, will already likely be short the break of 0.69, with protective stop-loss orders possibly tucked above 0.6922 (blue arrow), the top edge of a local supply resting above 0.69.
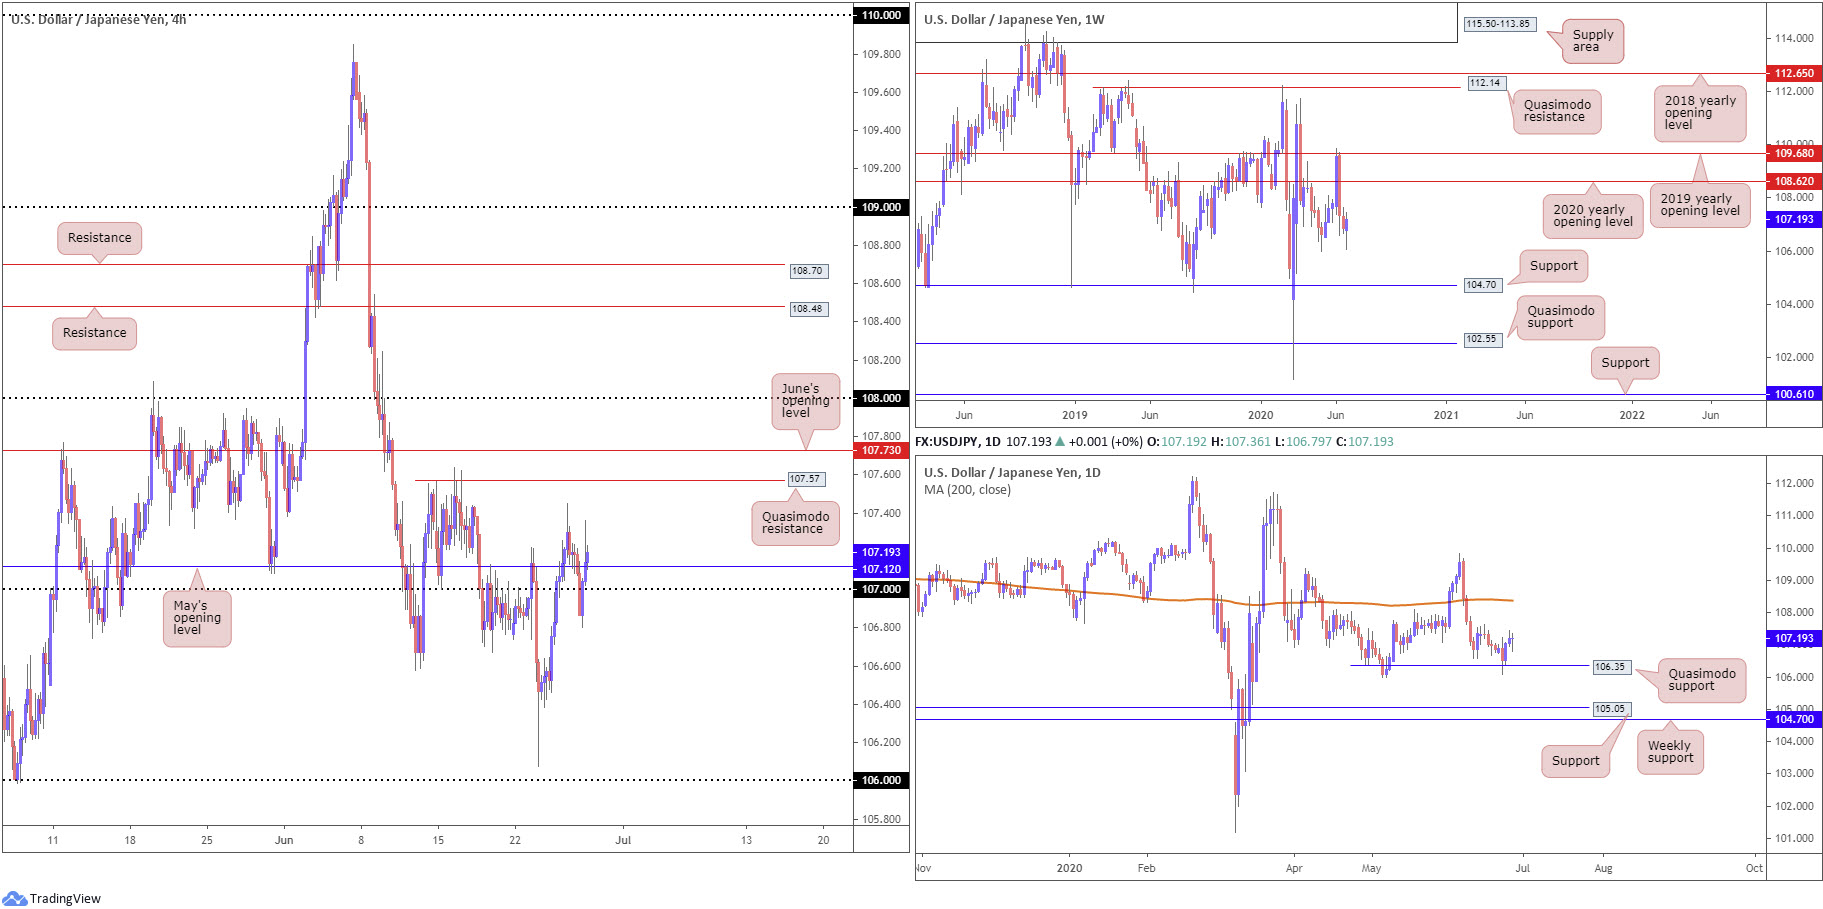
USD/JPY:
Weekly gain/loss: +0.33%
Weekly close: 107.19
Weekly perspective:
After rejecting the 2019 yearly opening level at 109.68 and voyaging through the 2020 yearly opening level at 108.62, current action found grip just ahead of the 105.98 6th May low.
While the recent recovery, a move that snapped a two-week bearish phase, could promote additional bullish sentiment this week, another school of thought could have price swing lower, taking aim at support drawn from 104.70.
Daily perspective:
Quasimodo support at 106.35 nudged its way into the limelight mid-week and delivered a healthy bullish candle. Upside momentum somewhat waned in the second half of the week, nonetheless, unable to determine direction.
Despite the lack of enthusiasm, the possibility of further buying remains, with crosshairs fixed on the 200-day SMA (orange – 108.37) as an upside objective this week. Failure to extend gains may see 106.35 breached and support at 105.05 call for attention.
H4 perspective:
Friday had buyers strengthen their grip going into US hours, regaining a footing above 107 as well as May’s opening level at 107.12 and reclaiming earlier losses, despite US equity benchmarks plunging into negative territory.
Technically, the move back above 107 may persuade buyers to attempt an approach towards Quasimodo resistance at 107.57, located just south of June’s opening level at 107.73. Above here, 108 calls for attention, with a violation shifting focus to the 200-day SMA highlighted on the daily timeframe (108.37).
Areas of consideration:
Similar to Friday’s outlook, a retest at 107.12/107 may come to fruition on the H4, setting up a case for a run to Quasimodo resistance at 107.57 and June’s opening level at 107.73. Conservative traders may seek additional confirmation before engaging with the area, owing to the threat of a fakeout occurring through 107 – common around psychological numbers.
Should we trek back under 107 this week, however, this could imply a lack of interest off Quasimodo support at 106.35 on the daily timeframe and throw the 106 handle into the pot as a possible support target. Bearish themes beneath 107, therefore, could also be on the table.
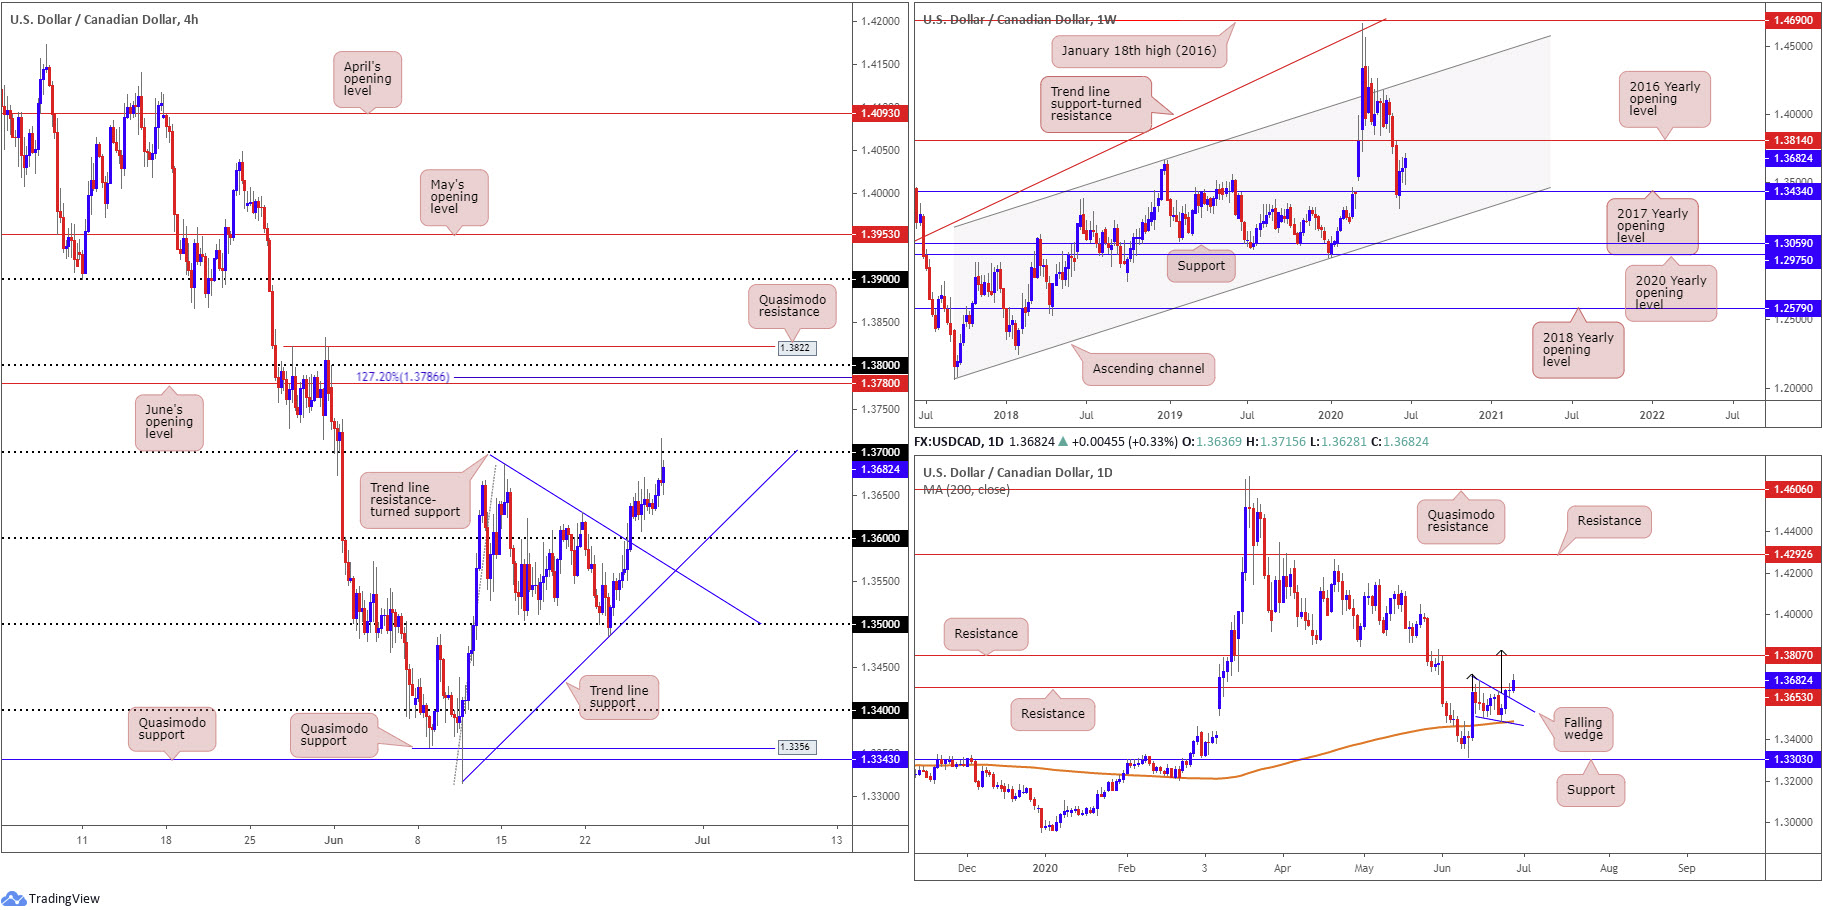
USD/CAD:
Weekly gain/loss: +0.58%
Weekly close: 1.3682
Weekly perspective:
The week put forward additional gains, adding more than 70 pips. This follows the beginning of June deriving impetus from the 2017 yearly opening level at 1.3434.
In the event recent action sponsors further buying this week, a potential hurdle to be aware of falls in by way of the 2016 yearly opening level at 1.3814, with follow-through buying likely to try and tackle a dense block of supply between 1.4190/1.3912.
Daily perspective:
After finishing Wednesday marginally outside the upper limit of a falling wedge pattern (1.3686/1.3504), neighbouring resistance at 1.3653 welcomed price action Thursday in the shape of an indecision candle.
Friday, as you can see, overthrew the aforementioned resistance, scoring highs at 1.3715 and potentially setting the stage for a continuation move to 1.3807.
Take-profit targets out of falling wedges can be measured by taking the base value and adding this figure to the breakout point (black arrows), which as you can see in this case, converges closely with the next daily resistance at 1.3807.
H4 perspective:
Friday witnessed USD/CAD gain traction, fuelled on the back of a DXY bid and waning oil prices.
1.37 made an appearance into the later stages of the session.
In the event we engulf 1.37, the river north should be ripple free towards an interesting area of resistance made up of June’s opening level at 1.3780, a 127.2% Fibonacci extension point at 1.3786, the 1.38 handle and Quasimodo resistance at 1.3822.
Traders will also note the 1.3822/1.3780 region merges with daily resistance at 1.3807 and weekly resistance at 1.3814 (2016 yearly opening level).
Areas of consideration:
Both weekly and daily timeframes exhibit scope to explore higher levels this week, and therefore point to a break of 1.37 to the upside.
A H4 close above 1.37, in light of the higher timeframe’s position, may have breakout buyers jump on board. Conservative traders may at least want to see a retest at the round number occur before engaging. Irrespective of the entry technique, the upside target falls in at the H4 resistance area from 1.3822/1.3780.
In view of the confluence around 1.3822/1.3780, both on the H4 and higher timeframes, not only does this make for a logical target for longs north of 1.37 this week, it also puts forward a tidy resistance zone to work with for possible shorting opportunities.
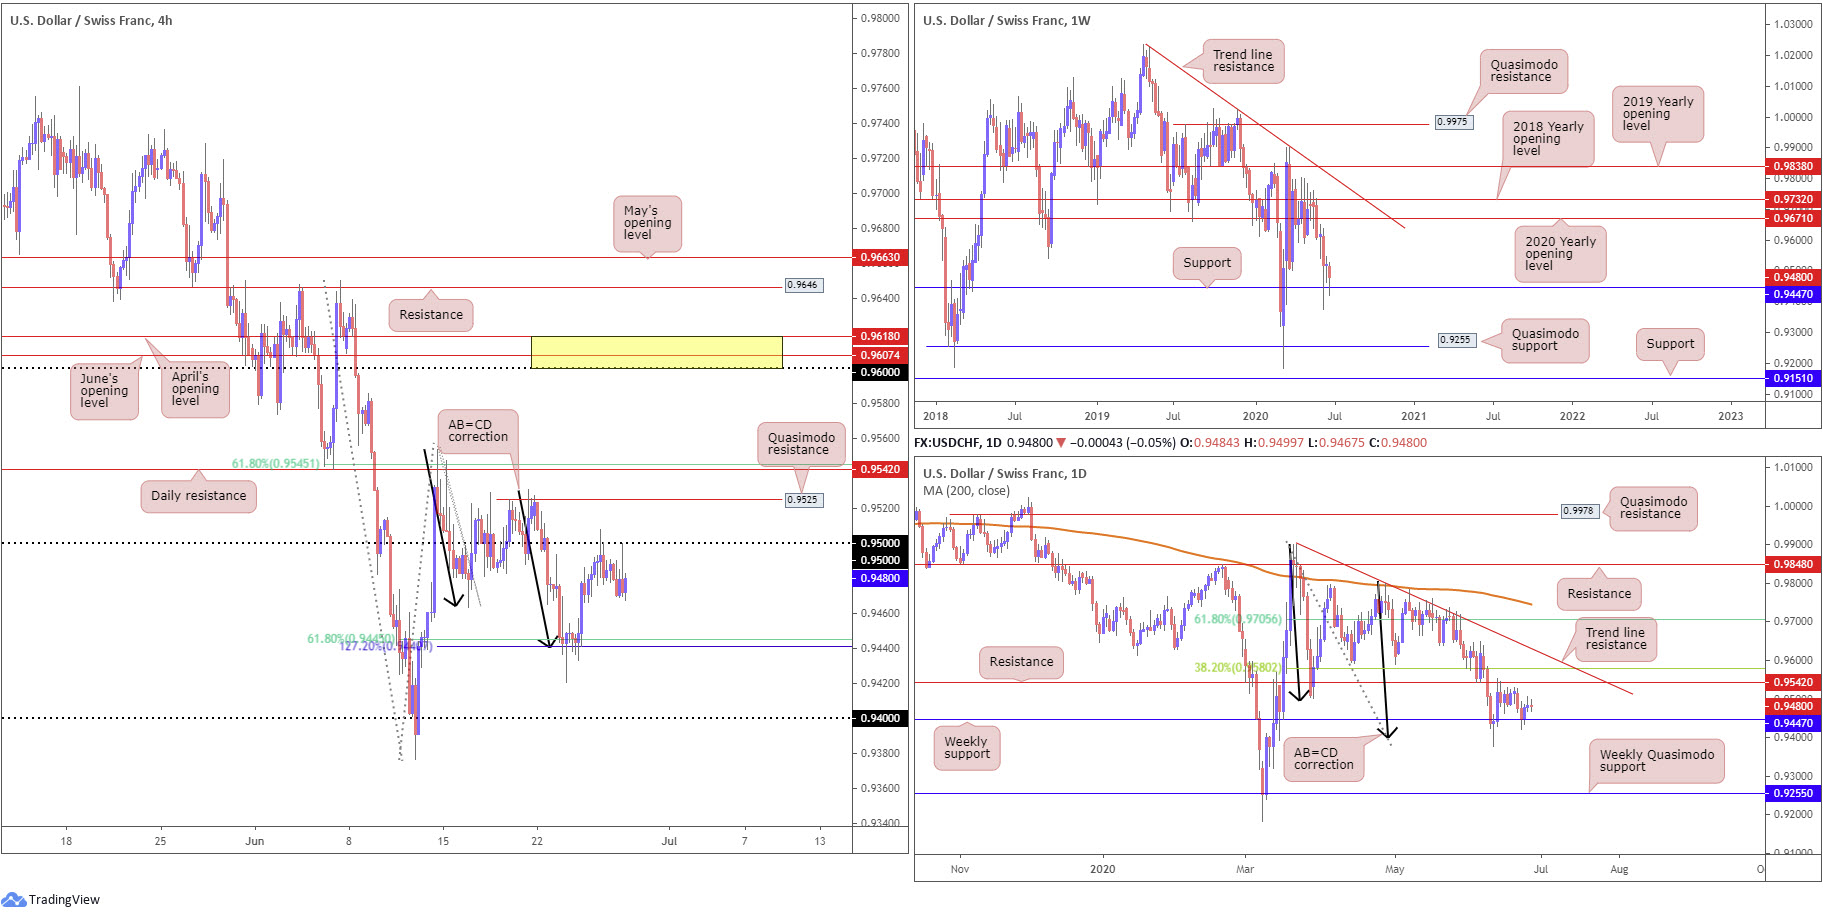
USD/CHF:
Weekly gain/loss: -0.43%
Weekly close: 0.9480
Weekly perspective:
Despite longer-term flow recently engaging with support at 0.9447, buyers continue to display a lack of enthusiasm.
Should buyers regain consciousness this week, we could see price begin approaching the 2020 yearly opening level at 0.9671, stationed close by the 2018 yearly opening level at 0.9732.
Daily perspective:
The initial break of weekly support at 0.9447 threw breakout sellers into a bear trap as daily buyers vigorously defended AB=CD structure (black arrows) at 0.9395.
The initial upside target out of the daily AB=CD pattern, traditionally speaking, can be found at the 38.2% Fibonacci retracement ratio at 0.9580 (derived from legs A-D), positioned above resistance at 0.9542, which, as you can see, has so far done a superb job in holding back buyers.
In the event we overrun 0.9542 and also 0.9580 we could, according to traditional measures, cross swords with the next AB=CD target at 0.9705, the 61.8% Fibonacci retracement ratio, also taken from legs A-D. This implies a push above trend line resistance, taken from the high 0.9901.
H4 perspective:
Wednesday, as evident from the H4 chart, staged a stronger-than-expected rebound from an AB=CD formation (black arrows) at 0.9440 along with weekly support at 0.9447.
Despite the dip from 0.95ish, sellers appear reluctant to commit beyond 0.9470. Terrain above the round number points to Quasimodo resistance at 0.9525 and daily resistance underlined above at 0.9542, along with a 61.8% Fibonacci retracement ratio at 0.9545.
Areas of consideration:
Weekly support at 0.9447 remains a key level in this market. Although the base has so far failed to generate anything considerable, overlooking this level could prove a mistake. Therefore, until this level surrenders, bullish strategies may be the way forward for the time being.
A break of 0.95 may be on the cards, attracting breakout buying to H4 Quasimodo resistance at 0.9525 and daily resistance at 0.9542, followed by a possible pop to the 38.2% Fibonacci retracement ratio at 0.9580 on the daily timeframe (the initial take-profit target out of the daily AB=CD pattern).
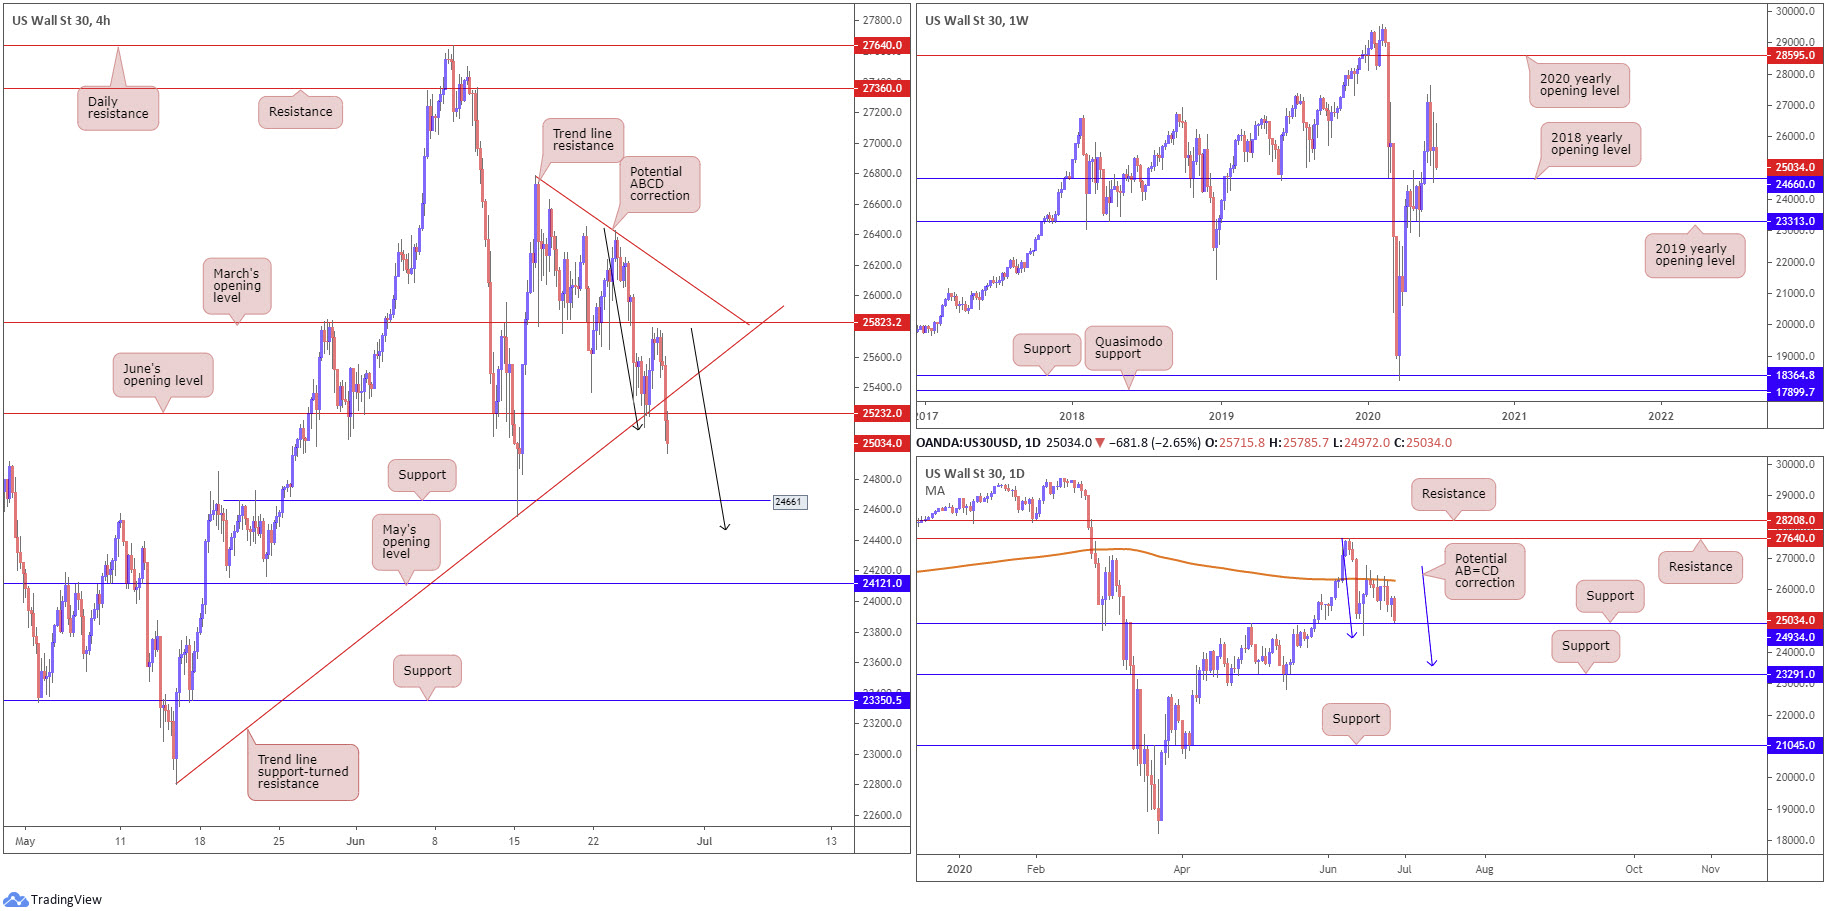
Dow Jones Industrial Average:
Weekly gain/loss: -2.38%
Weekly close: 25034
Weekly perspective:
The 2018 yearly opening level at 24660 remains an important base of support on the weekly timeframe, despite a fragile bid. In the event buyers manage to keep their head above water here, we may eventually pull in the 27638 high, followed by the 2020 yearly opening level at 28595.
Below 24660, however, traders’ crosshairs may be fixed on the 2019 yearly opening level at 23313.
Daily perspective:
Since June 16, the 200-day SMA (orange – 26294) has absorbed upside attempts, with Friday settling within touching distance of support from 24934.
Dipping a toe in waters south of 24934 this week may see support at 23291 call for attention. Another key observation is a potential AB=CD correction (blue arrows) at 23553.
H4 perspective:
US equities dipped further Friday amid fresh concerns surrounding COVID-19. The Dow Jones Industrial Average dropped 730.05 points, or 2.84%; the S&P 500 erased 74.71 points, or 2.42%, and the tech-heavy Nasdaq 100 concluded lower by 252.48 points, or 2.50%.
March’s opening level at 25823 was left unchallenged Friday as trend line support, extended from the low 22803, along with June’s opening level at 25232, gave way Friday. This potentially cleared orders to zero in on support at 24661, followed by a possible ABCD pattern (black arrows) at 24471.
Areas of consideration:
H4 price shows room to push south of June’s opening level at 25232 this week, targeting support at 24661. This may interest intraday sellers.
H4 support at 24661, a level closely converging with a H4 ABCD pattern and weekly support (2018 yearly opening level) at 24660, provides not only a downside target for shorts under 25232, but also a platform to consider for possible buying opportunities this week.
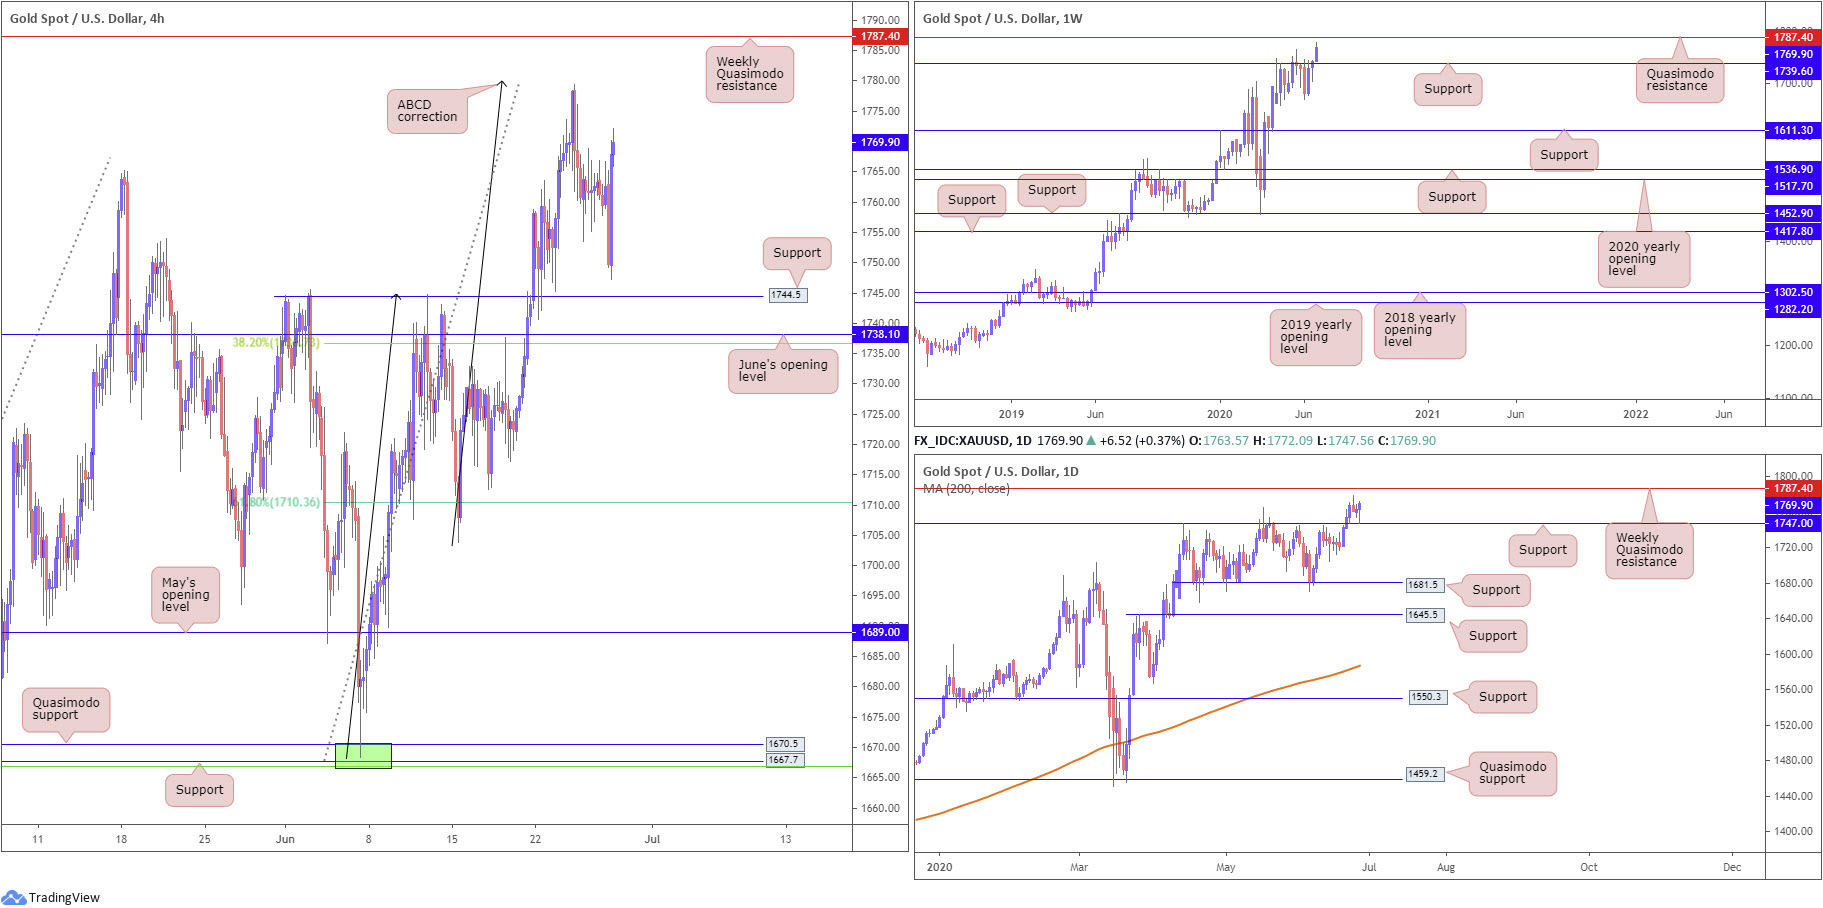
XAU/USD (GOLD):
Weekly gain/loss: +1.54%
Weekly close: 1769.9
Weekly perspective:
XAU/USD bulls entered an offensive phase last week, making considerable progress north of Quasimodo resistance at 1739.6.
1739.6, therefore, could serve as support going forward, with another Quasimodo resistance at 1787.4 also on the radar.
Daily perspective:
Resistance at 1747.0 gave way in early trade last week, laying the foundation for an extension to the weekly Quasimodo resistance mentioned above at 1787.4.
Notably from the daily timeframe, we can see Friday retested 1747.0 as support in the shape of a hammer candlestick pattern. This presents a potential bullish vibe as we head into the new week.
H4 perspective:
Mid-week faded a clear-cut H4 ABCD correction that topped around 1780.0ish (black arrows), with Friday aggressively spiking to lows just ahead of support at 1744.5.
Most ABCD traders will be watching for a dip to the 38.2% Fibonacci retracement at 1736.7 (derived from legs A-D), which, as you can see, converges closely with June’s opening level on the H4 at 1738.1.
What’s also interesting is the recently engulfed weekly Quasimodo resistance at 1739.6 could, as highlighted above, serve as support going forward – this level merges closely with our 38.2% Fibonacci retracement on the H4 at 1736.7.
As for upside targets, weekly Quasimodo resistance at 1787.4 remains prominent on all three timeframes right now.
Areas of consideration:
Traders short the H4 ABCD correction, as highlighted above, will likely have eyeballs on the 38.2% H4 Fibonacci retracement at 1736.7 as an initial target.
The threat of further buying on the higher timeframes, however, poses a real threat to H4 sellers. This is evident from daily support recently making its presence felt and price action printing a bullish candlestick signal (hammer pattern). As a result, along with the fact the overall trend has faced north since 2016, this could be enough to draw in additional buyers this week (with most basing entry and exit levels on the daily hammer pattern), targeting weekly Quasimodo resistance at 1787.4 as an initial upside base.
The accuracy, completeness and timeliness of the information contained on this site cannot be guaranteed. IC Markets does not warranty, guarantee or make any representations, or assume any liability regarding financial results based on the use of the information in the site.
News, views, opinions, recommendations and other information obtained from sources outside of www.icmarkets.com.au, used in this site are believed to be reliable, but we cannot guarantee their accuracy or completeness. All such information is subject to change at any time without notice. IC Markets assumes no responsibility for the content of any linked site.
The fact that such links may exist does not indicate approval or endorsement of any material contained on any linked site. IC Markets is not liable for any harm caused by the transmission, through accessing the services or information on this site, of a computer virus, or other computer code or programming device that might be used to access, delete, damage, disable, disrupt or otherwise impede in any manner, the operation of the site or of any user’s software, hardware, data or property.


