
Key risk events today:
German IFO Business Climate; FOMC Member Williams Speaks; US New Home Sales.
(Italics represents previous analysis and outside sources).
EUR/USD:
Weekly gain/loss: -0.61%
Weekly close: 1.1023
Weekly perspective:
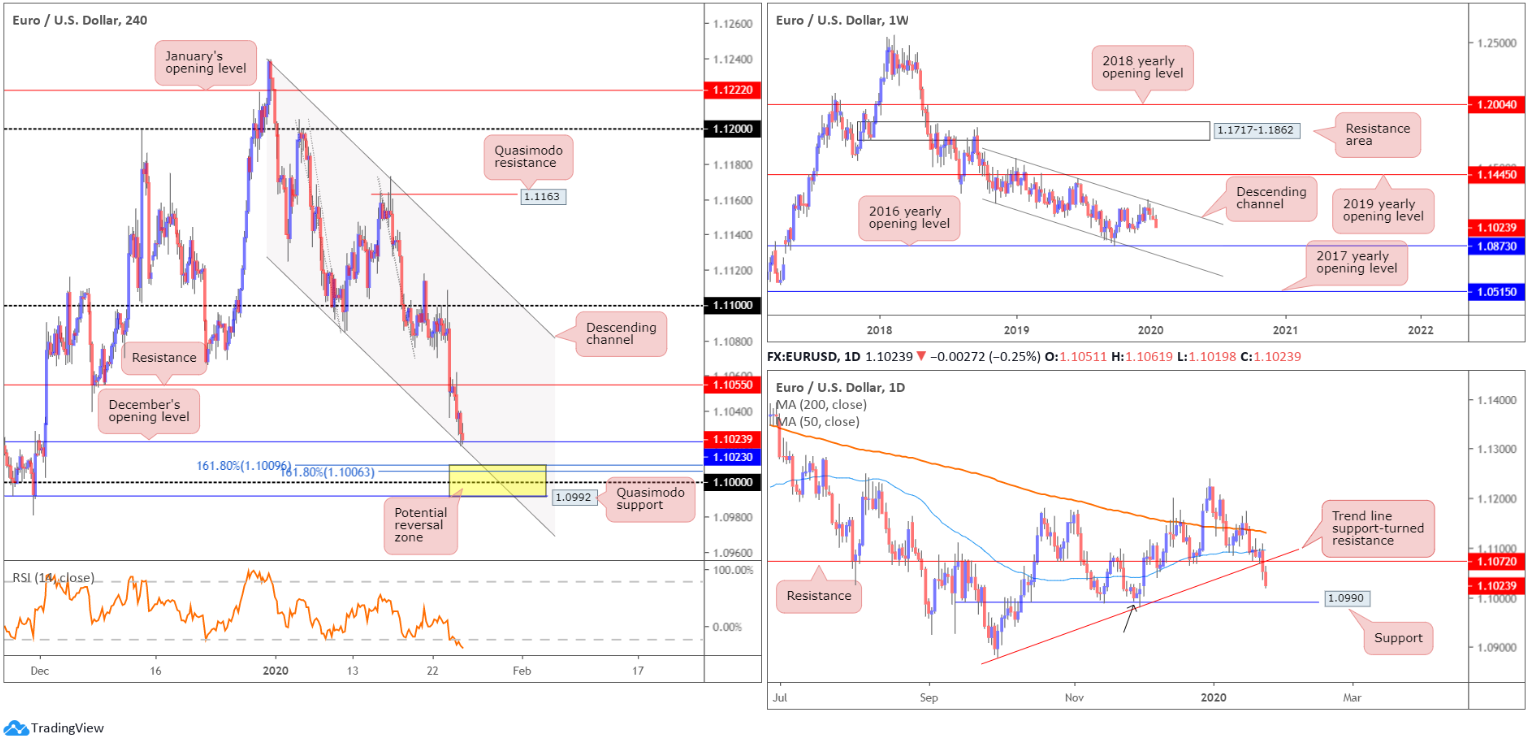
Europe’s single currency glided to a fourth consecutive weekly loss vs. the buck in recent trade, as sellers strengthened their grip south of long-standing channel resistance, drawn from the high 1.1569. Assuming sellers remain in the driving seat this week, the 2016 yearly opening level at 1.0873 is feasible support followed by channel support, taken from the low 1.1109.
Further supporting sellers is the primary trend, descending lower since topping in early 2018, at 1.2555.
Daily perspective:
Support at 1.1072, as well as trend line support, taken from the low 1.0879, surrendered Thursday, with Friday sporting a continuation move lower. The next layer of support lies close by at 1.0990, boasting a reasonably sound history and representing a Quasimodo support at the 1.0992 November 27 low (black arrow).
Traders may also find interest in noting that the 200-day SMA (orange – 1.1131) has been drifting lower since mid-June, while the 50-day SMA (blue – 1.1096) appears to be flattening after rising from 1.1042ish.
H4 perspective:
Shorter-term flow was capped at the underside of resistance fixed from 1.1055 in early trade Friday, despite reasonably upbeat Eurozone PMIs across the board.
The US dollar index, calculated by factoring in the exchange rates of six major world currencies, however, advanced in early London, weighing on its European counterpart. Bolstered on the back of the latest PMI data, the index shook hands with highs just south of 98.00.
Support, in the form of December’s opening level at 1.1023, entered the fold in the closing hours, reinforced by channel support, pencilled in from the low 1.1085. South of these levels we also have an interesting area of support between 1.0992 and 1.1009 (comprised of the Quasimodo support mentioned above on the daily timeframe at 1.0992, the key figure 1.10, the noted channel support and two 161.8% Fibonacci extensions at 1.1006 and 1.1009 – yellow). Chart studies also show the relative strength index (RSI) testing oversold waters.
Areas of consideration:
While a bounce from December’s opening level at 1.1023 could materialise today/early week, the H4 support zone beneath it at 1.0992/1.1009 is likely to pack more of a punch, in terms of an upside move. Note also daily support is seen positioned just two points south of the said H4 support area at 1.0990.
Entry at 1.1009 is an option, with a protective stop-loss order sited under 1.0990, targeting a move beyond 1.1023 to H4 resistance at 1.1055, closely followed by daily resistance at 1.1072. Advancing much beyond this level is unlikely since weekly price portends additional selling to 1.0873.
GBP/USD:
Weekly gain/loss: +0.44%
Weekly close: 1.3068
Weekly perspective:
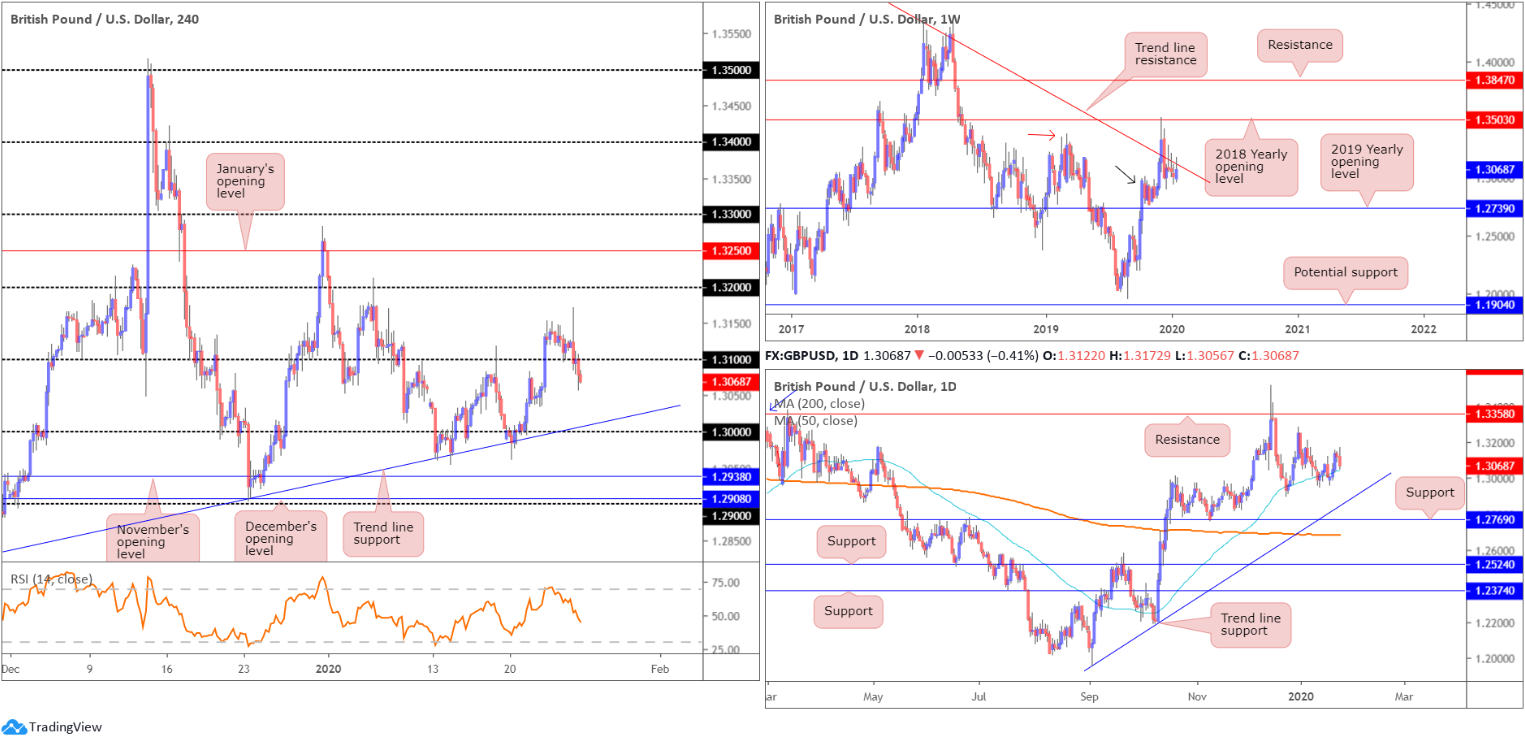
Since late December, longer-term movement has been consolidating between long-standing trend line resistance, pencilled in from the high 1.5930, and demand around the 1.2939 region (black arrow), likely seduced by the recent break of the notable high at 1.3380 (red arrow).
A break of the said trend line has the 2018 yearly opening level at 1.3503 to target, whereas a move south implies we might see a push to the 2019 yearly opening level at 1.2739, consequently tripping sell stops below the current demand zone.
Daily perspective:
Since early October, the 50-day SMA (blue – 1.3044) has been drifting northbound and supported price on several occasions since. A violation of the said SMA exposes trend line support, drawn from the low 1.1958, support at 1.2769 and the 200-day SMA (orange – 1.2687). Note this SMA is in the process of flattening after drifting south since the beginning of July.
With respect to resistance on the daily timeframe, the only levels of interest right now sit at the 1.3284 December 31st high and 1.3358, which capped upside since mid-June 2019.
H4 perspective:
Although the 1.31 handle gave way Friday, the week concluded in positive territory, largely based on reduced BoE rate cut expectations due to promising UK jobs data, optimistic CBI industrial trends survey and encouraging IHS PMIs released Friday.
According to Markit Economics:
January data from the IHS Markit / CIPS Flash UK Composite PMI highlighted a decisive change of direction for the private sector economy at the start of 2020. Business activity expanded for the first time in five months, driven by the sharpest increase in new work since September 2018.
The seasonally adjusted IHS Markit / CIPS Flash UK Composite Output Index – which is based on approximately 85% of usual monthly replies – rose to 52.4 in January, from 49.3 in December. As a result, the headline index registered above the crucial 50.0 no-change mark for the first time since August 2019.
With 1.31 cleared, familiar trend line support is visible this week, fixed from the low 1.2768, and the key figure 1.30. In recent hours, the H4 candles also retested the underside of 1.31, though mildly pulled back at the tail end of the session.
Areas of consideration:
A sell from the underside of 1.31 is a possibility this week, according to the charts. Whether entry is taken at the open, based on the recent retest, or traders wait and see if another retest forms, is trader subjective. The next support target, nevertheless, is set at the 50-day SMA highlighted above, trailed by the current H4 trend line support and then the 1.30 figure.
An ideal scenario is to be able to reduce risk to breakeven at the 50-day SMA so if we turn higher from here the worst-case scenario is a scratch trade.
AUD/USD:
Weekly gain/loss: -0.75%
Weekly close: 0.6824
Weekly perspective:
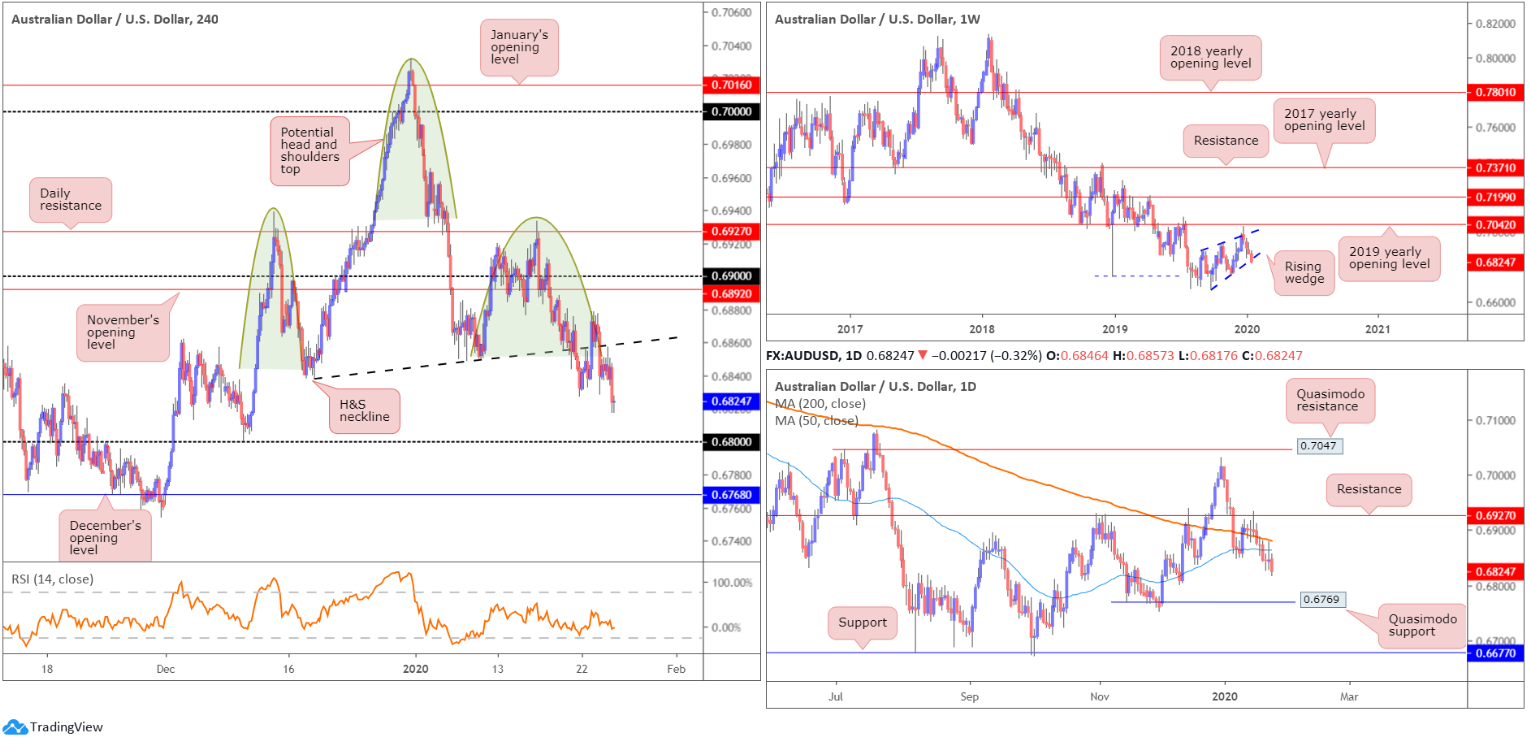
Since registering a bottom in late September at 0.6670, AUD/USD has been carving out what appears to be a rising wedge formation, typically considered a continuation pattern. The past four weeks witnessed price decline back into the rising wedge.
With the primary downtrend having been in full force since topping at 0.8135, in early 2018, the recent close beyond the lower edge of the noted wedge formation may trigger weighty sell stops, both from lower-timeframe traders entering long the shorter-term correction and longer-term traders’ breakout sell orders.
Daily perspective:
Price action on the daily timeframe continues to explore ground beneath both the 200-day SMA (orange – 0.6880) and the 50-day SMA (blue – 0.6864), underscoring a potential move towards Quasimodo support at 0.6769 this week.
H4 perspective:
As the US dollar index extended gains north of a daily channel resistance-turned support, taken from the high 99.67, Friday, AUD/USD navigated lower levels into the close, with price poised to approach the 0.68 handle early this week.
Traders who read previous reports may also recall the following pieces (italics):
H4 price has been chalking up a potential head and shoulders top pattern since mid-December 2019 (left shoulder sports a top at 0.6938, right shoulder at 0.6933 and the head at 0.7031 – green). The neckline is drawn from the 0.6838 December 18 low and the 0.6850 January 9 low (black line). Traditionally, traders wait for a close beneath the neckline to trigger shorts; others, however, may attempt a short at the right shoulder or even at the formation of the head.
As evident from the H4 timeframe, price closed beneath the H&S neckline on Tuesday and remained south of the line Wednesday and also closed lower on Thursday. Although an initial (structure) target can be seen at 0.68, H&S traders will be looking for much lower levels (calculation from the head to neckline added to the breakout point).
There will likely already be traders short this market on Tuesday’s H4 close south of the H&S neckline. Stop-loss placement potentially falls in above the right shoulder 0.6933, above the round number 0.69 or November’s opening level at 0.6892. For conservative traders, entry may form on the back of a successful H4 retest at the H&S neckline, in the shape of a notable bearish candlestick pattern (entry and risk can be determined according to the candlestick’s structure).
As evident from the H4 chart, price retested the H&S neckline and rotated lower.
Areas of consideration:
Well done to any readers short the H&S formation, either on Tuesday’s breakout or Friday’s neckline retest. As mentioned above, structurally, the initial take-profit target is the 0.68 handle, followed by December’s opening level at 0.6768/daily Quasimodo support at 0.6769. The H&S take-profit target, however, is not seen until 0.6670ish, calculated by taking the distance between the head and the neckline and adding this to the breakout point.
USD/JPY:
Weekly gain/loss: -0.82%
Weekly close: 109.24
Weekly perspective:
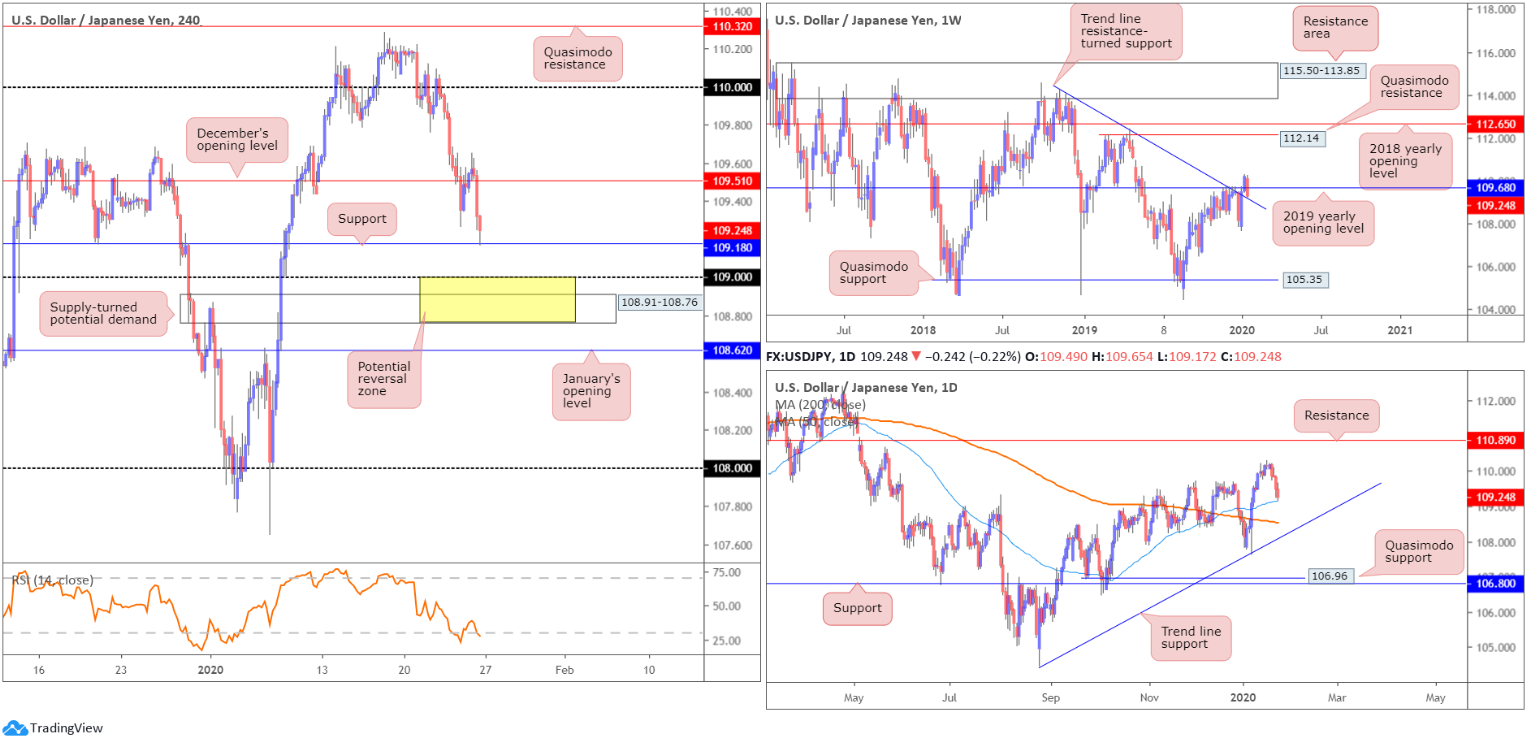
Snapping a two-week winning streak, USD/JPY curved lower last week, erasing the prior week’s gains and shedding more than 85 points. Price movement dipped under the 2019 yearly opening level at 109.68 and retested trend line resistance-turned support, extended from the high 114.23.
The retest may set the long-term stage for a run to Quasimodo resistance at 112.14 and the 2018 yearly opening level at 112.65, whereas moves lower underscores the 107.65 Jan 6 low.
Daily perspective:
The recent decline on the daily timeframe brought price to within a point of testing the 50-day SMA (blue – 109.16) Friday. Note the said SMA crossed above the 200-day SMA (orange – 108.53) mid-December, referred to as a ‘Golden Cross’. Trend line support, drawn from the low 104.44, may enter sight this week, in the event we continue exploring lower ground, while a push higher has the 110.29 January 17 high to play for, with a break targeting resistance at 110.89.
H4 perspective:
Despite a reasonably optimistic start Friday, things turned sour going into US hours and pulled things to multi-week lows of 109.17.
Markets turned risk averse on concern the spread of China’s coronavirus may disrupt travel and trade and slow global economic growth, consequently increasing demand for the safe-haven Japanese yen.
Confirmed by the relative strength index (RSI) entering oversold territory, support at 109.18 made an appearance a couple of hours before the close. Sited just north of the 50-day SMA, an intraday bounce may emerge from here today, targeting a retest at December’s opening level from 109.51.
Areas of consideration:
H4 support mentioned above at 109.18 is in focus. Not only does the base align with the 50-day SMA value, the weekly trend line support highlighted above also converges with the support level. As stated above, 109.51 rests as the initial take-profit target.
Another area of interest this week is between supply-turned possible demand at 108.91-108.76 and the round number 109 (yellow). Psychological levels are prone to fakeouts, given the number of orders these hurdles attract. Therefore, a whipsaw through 109 into 108.91-108.76 not only trips sell stops to buy into (liquidity), the move fills any buy orders out of the noted demand.
Irrespective of the support area selected, conservative traders will likely opt to wait and see if a H4 bullish candlestick forms before pulling the trigger (entry and risk levels can then be set according to the candle pattern).
USD/CAD:
Weekly gain/loss: +0.63%
Weekly close: 1.3146
Weekly perspective:
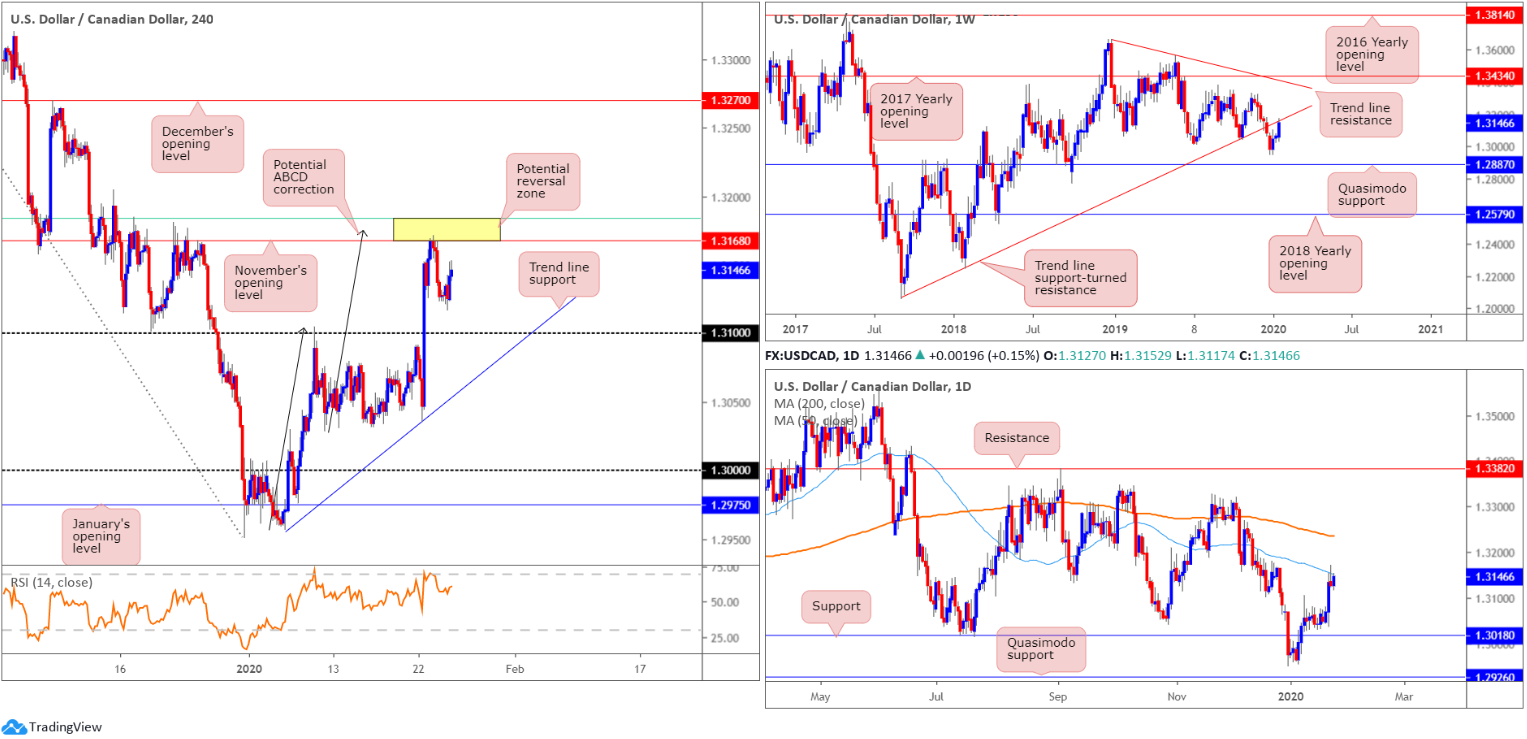
USD/CAD bulls entered an offensive phase last week, lifting the pair more than 80 points. This resulted in trend line support-turned resistance, extended from the low 1.2061, entering view, which may prompt a selloff this week to the 1.2951 December 30 low, followed by a Quasimodo formation at 1.2887.
Should further buying arise, another trend line resistance, taken from the high 1.3661, is seen, closely shadowed by the 2017 yearly opening level at 1.3434.
The immediate trend has faced north since bottoming in September 2017; however, this move could also be considered a deep pullback in a larger downtrend from the 1.4689 peak in early January 2016.
Daily perspective:
In conjunction with weekly activity, the pair also has daily price crossing swords with the 50-day SMA (blue – 1.3151). A breach of the said SMA unlocks the door for an approach towards the 200-day SMA (orange – 1.3235). Both SMAs currently point south.
With respect to support on this timeframe, 1.3018 represents a reasonably attractive level, as does the Quasimodo formation at 1.2926.
H4 perspective:
The US dollar finished a touch higher against its Canadian counterpart Friday, adding 20 points. On the data front, according to Statistics Canada, November’s retail sales rose 0.9% to $51.5 billion, largely offsetting the 1.1% decline in October. The increase was primarily attributable to higher sales at motor vehicle and parts dealers and at food and beverage stores, both of which were down in October. Core sales, on the other hand, fell short of market consensus, though had little impact.
For those who read Thursday’s technical briefing you may recall the following (italics):
H4 structure has November’s opening level in view as possible resistance at 1.3168, which aligns closely with a potential ABCD (black arrows) correction at 1.3175 and a 61.8% Fibonacci retracement ratio at 1.3183 (green). Higher-timeframe structure also has daily price crossing swords with the 50-day SMA (blue – 1.3153), and weekly movement testing trend line support-turned resistance, extended from the low 1.2061.
With weekly price testing trend line resistance, daily price testing its 50-day SMA and H4 price hovering just south of a reasonably attractive resistance zone between 1.3183/1.3168, a sell from this area, should we test the zone, could be something to consider today, targeting 1.31 as the initial take-profit zone.
As evident from the H4 chart, price action tested 1.3183/1.3168 Thursday and rotated lower, though has been slightly marred by Friday’s modest advance.
Areas of consideration:
Traders short from 1.3183/1.3168 are likely to have reduced risk to breakeven before the close, possibly feeling exposed on the back of recent buying and a possible opening gap Sunday.
1.31 remains the initial target area, while a break of the psychological threshold highlights H4 trend line support as the next port of call, etched from the low 1.2957.
USD/CHF:
Weekly gain/loss: +0.36%
Weekly close: 0.9709
Weekly perspective:
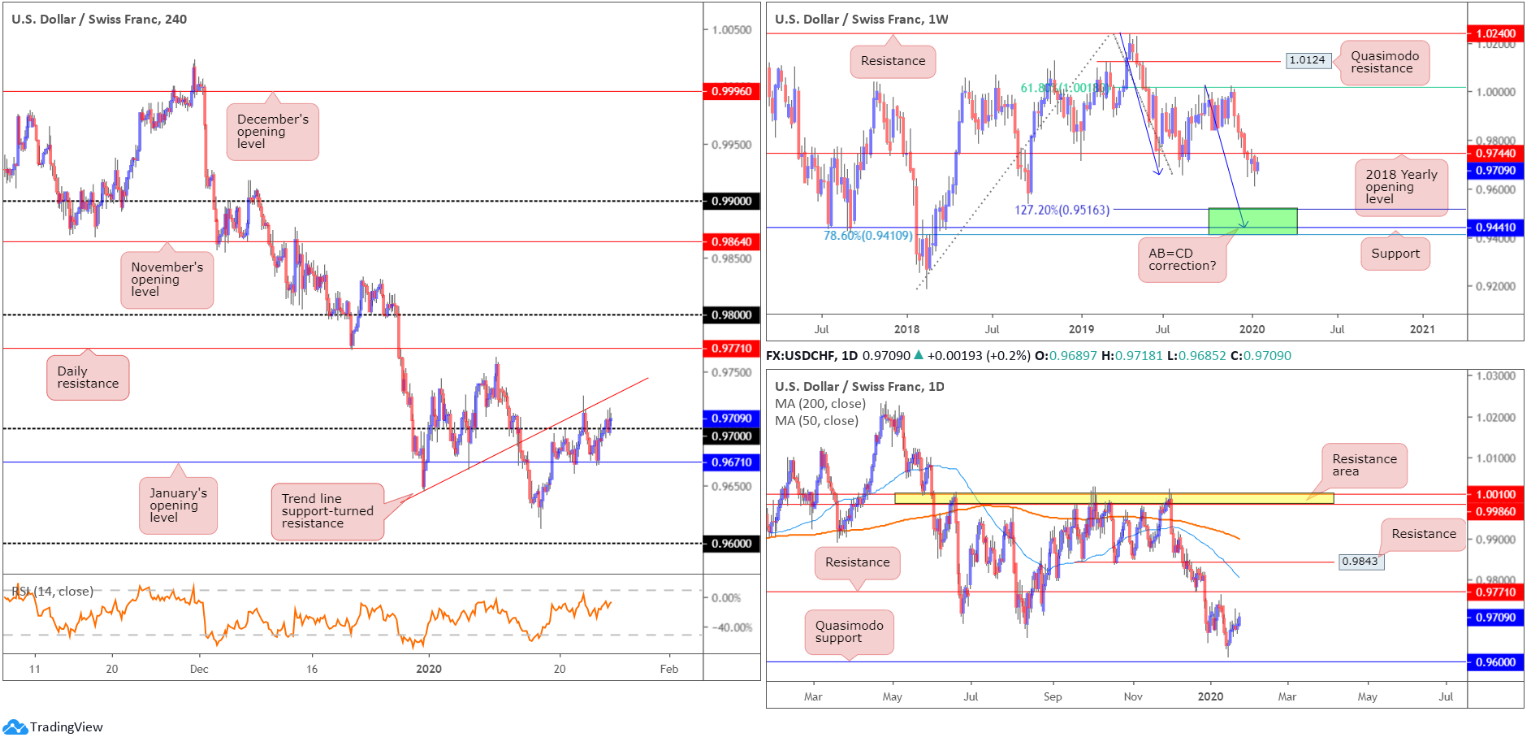
Holding south of the 2018 yearly opening level at 0.9744, last week drifted within the confines of the prior week’s range at 0.9736/0.9613. The next downside target sits within 0.9410/0.9516, comprised of a 78.6% Fibonacci retracement at 0.9410, support at 0.9441 and a 127.2% AB=CD bullish correction (black arrows]) at 0.9516 – green. Overthrowing 0.9744 this week, however, likely clears the river north back up to the 61.8% Fibonacci retracement at 1.0018, a level that’s capped upside since mid-June 2019.
Daily perspective:
According to structure on the daily timeframe, price could swipe either way this week. Resistance is positioned at 0.9771 and support, shaped in the form of a Quasimodo formation, at 0.9600. It might also interest some traders to note the 200/50-day SMAs point southbound (0.9900/0.9806), with the spread expanding since late December.
H4 perspective:
Broad-based USD buying provided fresh impetus to USD/CHF Friday, extending Thursday’s recovery off January’s opening level at 0.9671 and reclaiming 0.97+ status into the close.
Based on the H4 candlesticks north of 0.97, interested buyers inhabit this region. Traders are likely employing a cautious stance, however, watchful of possible resistance emerging off trend line resistance, taken from the low 0.9646, sited a few points below the 2018 yearly opening level mentioned above on the weekly timeframe at 0.9744.
Areas of consideration:
Having noted weekly resistance plotted at 0.9744, entering long positions off 0.97 is chancy. This is particularly apparent after observing nearby H4 resistance, in the form of a trend line.
Short sales off the noted weekly resistance may be an idea worth exploring, appealing to more if the H4 trend line resistance merges with the level when tested. Despite this, waiting for additional H4 candlestick confirmation to form (entry and risk can be calculated based off this pattern) is still probably a good idea for traders threatened by a potential move to daily resistance at 0.9771.
The initial downside target off 0.9744 sits at the 0.97 level.
Dow Jones Industrial Average:
Weekly gain/loss: -1.20%
Weekly close: 28968
Weekly perspective:
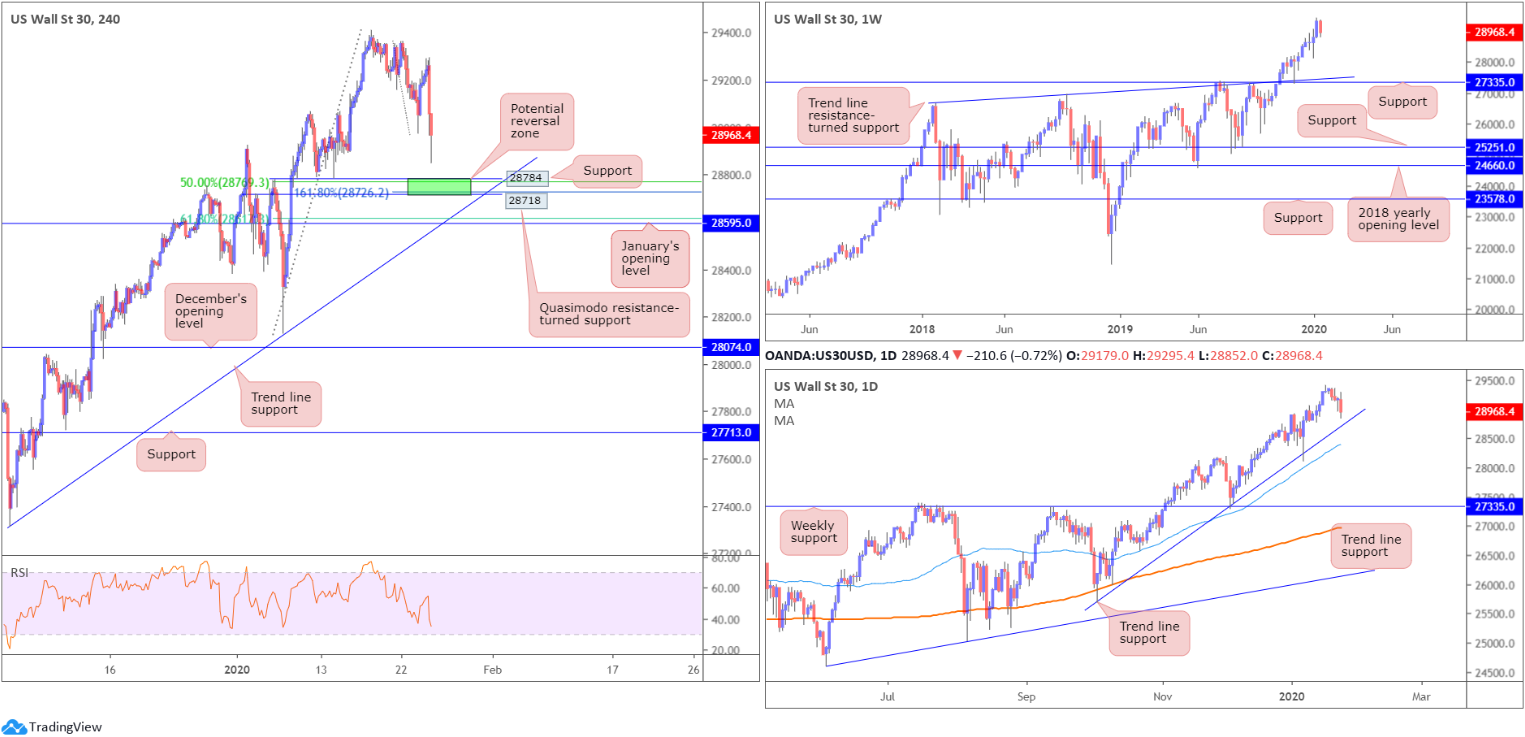
Following a weekly hammer candlestick pattern (considered a buy signal at troughs), formed eight weeks back at the retest of support drawn from 27335, along with trend line support etched from the high 26670, the index has continued to advance higher since, recently testing fresh record peaks of 29409.
Last week, however, witnessed the benchmark’s largest weekly decline since late July 2019, considered by some candlestick traders to be a bearish inside pattern.
Daily perspective:
Trend line support, extended from the low 25710, remains in motion, closely trailed by additional support from the 50-day SMA (blue – 28405). Candlestick enthusiasts may have also noticed Friday’s session ended in the shape of a bearish outside day.
H4 perspective:
US equities fell sharply Friday amid concerns relating to the spread of the respiratory virus in China and to other countries, fuelling fears the disruption to travel and trade may undermine global economic growth. The Dow Jones Industrial Average lost 170.36 points, or 0.58%; the S&P 500 erased 30.07 points, or 0.90% and the tech-heavy Nasdaq 100 ended lower by 75.52 points, or 0.82%.
From a technical standpoint, recent selling exposed a relatively strong area of support to possibly work with this week between 28718/28784. Comprised of a Quasimodo resistance-turned support at 28718, a 161.8% Fibonacci extension at 28726, a 50.0% support value at 28771 and support coming in at 28784, this area, highlighted in green, could bounce prices higher this week. In addition to this, the current daily trend line support also converges with the highlighted H4 support zone.
Areas of consideration:
While 28718/28784 certainly has appeal for potential long opportunities this week, the possibility of a fakeout emerging through the said area to January’s opening level at 28595/the 61.8% Fibonacci retracement at 28621 is certainly there. For that reason, entering based on additional confirmation might be an idea. This could be something as simple as a H4 bullish candlestick signal, or drilling down to the lower timeframes and attempting to enter based off lower-timeframe structure, a trend line break/retest, for example.
XAU/USD (GOLD):
Weekly gain/loss: +0.92%
Weekly close: 1571.4
Weekly perspective:
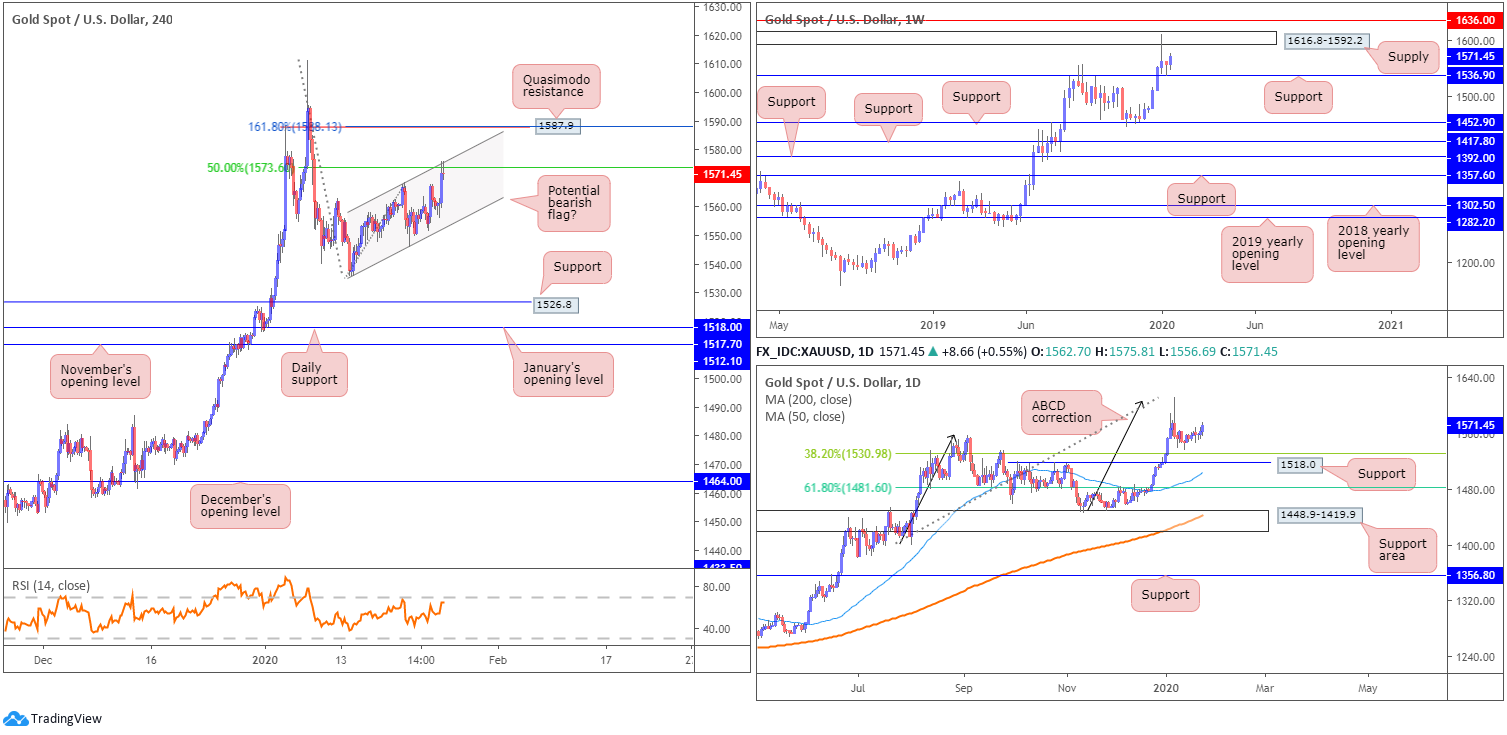
Following a clear-cut hammer candlestick configuration (considered a bullish signal at troughs) off support at 1536.9, additional bullish sentiment was seen last week. Continued bidding from this point has supply at 1616.8-1592.2 in view as a possible ceiling, with a break identifying resistance at 1636.0.
A violation of the said support, on the other hand, could prompt selling towards additional layers of support at 1452.9, 1417.8, 1392.0 and 1357.6.
Daily perspective:
Although we seem to be entering a bottoming phase on the daily timeframe, bolstered by weekly support mentioned above at 1536.9, it’s still worth acknowledging the 38.2% Fibonacci retracement at 1530.9 as possible support, closely followed by 1518.0. The former offers an initial take-profit target for traders short the ABCD bearish correction (black arrows) at 1608.0.
H4 perspective:
Since bottoming at 1535.7, the H4 candles have been compressing within what appears to be a potential bearish flag, formed following a decline from the 1611.3 January 7 high. Recent movement favoured safe-haven assets, bidding the price of gold higher and testing the upper edge of the flag, extended from the high 1568.6, which happens to merge with a 50.0% retracement at 1573.8.
A breakout south from here exposes support coming in at 1526.8, sited only a handful of points north of daily support at 1518.0 and January’s opening level at 1517.7. Continued upside, however, has Quasimodo resistance in sight at 1587.9, reinforced by a 161.8% Fibonacci extension and closely shadowed by the lower edge of weekly supply at 1616.8-1592.2.
Areas of consideration:
A pullback off the upper edge of the potential H4 bearish flag could be an option today, targeting the lower edge of the flag as the initial port of call, taken from the low 1535.7.
An eventual breakout beneath the lower edge of the current H4 flag, while a tempting sell towards H4 support at 1526.8, positioned just south of the 38.2% daily Fibonacci retracement at 1530.9, must contend with possible opposition off the weekly support underlined above at 1536.9. Therefore, waiting for a H4 close beneath the H4 flag as well as a retest, preferably by way of a H4 bearish candlestick signal, may be the better/more conservative path to take before selling. Waiting for additional candlestick confirmation helps identify seller intent and offers entry and risk levels to work with.
The accuracy, completeness and timeliness of the information contained on this site cannot be guaranteed. IC Markets does not warranty, guarantee or make any representations, or assume any liability regarding financial results based on the use of the information in the site.
News, views, opinions, recommendations and other information obtained from sources outside of www.icmarkets.com.au, used in this site are believed to be reliable, but we cannot guarantee their accuracy or completeness. All such information is subject to change at any time without notice. IC Markets assumes no responsibility for the content of any linked site.
The fact that such links may exist does not indicate approval or endorsement of any material contained on any linked site. IC Markets is not liable for any harm caused by the transmission, through accessing the services or information on this site, of a computer virus, or other computer code or programming device that might be used to access, delete, damage, disable, disrupt or otherwise impede in any manner, the operation of the site or of any user’s software, hardware, data or property.


