
Key risk events today:
Limited.
(Previous analysis as well as outside sources – italics).
EUR/USD:
Weekly gain/loss: -0.45%
Weekly close: 1.0821
Weekly perspective:
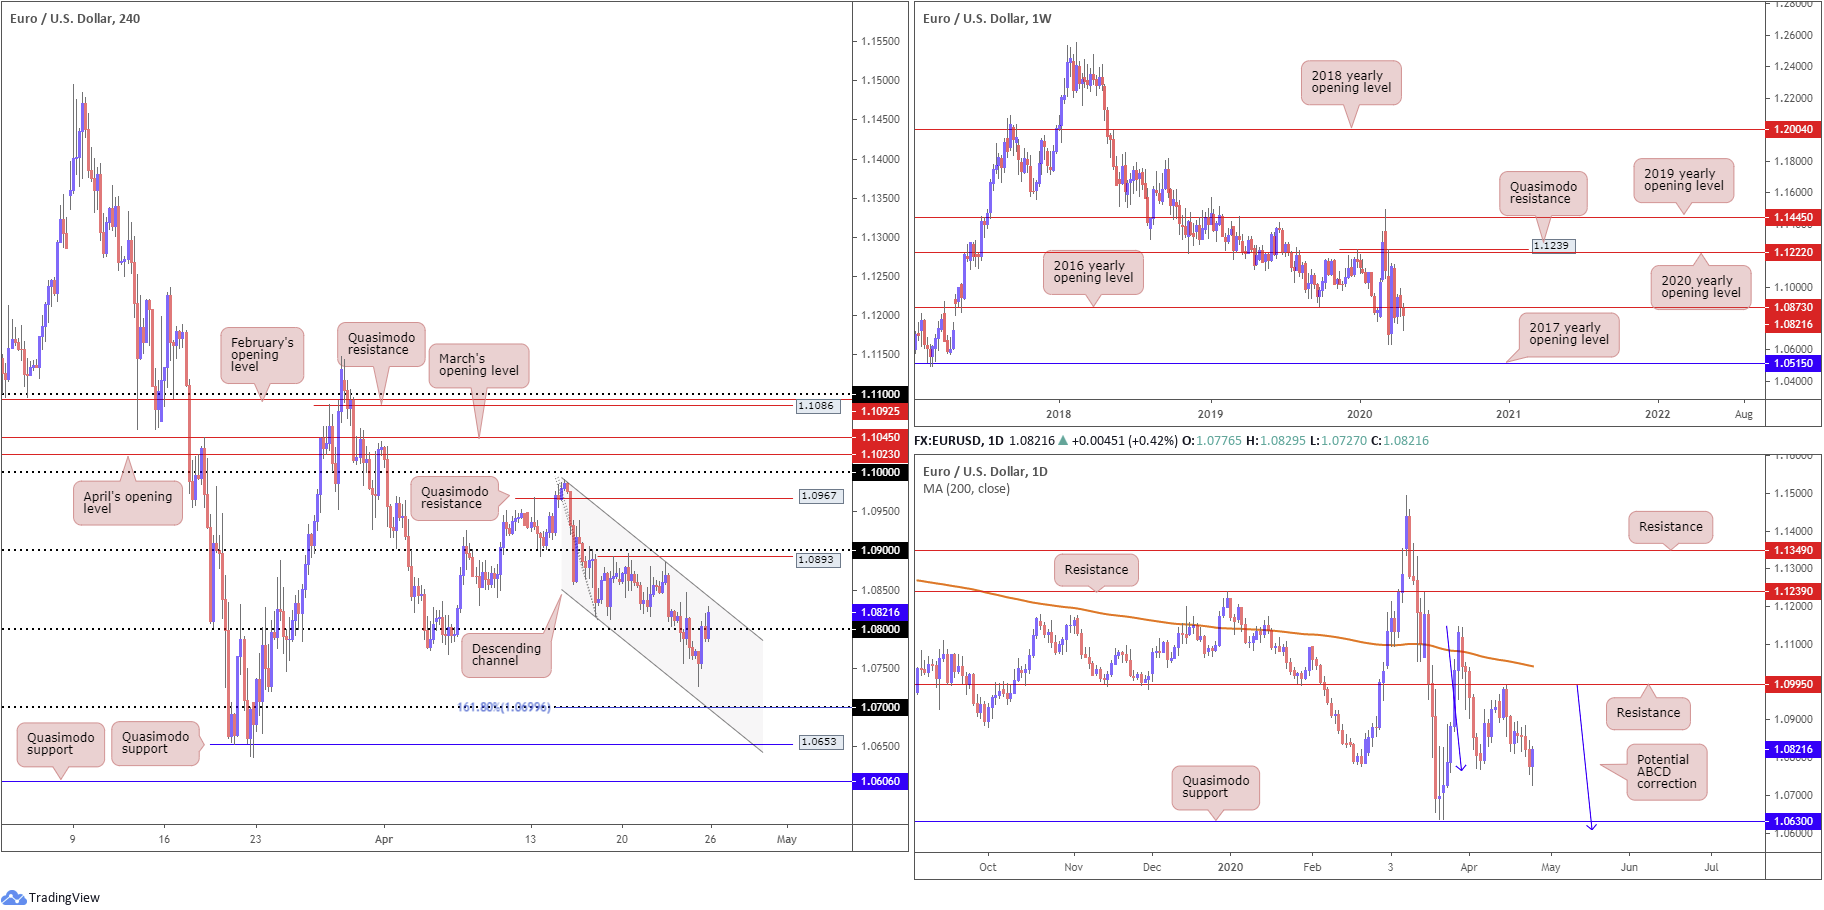
Sellers attempted to strengthen their grip last week, with EUR/USD clearing space south of the 2016 yearly opening level at 1.0873 and erasing nearly 50 pips.
Though concluding the week off session lows at 1.0727, multi-year lows at 1.0635 are still in view as viable support, with follow-through moves shining the spotlight on the 2017 yearly opening level at 1.0515.
Daily perspective:
Despite hesitation at the beginning of the week, Wednesday, by way of a bearish outside candle configuration, set the stage for further downside. Thursday eclipsed the 1.0768 April 6 low, with Friday, albeit wrapping up in positive territory, clocking near 5-week lows at 1.0727.
Continued downside could have Quasimodo support at 1.0630 put in an appearance, which, as you can see, is closely shadowed by a potential ABCD correction (blue arrows) at 1.0597.
H4 perspective:
Following Thursday’s sour Eurozone PMIs, Friday brought with it dismal German Ifo survey.
The ifo Institute noted:
Sentiment at German companies is catastrophic. The ifo Business Climate Index crashed from 85.9 points (seasonally adjusted) in March to 74.3 points in April. This is the lowest value ever recorded, and never before has the index fallen so drastically.
Technically, the candles remain compressing within the walls of a descending channel between 1.0990/1.0816, with Friday closing within touching distance of channel resistance.
To the downside, beyond 1.08, 1.07 is marked as visible support, merging closely with a 161.8% Fibonacci extension point at 1.0699. Airspace above channel resistance leads the unit to Quasimodo resistance at 1.0893, followed closely by 1.09.
Areas of consideration:
The 1.0630ish area marks a viable downside target this week, both on the weekly and daily timeframes, consequently placing sellers somewhat in the driving seat.
As such, the week’s focus will likely be drawn towards resistance on the H4 timeframe. Channel resistance and the Quasimodo resistance at 1.0893, therefore, could play a key role in trade. Prudent traders, nonetheless, may still seek additional confirmation before pulling the trigger. This could be something as simple as a H4 bearish candlestick pattern.
GBP/USD:
Weekly gain/loss: -1.09%
Weekly close: 1.2360
Weekly perspective:
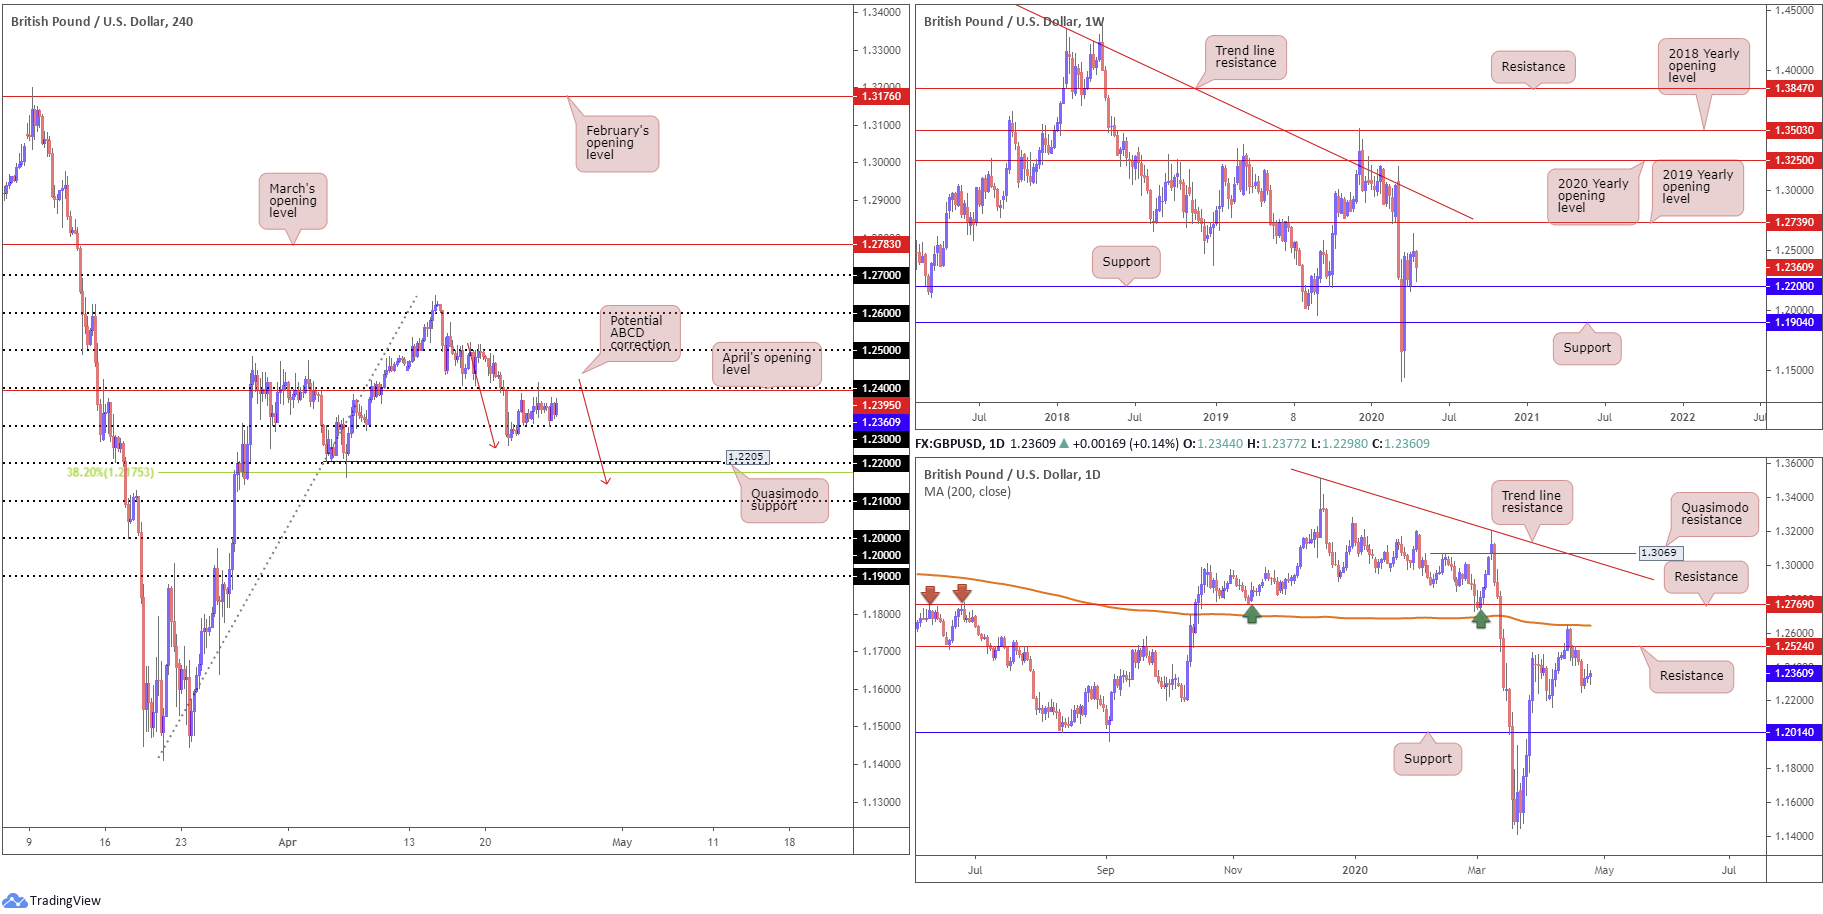
After a dominant showing off 1.2647 the week prior, shaped as a shooting star candlestick pattern, last week’s movement slipped to lows at 1.2247, led by an overall stronger dollar. GBP/USD now has eyes for support at 1.2200.
Renewed upside, on the other hand, has the 2019 yearly opening level at 1.2739 on the radar, with a break exposing a long-standing trend line resistance, taken from the high 1.5930.
Daily perspective:
Establishing a position beneath 1.2524, now a serving resistance level, had the unit work its way towards the 1.2163 April 7 low last week.
Downside momentum, however, levelled off into mid-week trade, forming back-to-back indecision candles. Should the sellers regain consciousness this week and dethrone 1.2163, support at 1.2014 is likely to make a showing.
H4 perspective:
Early hours Friday invited an approach to 1.23, welcomed shortly after disappointing UK retail sales data. Despite this, the pair swiftly reversed losses amid a retreat in the US dollar index.
The Office for National Statistics noted:
In March 2020, the monthly retail sales volume fell sharply by 5.1%; the largest fall since the series began as many stores ceased trading from 23 March following official government guidance during the coronavirus (COVID-19) pandemic.
1.23 remains a notable support base to have eyes on this week, with 1.24 and April’s opening level at 1.2395 stationed as feasible resistance. Further out we also see the 1.22 handle as appealing support, converging with nearby Quasimodo support at 1.2205, a 38.2% Fibonacci retracement at 1.2175, an ABCD correction (red arrows) at 1.2147 and weekly support at 1.2200. Also of note is 1.25 as resistance, coming in closely with daily resistance at 1.2524.
Areas of consideration:
Although H4 flow may glean support/resistance off 1.23/4 in the early stages of the week, traders will likely have their crosshairs fixed on 1.25 and 1.22 as major support/resistance this week due to the higher-timeframe connection. Both levels clearly carry technical weight.
AUD/USD:
Weekly gain/loss: +0.52%
Weekly close: 0.6394
Weekly perspective:
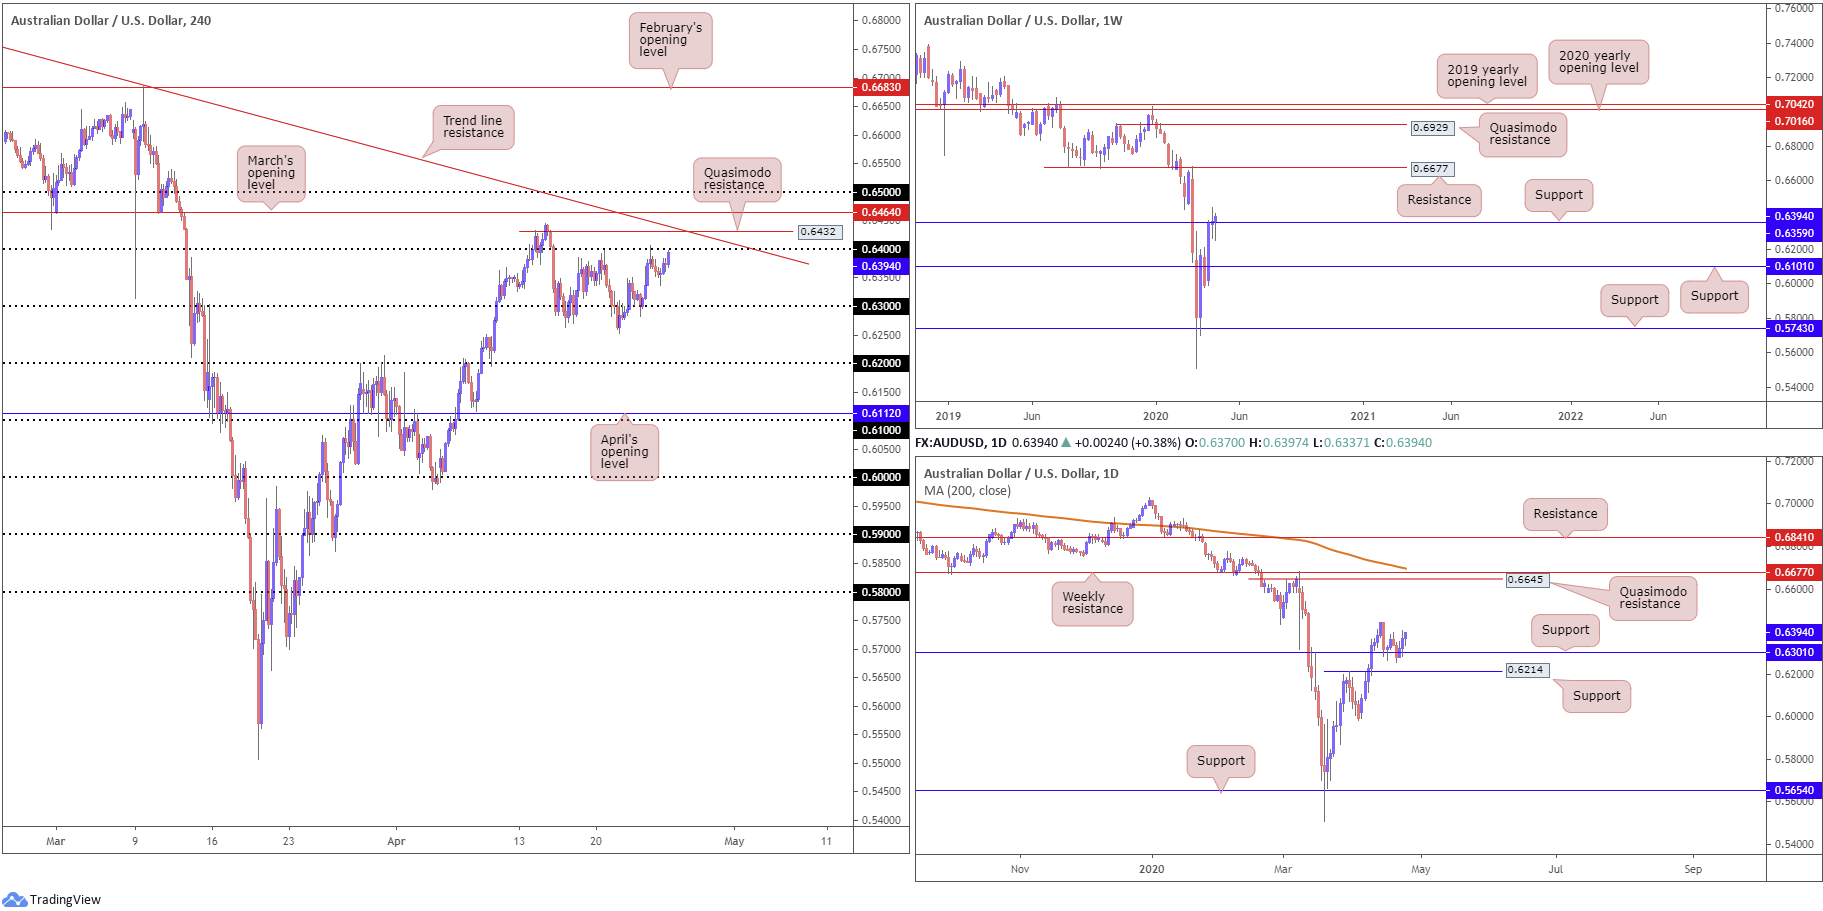
After dipping its toe in waters north of resistance at 0.6359, AUD/USD retained a modest underlying bid last week, adding more than 30 points into the close. Meeting the characteristics of a possible support level, 0.6359 may encourage another wave of buying this week, targeting resistance based at 0.6677.
Yet, failure to push off 0.6359 could lead to support at 0.6101 re-entering the limelight.
Daily perspective:
Mid-week trading brought on a retest at support from 0.6301, a level situated just ahead of another layer of support priced in at 0.6214. As you can see, buyers ended the week in the driving seat, though Friday’s movement failed to reach new highs. This, therefore, could be a sign buyers may be weakening.
Sustained upside this week has the 0.6444 April 14 high to target, with a breach underlining the possibility of bringing in Quasimodo resistance at 0.6645, followed by the weekly resistance level mentioned above at 0.6677.
H4 perspective:
Thursday shook hands with 0.64, pushing to lows at 0.6337 Friday. Having seen H4 price conclude the week a touch beneath 0.64, focus has shifted to Quasimodo resistance at 0.6432 and trend line resistance, extended from the high 0.7025.
Buy-stop liquidity above 0.64 is likely appealing to some traders, with bearish themes off Quasimodo resistance at 0.6432 a possibility.
Areas of consideration:
A fakeout above 0.64 is likely in the offing, a move which trips the majority of buys stops above the round number and tests H4 Quasimodo resistance at 0.6432/H4 trend line resistance. The combination of the said resistances, on top of buy-stop liquidity north of 0.64, could fuel sellers to voyage back beneath 0.64 in early trade this week, perhaps targeting 0.63ish. Traders may use March’s opening level at 0.6464 as a base to locate protective stop-loss orders; others could favour the 0.65 handle.
The fakeout play above 0.64 is unlikely to see moves reach much beyond 0.63, due to the fact both weekly and daily timeframes are coming off supports. Therefore, strict trade management is a must.
USD/JPY:
Weekly gain/loss: -0.07%
Weekly close: 107.44
Weekly perspective:
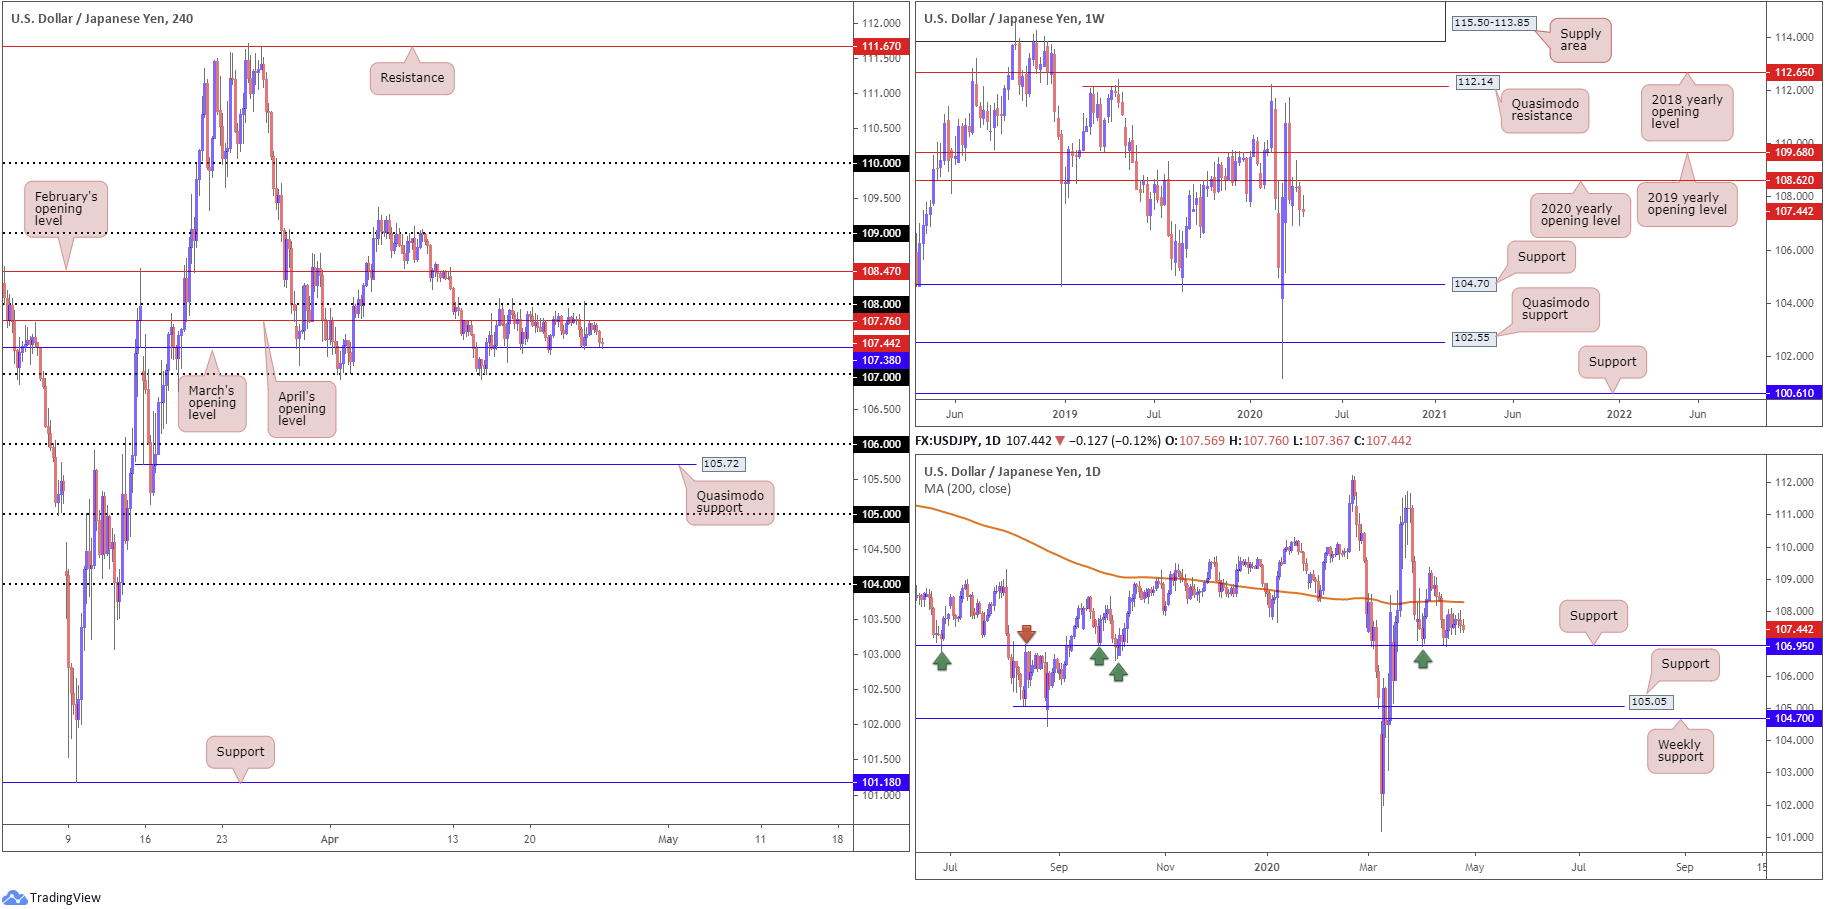
The vibe on the weekly timeframe continues to represent a bearish tone. Price action recently produced a clear-cut shooting star candlestick configuration off the 2020 yearly opening level at 108.62, with a strong follow-through move to the downside to lows of 106.92 seen thereafter. Last week was uneventful, however, ending the session closing pretty much unchanged off the prior week’s low.
The next support target is not seen until 104.70. Note this figure also represents the lower boundary of a multi-month range between Quasimodo resistance at 112.14.
Daily perspective:
Support at 106.95 continues to have a presence on the daily timeframe. The 200-day SMA (orange – 108.29) stands as possible resistance, whereas a break through 106.95 could land the 105.05 support in the mix, followed by weekly support highlighted above at 104.70.
H4 perspective:
Since April 16, H4 price has remained bounded by the 108 handle and March’s opening level at 107.38 (note in between this range we also have April’s opening level at 107.76 present). 107 is seen as viable support outside of the consolidation, along with February’s opening level at 108.47 as resistance.
Areas of consideration:
Given the ranging behaviour witnessed on USD/JPY over the past few weeks, the outlook remains unchanged.
The H4 range may be of interest to lower-timeframe traders this week; fading the extremes are an option. Waiting for additional candlestick confirmation to form before pulling the trigger, however, is an idea, since whipsaws are common viewing within rangebound environments.
Weekly price suggesting lower levels certainly places a question mark on further gains above 108, though if we’re able to reach 108.47, active sellers are likely to enter the fray given the close connection to the 200-day SMA (108.29). The combination of daily support at 106.95 and 107 could also spark a reaction if tested.
USD/CAD:
Weekly gain/loss: +0.69%
Weekly close: 1.4093
Weekly perspective:
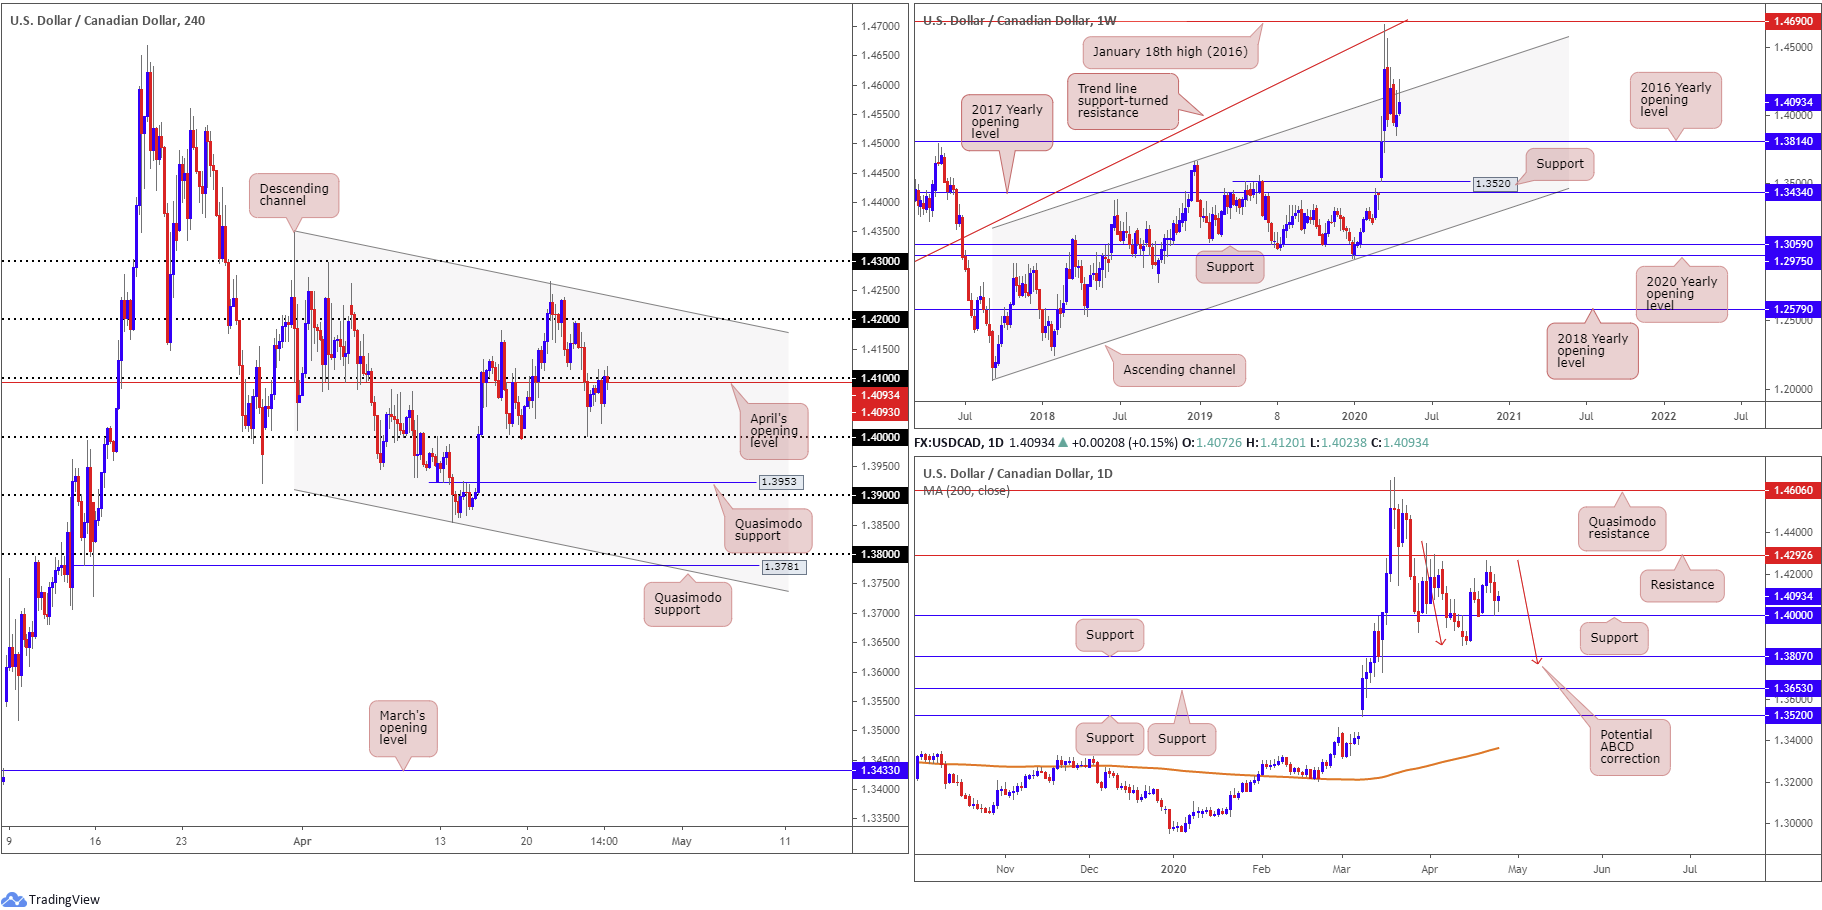
After mid-March crossed swords with trend line support-turned resistance, taken from the 1.1919 low, recent movement saw a test of lows ahead of support at 1.3814 (the 2016 yearly opening level) followed up with a retest at channel resistance, extended from the high 1.3661. The retest, shaped by way of a shooting star candlestick pattern, could be sufficient to entice moves back to 1.3814 this week.
Daily perspective:
Monday latched onto a dominant bid off support at 1.4000, followed through on Tuesday to highs at 1.4265, a touch south of resistance at 1.4292. Mid-week lost steam, nonetheless, with Thursday revisiting 1.4000 and modestly holding into Friday.
Beneath 1.4000, aside from the 1.3855 April 13 low, support exists at 1.3807, accompanied close by an ABCD (red arrows) correction at 1.3766. Yet, above 1.4292, Quasimodo resistance at 1.4606 is seen.
H4 perspective:
Heading into the US session Friday, after having dipped from highs of 1.4114, USD/CAD gleaned support off 1.4023 and revisited 1.41 into the closing stages of the week. It should be noted April’s opening level also resides close by at 1.4093.
The river north of 1.41 appears relatively ripple free to 1.42, closely followed by channel resistance, drawn from the high 1.4349, whereas the key figure 1.40 is seen to the downside (which also represents daily support).
Areas of consideration:
Weekly price fading channel resistance by means of a bearish candlestick signal may weaken upside attempts above 1.41 this week. The flip side to this, of course, is we are coming off daily support from 1.4000 which may give weekly sellers a run for their money and attempt to conquer 1.41.
Traders, therefore, will likely be watching 1.41 closely in early trade this week for signs of bullish/bearish intent. Targets either side of 1.41 are highlighted above in bold.
Breaking 1.40 to the downside may also be interpreted as a bearish signal this week, with scope to approach H4 Quasimodo support at 1.3953 as an initial target.
USD/CHF:
Weekly gain/loss: +0.59%
Weekly close: 0.9724
Weekly perspective:
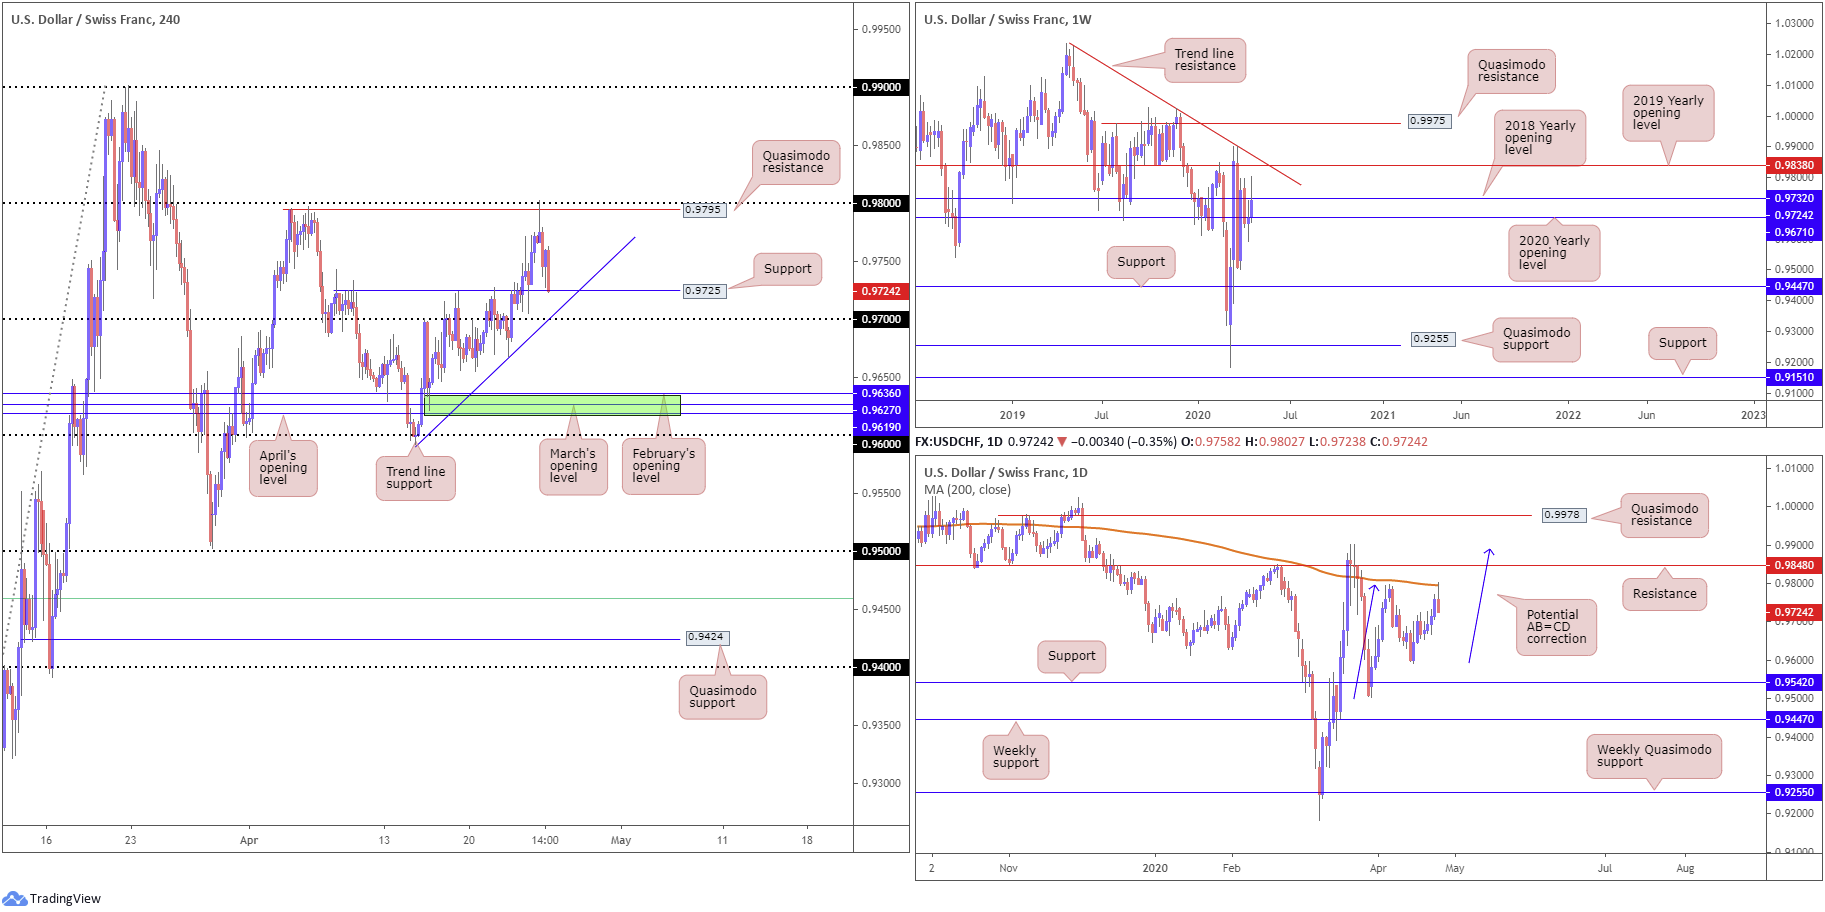
Last week saw a brief flicker of activity around highs at 0.9802 before withdrawing to a touch south of the 2018 yearly opening level at 0.9732 by the close. The move higher, however, has unmasked the 2019 yearly opening level at 0.9838 and trend line resistance, taken from the high 1.0226.
Should we continue on the defensive this week, the 2020 yearly opening level at 0.9671 could make a showing.
Daily perspective:
Four out of five days ended in positive territory last week, with Friday the exception after grasping the 200-day SMA (orange – 0.9795). Despite Friday’s rejection, traders are urged to pencil in resistance at 0.9848 and a potential AB=CD correction (blue arrows) at 0.9886 in case of moves higher this week.
Lower on the curve, aside from the 0.9592 April 15 low, we have support priced in at 0.9542, situated just ahead of weekly support at 0.9447.
H4 perspective:
Going into the early stages of London on Friday, USD/CHF went back to playing on the defensive after crossing swords with 0.98/Quasimodo resistance at 0.9795. Candlestick analysis shows the rebound fashioned a shooting star pattern, which encouraged a wave of selling during London/US trade, testing support at 0.9725 by the close.
Although the said support may witness bulls reassert their dominance, pencilling in trend line support, extended from the low 0.9592, and the 0.97 handle could be an idea in the event we explore lower ground. Beyond these structures, limited demand is seen until reaching 0.9619-0.9636 (green), an area made up of April, March and February’s opening levels.
Areas of consideration:
With the 200-day SMA elbowing its way into the spotlight Friday and weekly price closing the week out beneath the 2018 yearly opening level at 0.9732, a move to the 2020 yearly opening level at 0.9671 is potentially on the cards. This, of course, places a question mark on H4 support at 0.9725 and the 0.97 handle/trend line support.
Unfortunately, even a breakout beneath 0.97 is unlikely to draw much movement, having to contend with the possibility of weekly buyers entering from 0.9671 – that’s less than 30 pips of room to play with.
As of current price, neither a long nor short appears attractive.
Dow Jones Industrial Average:
Weekly gain/loss: -2.05%
Weekly close: 23766
Weekly perspective:
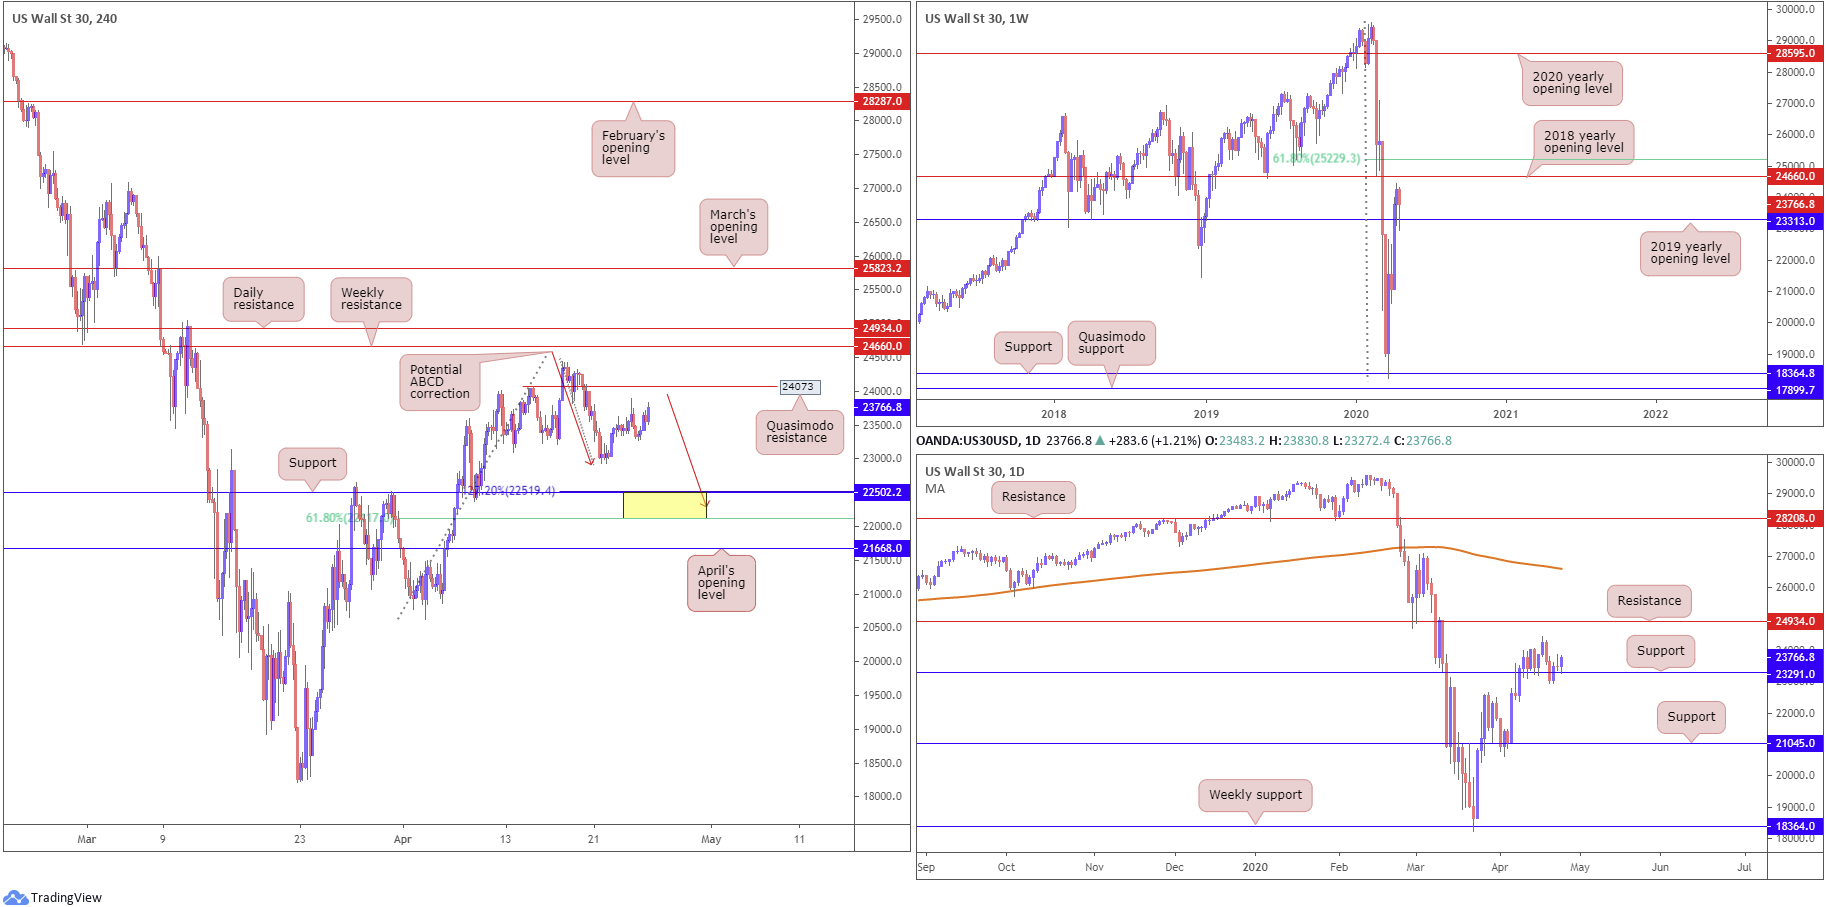
Support, via the 2019 yearly opening level at 23313, entered play in recent trading, supplying a reasonable ‘floor’ into the close. Resistance, in the form of the 2018 yearly opening level at 24660, stands out this week, with a break unmasking a 61.8% Fibonacci retracement ratio at 25229.
South of 23313, however, reveals limited support until reaching 18364.
Daily perspective:
Price action on the daily timeframe had support at 23291 nudge its way back into the limelight last week, withstanding a dominant downside attempt last Tuesday to lows at 22934.
Resistance may emerge off the 24442 April 17 high this week, with a break uncovering resistance priced in at 24934, while tunnelling through the current support could invite an approach to support at 21045.
H4 perspective:
US equity indexes finished higher Friday, though recorded weekly losses across the board, as investors digested corporate earnings and COVID-19 developments. The Dow Jones Industrial Average added 260.01 points, or 1.11%; the S&P 500 gained 38.94 points, or 1.39%, and the tech-heavy Nasdaq 100 concluded higher by 145.11 points, or 1.68%.
Quasimodo resistance at 24073 remains a focal point on the H4 timeframe as we move into the final week of April, with a break exposing the 2018 yearly opening level mentioned above on the weekly timeframe at 24660 and daily resistance at 24934. A rotation lower this week, however, could see last Tuesday’s low call for attention at 22934, followed by support at 22502, which comes together with a potential 127.2% ABCD (red arrows) approach at 22519 and a 61.8% Fibonacci retracement at 22117 (yellow).
Areas of consideration:
In the event we pop higher, as the higher timeframes suggest, selling H4 Quasimodo resistance at 24073 could be fragile, with the possibility of a move north materialising. This highlights potential buying opportunities north of 24073, targeting the noted higher-timeframe resistances (bold).
Moves lower, however, could eventually see the H4 support zone at 22117/22519 enter play, which by and of itself, is a reasonably strong platform in terms of reversal zones. Though do remain aware this area holds limited connection with the higher timeframes.
XAU/USD (GOLD):
Weekly gain/loss: +2.72%
Weekly close: 1727.4
Weekly perspective:
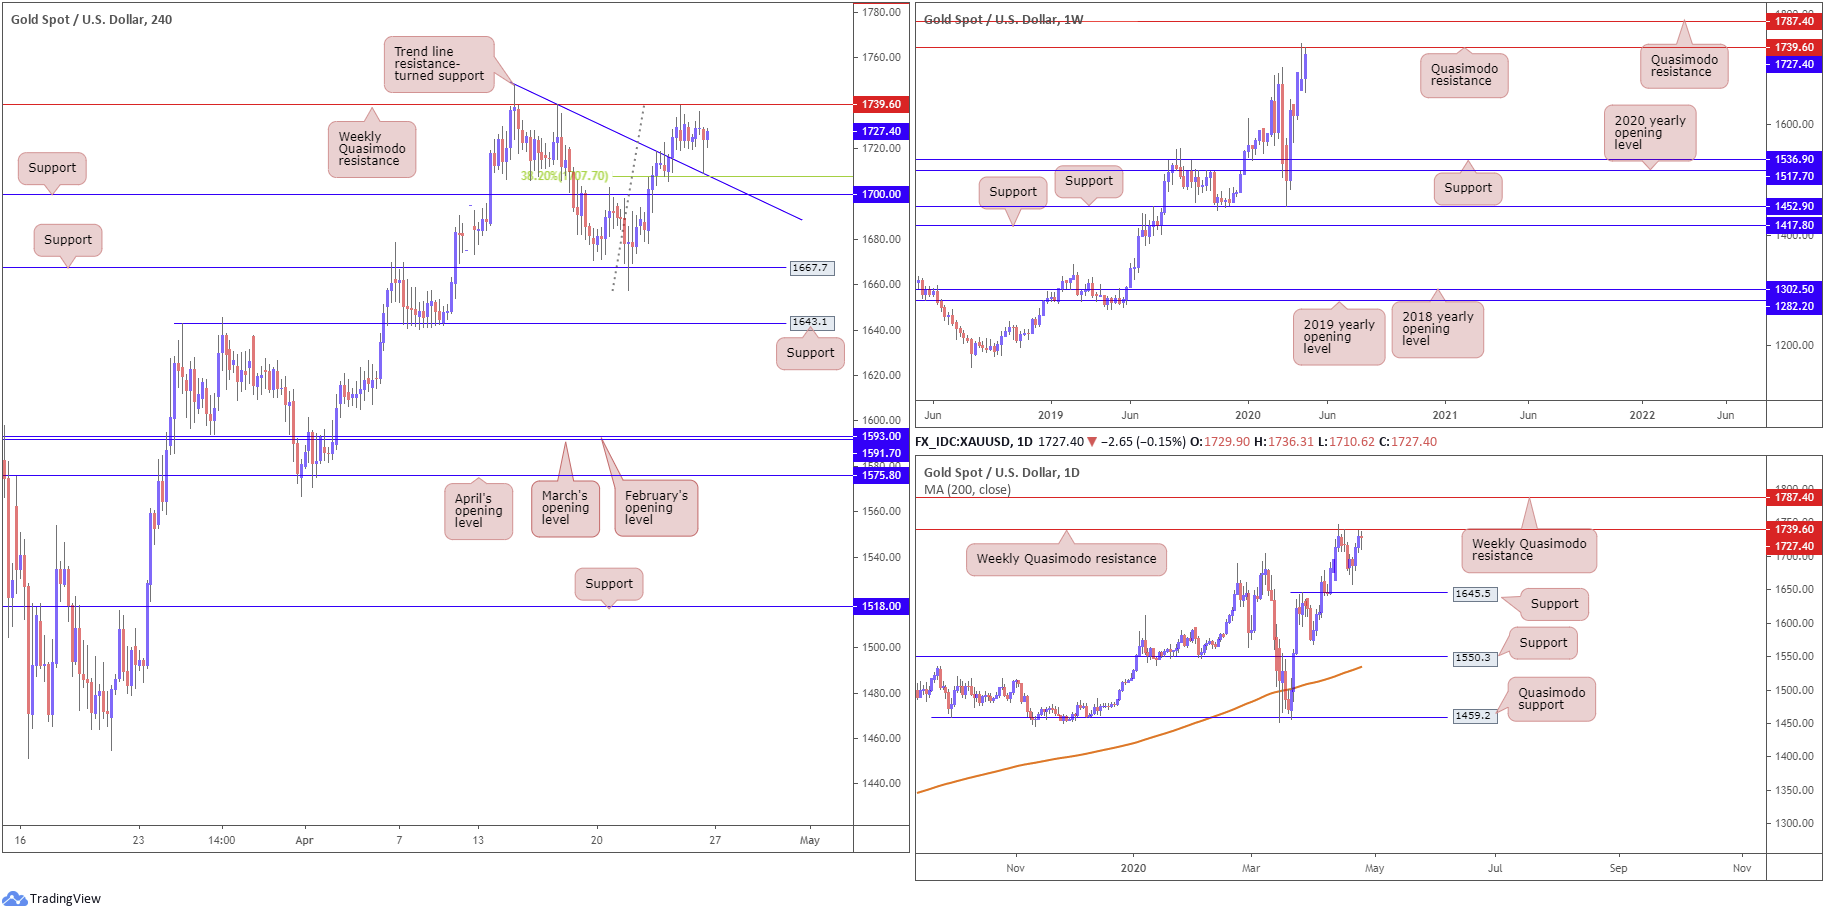
In spite of price action shaking hands with Quasimodo resistance at 1739.6 and producing a shooting star candlestick pattern (bearish signal) the week prior, bulls entered an offensive phase last week and regained control. Adding more than $45, bullion finished the week testing waters beneath 1739.6.
Should price conquer the said weekly Quasimodo, focus will likely rest on another layer of Quasimodo resistance coming in at 1787.4.
Daily perspective:
In similar fashion to the weekly timeframe, price is testing Quasimodo resistance at 1739.6, with a break identifying Quasimodo resistance at 1787.4. The only difference between the weekly and daily timeframes, according to our chart studies, is support. Daily support can be seen around 1645.5, assuming we can overthrow last Tuesday’s low at 1658.1, whereas on the weekly timeframe, obvious support is limited until reaching 1536.9.
H4 perspective:
Intraday activity on the H4 timeframe witnessed a modest pullback emerge to lows at 1708.9, one which shook hands with a trend line resistance-turned support, etched from the high 1747.7, sited just ahead of a 38.2% Fibonacci retracement ratio at 1707.7 and another layer of support at 1700.0. Candlestick traders will also note the pullback produced a hammer pattern, a sign of strength to the upside.
Areas of consideration:
The hammer candlestick pattern on the H4 timeframe, coupled with a strong underlying gold bid on the week and lack of selling interest Friday, could witness a break of the weekly Quasimodo resistance at 1739.6 this week, highlighting the possibility of a run to the weekly Quasimodo resistance at 1787.4.
Conservative traders are unlikely to enter long until at least a H4 close above 1739.6 is seen.
The accuracy, completeness and timeliness of the information contained on this site cannot be guaranteed. IC Markets does not warranty, guarantee or make any representations, or assume any liability regarding financial results based on the use of the information in the site.
News, views, opinions, recommendations and other information obtained from sources outside of www.icmarkets.com.au, used in this site are believed to be reliable, but we cannot guarantee their accuracy or completeness. All such information is subject to change at any time without notice. IC Markets assumes no responsibility for the content of any linked site.
The fact that such links may exist does not indicate approval or endorsement of any material contained on any linked site. IC Markets is not liable for any harm caused by the transmission, through accessing the services or information on this site, of a computer virus, or other computer code or programming device that might be used to access, delete, damage, disable, disrupt or otherwise impede in any manner, the operation of the site or of any user’s software, hardware, data or property.


