
Key risk events today:
German Ifo Business Climate; G7 Meetings; US Core Durable Goods Orders m/m and US Durable Goods Orders m/m; FOMC Member Bullard Speaks; UK banks are closed in observance of the Summer Bank Holiday.
EUR/USD:
Weekly gain/loss: +0.43%
Weekly close: 1.1137
Weekly perspective:
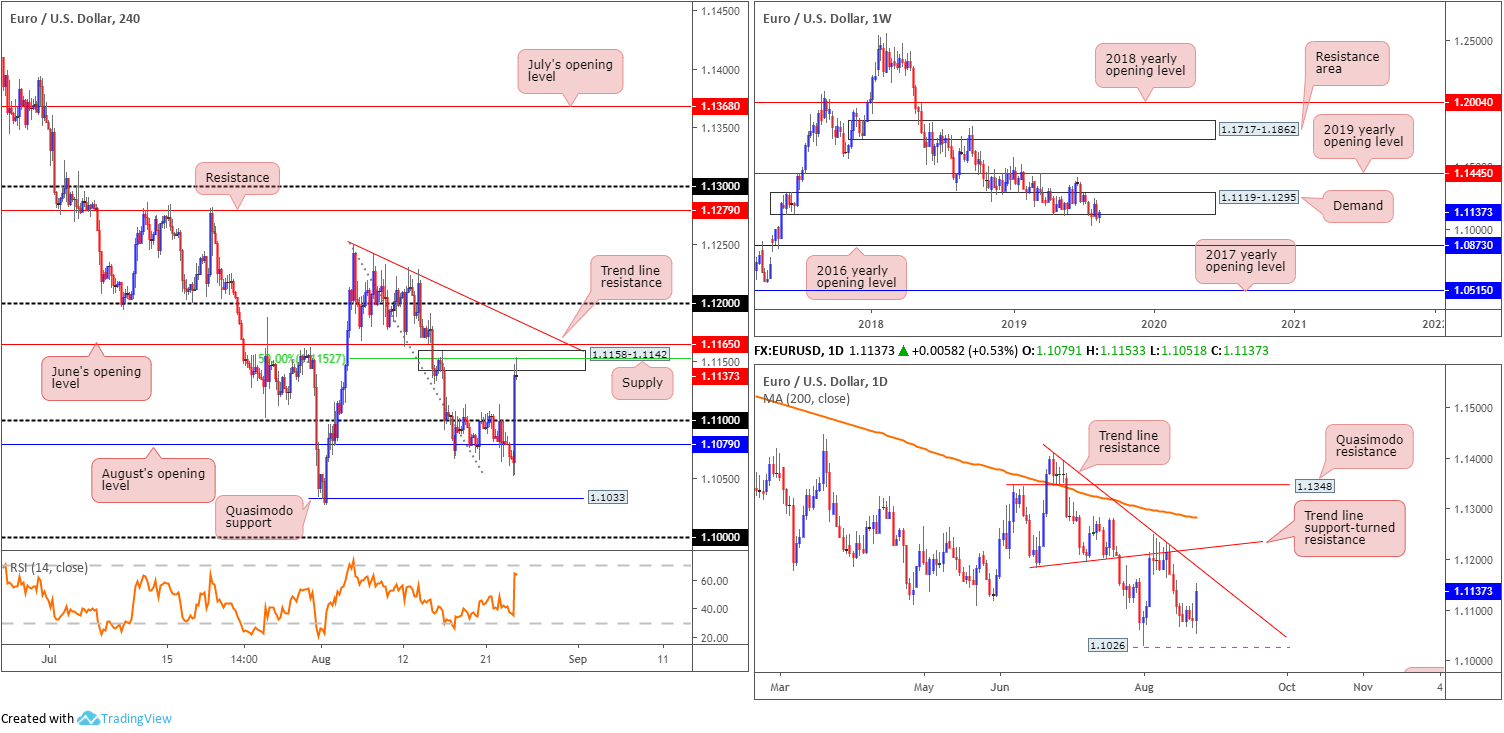
Long-standing demand at 1.1119-1.1295 remains delicate, as sell stops continue to fill beneath its boundary. Although concluding the week in mildly firmer territory, additional downside is the favoured route. Continued selling could eventually see the unit knock on the 2016 yearly opening level’s door at 1.0873, which houses strong historical significance.
In addition to the above, since topping in early 2018, the long-term trend remains pointing in a southerly bearing.
Daily perspective:
Aside from Friday’s ascent, closing in the shape of an engulfing candlestick formation (considered a bullish signal), the week entered a consolidative phase ranging no more than 45 points.
Neighbouring resistance on tap this week is visible by way of a trend line resistance (etched from the high 1.1412), shadowed closely by another layer of trend line resistance (prior support) extended from the low 1.1181 and then the 200-day SMA (orange – currently circulating around 1.1283). To the downside, support resides at 1.1026, the 2019 low, followed by demand (not visible on the screen) at 1.0851-1.0950.
H4 perspective:
The US dollar fell sharply across the board Friday amid trade escalations between the US and China. Beijing announced it was slapping tariffs on $75bln of US goods at rates between 5% and 10% in response to the US’ moves to apply tariffs on China in September and December. The announcement was unexpected, consequently spurring risk-off moves across asset classes.
Shortly after, US President Trump, via Twitter, stated ‘we do not need China, we are better off without them’. Trump also went on to write he will be responding to China’s Tariffs and ordered American companies to look for an alternative to China.
The H4 candles overthrew August’s opening level at 1.1079 and the 1.11 handle to the upside, paving the runway towards supply at 1.1158-1.1142. Not only is this area fresh, it houses a 50.0% retracement value within at 1.1527 and held price action lower in the shape of a shooting star candlestick formation (considered a bearish signal). Beyond here, traders’ crosshairs are likely fixed on June’s opening level nearby at 1.1165 and trend line resistance taken from the high 1.1249.
Areas of consideration:
Two potential selling opportunities are in the offing today/early week, according to our chart studies:
- The first is a selloff from the current H4 supply on the back of Friday’s shooting star pattern, targeting 1.11 as the initial port of call. Entry at current price is an option, with a protective stop-loss order plotted above either the H4 supply edge (1.1158), or, more conservatively, above the H4 trend line resistance.
- The second area of interest is the said H4 trend line resistance, owing to it aligning with the daily trend line resistance (1.1412). Entry at the H4 trend line is an idea, though due to 1.12 potentially acting as a magnet from here it may be best to wait for additional candlestick confirmation to form before pulling the trigger (entry and risk can then be set according to this structure).
GBP/USD:
Weekly gain/loss: +1.16%
Weekly close: 1.2282
Weekly perspective:
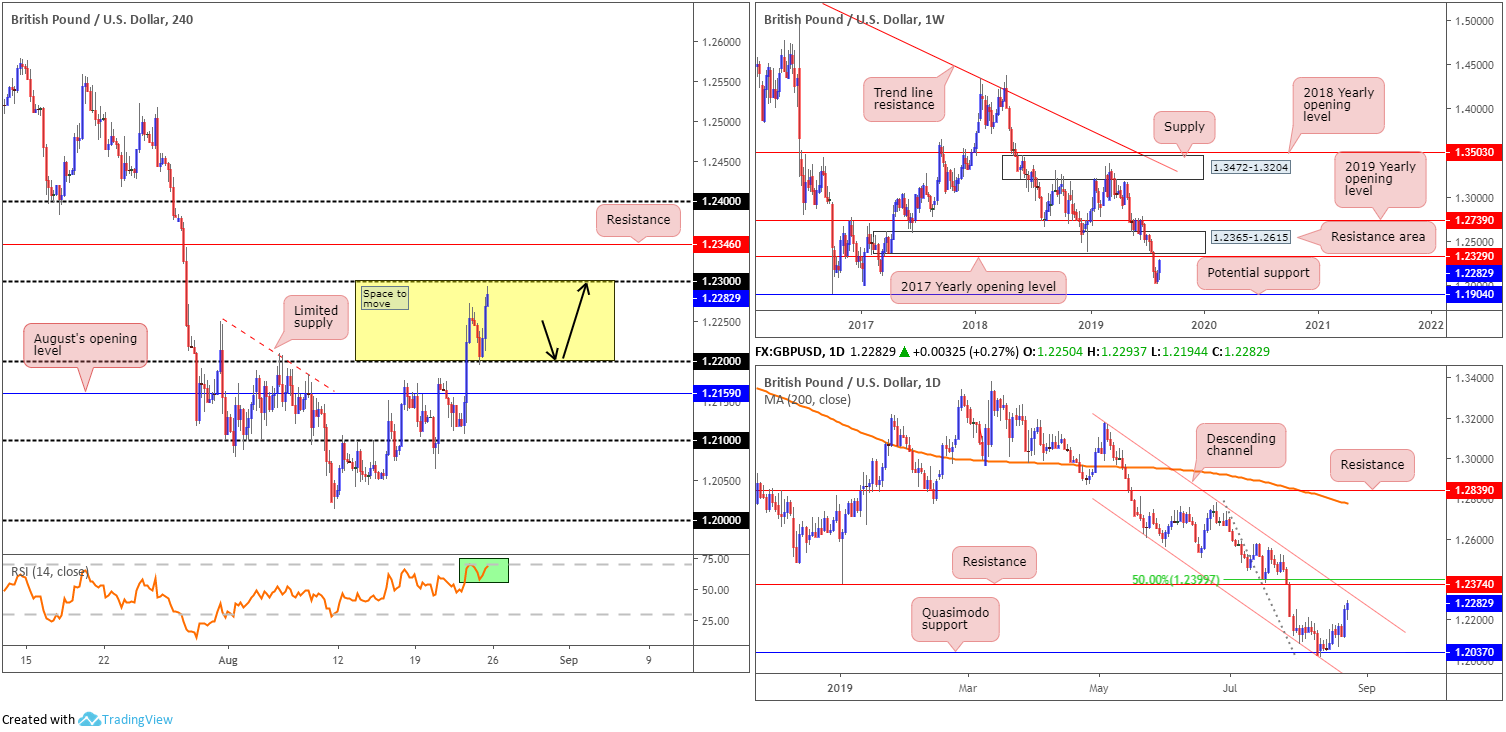
UK’s pound wrapped up firmer against the US dollar for a second consecutive week, adding more than 140 points. Poised to approach the 2017 yearly opening level at 1.2329 (resistance), set a couple of points south of a major resistance area at 1.2365-1.2615, further upside could be in store this week, at least until the said resistances enter the fold, at which point sellers are expected to make an appearance.
Daily perspective:
Following a shaky start off Quasimodo support at 1.2037 and its merging channel formation taken from the low 1.2605, the pair changed gears last week and explored higher ground.
Scope for additional upside this week is certainly plausible, though do remain cognisant of resistance at 1.2374, closely intersecting with channel resistance (etched from the high 1.3176) and a 50.0% retracement ratio at 1.2399.
H4 perspective:
For those who read Friday’s technical briefing you may recall the following:
Recent bidding found the H4 candles sniffing out fresh monthly highs at 1.2272 after unseating August’s opening level at 1.2159 and the 1.22 handle. While indicator-based traders will note the RSI entering overbought territory (green), price action exhibits scope to press to 1.23 and then resistance at 1.2346.
Having seen all three timeframes sport potential to gravitate higher, the backbone of today’s focus is on longs, preferably on a retest motion at 1.22 (black arrows) shaped by way of a H4 bullish candlestick signal (entry and risk can then be set according to this structure). The primary take-profit target is found at 1.23, followed by the daily channel resistance and the 2017 yearly opening level mentioned above at 1.2329 on the weekly scale and then H4 resistance at 1.2346.
On the back of USD weakness amid trade concerns between the US and China, the pair retested 1.22 Friday and rotated strongly higher, ending the session a few points south of 1.23. Despite the H4 candles not chalking up much in terms of a bullish candlestick signal, well done to any of our readers who managed to jump aboard the move.
Areas of consideration:
Current longs have 1.23 in sight as the initial upside target, an ideal location to reduce risk to breakeven and liquidate at least 50% of the position. Following this, focus shifts to the next upside hurdles underlined above in bold.
AUD/USD:
Weekly gain/loss: -0.38%
Weekly close: 0.6748
Weekly perspective:
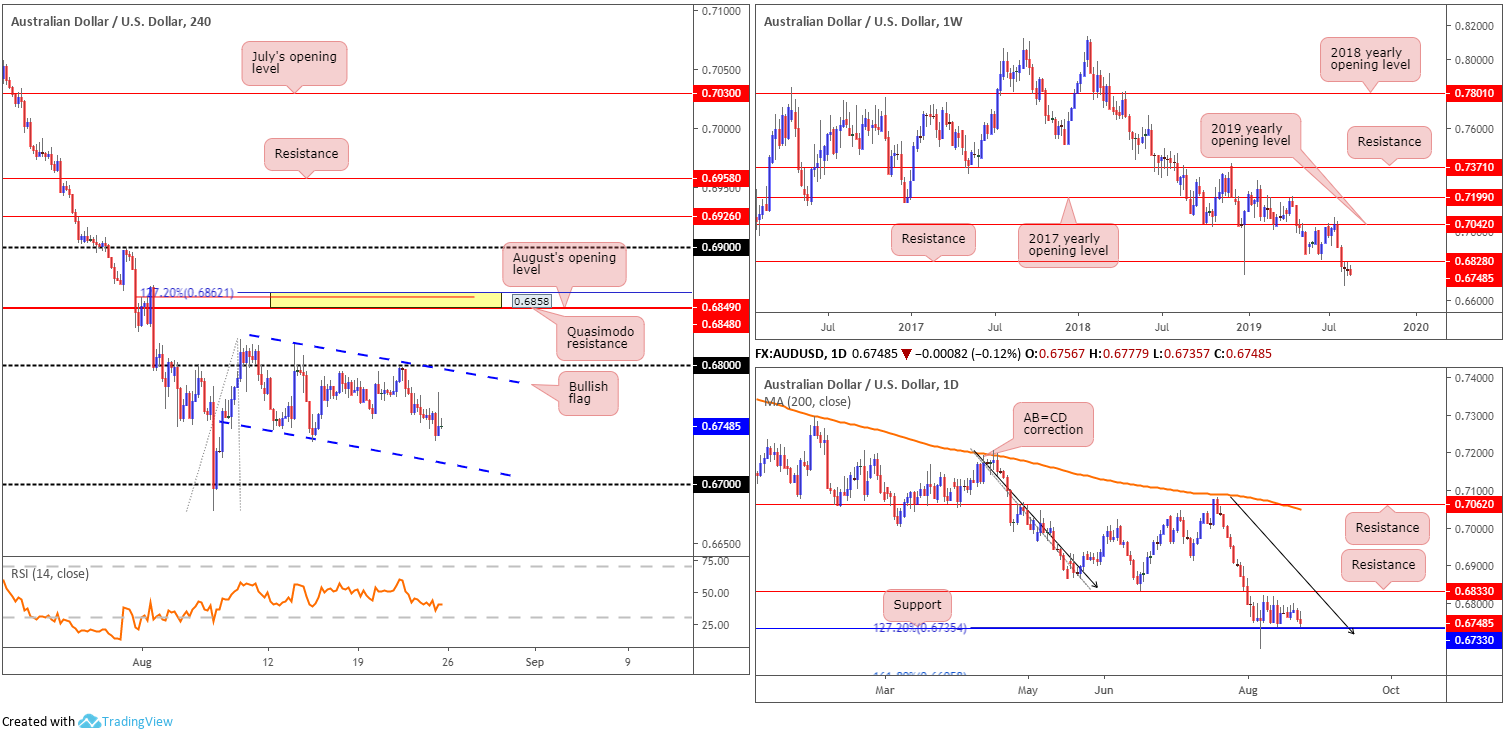
The end of July witnessed the unit slip beneath notable support at 0.6828, now a serving resistance. The following two weeks were colourless, organised as back-to-back indecision candles, with last week’s session also not really doing much to turn the dial.
The long-term downtrend, intact since the beginning of 2018, remains unbroken, with further selling likely on the cards as the next support is not visible until 0.6395 on this timeframe (not seen on the screen).
Daily perspective:
Since elbowing beneath weekly support mentioned above at 0.6828, support at 0.6733 on the daily timeframe, along with a 127.2% AB=CD (black arrows) formation at 0.6735, entered the fray and held things higher. Despite this, the pair remains deeply in bearish territory and does not appear to have the firepower to cross swords with resistance at 0.6833 (June 18 low).
H4 perspective:
Latest trade developments between the US and China dampened risk appetite, driving flows away from perceived riskier currencies Friday, such as the Australian dollar, down 0.12% against the buck.
For traders who read Friday’s technical briefing you may recall the piece had the following to say concerning H4 structure:
Gains remain contained beneath 0.68 on the H4 scale, and compressing within a bullish flag formation (0.6817/0.6745). Flags typically slope in the opposite direction from the trend, which is clearly not the case here but may still form part of a correction move if we break higher, or even signify early signs of a longer-term trend breakout. Beyond 0.68, a close-fitting area of resistance (yellow) resides between a 127.2% Fibonacci ext. point at 0.6862, a Quasimodo resistance at 0.6858 and August’s opening level at 0.6848.
Areas of consideration:
Although the take-profit target for the H4 bullish flag configuration will come in higher (typically calculated based on the value of the preceding move and added to the breakout point), overlooking H4 resistance at 0.6862/0.6848 is chancy. Further to this, traders may also want to acknowledge that between 0.68 and the aforesaid H4 resistance zone, daily resistance at 0.6833 and weekly resistance at 0.6828 is in view. On account of the above, the research team feel longs above the current H4 flag formation/0.68 are challenging.
The H4 channel support extended from the low 0.6745, the lower limit of the current H4 flag formation, remains a possible platform for longs today/early this week, owing to it converging closely with daily support at 0.6733. Waiting for a H4 bullish candlestick signal to form before pulling the trigger is highly recommended, however, since weekly direction faces a southerly bearing, both structurally and in terms of trend.
The yellow H4 area of resistance between 0.6862/0.6848 is also an area still worthy of consideration this week. Granted, while this zone is a touch above higher timeframe-resistance, a fakeout above these levels (likely flushing out greedy buy stops) to the said H4 zone is a strong possibility if we break 0.68. Entry at 0.6848 is, therefore, valid, with a tight protective stop-loss order plotted above 0.6862, but if you prefer waiting for additional confirmation, a bearish candlestick pattern would suffice.
USD/JPY:
Weekly gain/loss: -0.93%
Weekly close: 105.35
Weekly perspective:
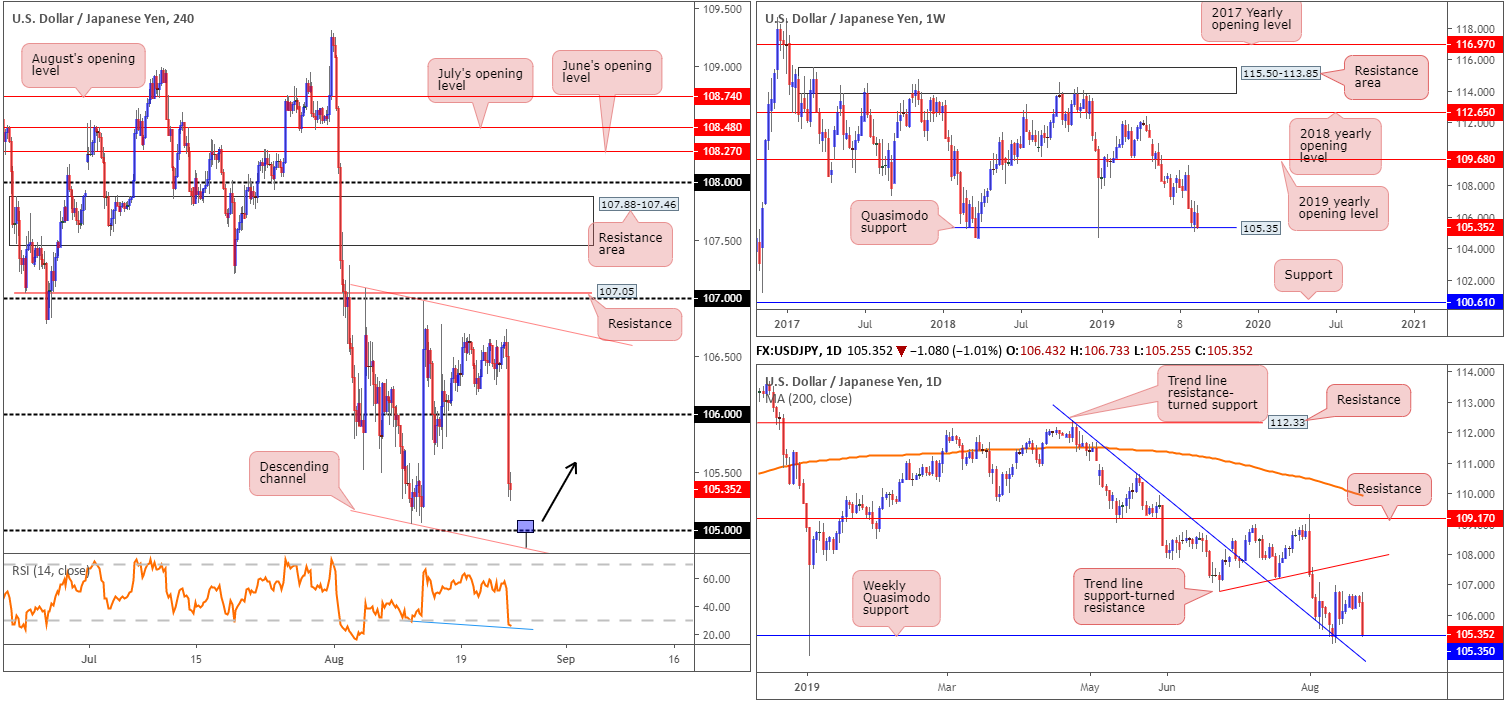
Quasimodo support at 105.35 – a level that proved its worth by holding the unit higher at the beginning of the year – lacks impetus at the moment. The prior week’s recovery was encouraging, breaking a two-week bearish phase. This was a short-lived move, unfortunately, as price swiftly pared recent gains last week.
Outside of this base, limited support is evident until 100.61, whereas a push north has the 2019 yearly opening level at 109.68 to target.
Daily perspective:
Beyond the weekly Quasimodo support, daily traders likely have a trend line resistance-turned support (pencilled in from the high 112.40) on the radar. Elbowing through this support line, however, has Quasimodo support at 102.55 to target (not visible on the screen).
H4 perspective:
Escalating trade pressures between the US and China prompted a flight to safety Friday, increasing demand for safe-haven assets, including the Japanese yen, Swiss franc and gold. China announced plans to impose tariffs on $75 billion worth of US goods as a retaliatory measure.
USD/JPY activity rolled into negative territory amid US hours, clearing orders at the 106 handle and exposing the 105.05 August 12 low as probable support this week, closely shadowed by 105 and channel support drawn from the low 105.05. Indicator-based traders may also wish to acknowledge the RSI is currently chalking up positive hidden divergence out of oversold territory (blue line).
Areas of consideration:
Although countertrend, a rebound from the 105 neighbourhood on the H4 scale may materialise this week. Triggering sell stops beneath the 105.05 August 12 low along with a whipsaw through 105 to the H4 channel support meandering nearby will help provide liquidity to buy into. Therefore, an ideal scenario would be for H4 price to fakeout beneath 105 in the shape of a bullish candlestick formation (visual representation of a hammer formation drawn). This way, not only have you identified buyer intent, you can also base entry and risk levels on the said candlestick structure.
Reducing risk to breakeven upon H4 flow closing back above 105.35 (weekly support) is certainly an option, with the first upside target set around the 105.50 region (green arrows support-turned resistance).
USD/CAD:
Weekly gain/loss: +0.15%
Weekly close: 1.3285
Weekly perspective:
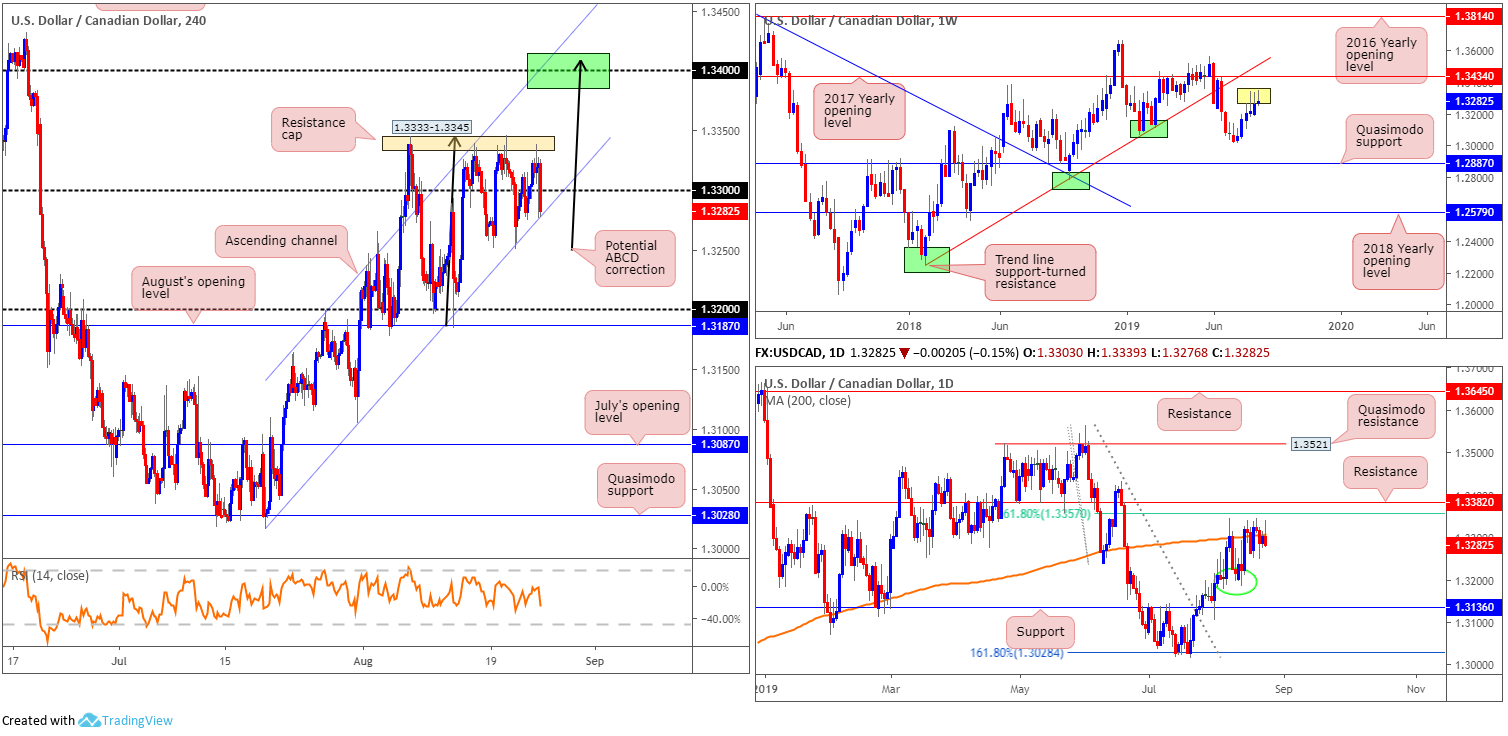
Since the beginning of the month, longer-term movement has been lethargic, shaped in the form of back-to-back selling wicks (yellow). Although considered a sign of healthy rejection, the unit exhibits scope to approach the 2017 yearly opening level at 1.3434, closely shaded by trend line support-turned resistance pencilled in from the low 1.2247.
Should we turn lower and leave the said resistances unchallenged, traders’ focus will likely be on the 1.3016 July 15 low, followed by Quasimodo support at 1.2887.
Daily perspective:
Focus on the daily timeframe remains centred around the 200-day SMA (orange at 1.3307), traced closely by a 61.8% Fibonacci resistance at 1.3357 and resistance at 1.3382. While downside has local support concentrated around 1.3190, the more prominent support falls in a touch lower at 1.3136 (green circle).
H4 perspective:
Data published by Statistics Canada showed retail sales remained unchanged on a monthly basis in June following May’s 0.2% decline, and beat market consensus for a fall of 0.1%, consequently lifting the Canadian dollar. The big story of the day, however, was escalating trade tensions between the two main economies of the world, China and the US. Beijing announced it was slapping tariffs on $75bln of US goods at rates between 5% and 10% in response to the US’ moves to apply tariffs on China in September and December. Trade-sensitive oil prices fell sharply in response, with WTI erasing more than 2.7% and nudging beneath $54/bbl.
Since August 15, the H4 candles have been fluctuating between gains/losses around 1.33, though remains compressing within an ascending channel formation (1.3015/1.3199). Overhead, price exhibits scope to approach channel resistance and 1.34 (green). What’s also notable from a technical perspective is a possible ABCD correction (black arrows), terminating a shade above 1.34. A breach of the current channel support, nonetheless, may put a test of 1.32 in view, closely trailed by August’s opening level at 1.3187. Note this area has offered strong support/resistance since late July.
Areas of consideration:
Additional buying, according to the weekly timeframe, is a possibility until we reach 1.3434. Therefore, daily resistances mentioned above at 1.3307, 1.3357 and 1.3382 may give way this week.
A method of verifying buyer intent is on the back of a H4 close above the resistance cap at 1.3333-1.3345, perhaps unbolting the door towards channel resistance/1.34, and possibly 1.3434. In the event this comes to fruition, a long is an option, either on the back of the breakout candle’s structure, or on a possible retest motion. In any case, using the candlestick structure to base entry and risk levels from is likely the method of choice for many traders here.
USD/CHF:
Weekly gain/loss: -0.35%
Weekly close: 0.9744
Weekly perspective:
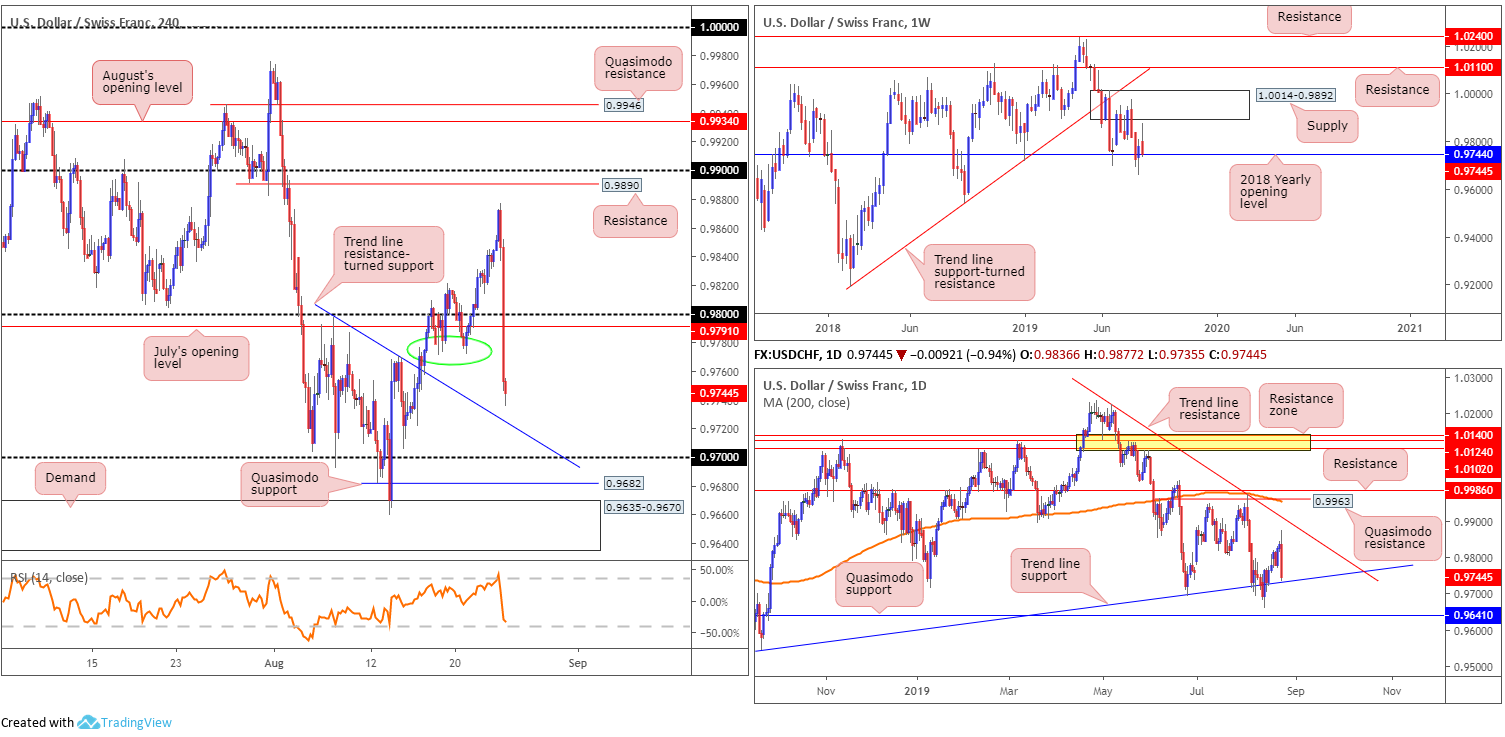
Leaving supply at 1.0014-0.9892 unchallenged, the US dollar swung lower against the Swiss franc last week, erasing more than 30 points. Interestingly, this positioned the unit at the 2018 yearly opening level drawn from 0.9744 by the close. While a rejection is expected, downside from this angle has the September 17 low at 0.9542 in range.
Daily perspective:
In conjunction with weekly support at 0.9744, trend line support on the daily timeframe (taken from the low 0.9542) is within touching distance of re-entering the fight this week. A rebound from here could lift the market to trend line resistance (extended from the high 1.0226), whereas continued selling has Quasimodo support eyed at 0.9641.
H4 perspective:
The USD/CHF sunk to 1-week lows Friday amid risk aversion, driving flows away from perceived riskier currencies. Beijing announced it was slapping tariffs on $75bln of US goods at rates between 5% and 10% in response to the US’ moves to apply tariffs on China in September and December.
In one fell swoop, the H4 candles overthrew 0.98 as well as July’s opening level at 0.9791 and clocked a low of 0.9735 into the close. The next port of call in terms of support falls in around a trend line resistance-turned support (extended from the high 0.9797), with the 0.97 handle next on tap, then Quasimodo support at 0.9682 and demand coming in at 0.9635-0.9670. Indicator-based players may also wish to note the RSI is seen fast approaching oversold terrain.
Areas of consideration:
Weekly support at 0.9744 is considerable structure, likely to prove influential over the coming week. Couple this with trend line support nearby on the daily timeframe (0.9542) and we have ourselves significant higher-timeframe confluence. The H4 trend line resistance-turned support (0.9797), therefore, provides lower-timeframe buyers a platform to consider for longs this week. However, a H4 bullish candlestick formation printed from this region is required as this helps shield against a possible fakeout to 0.99. Entry and risk parameters can be set according to the selected candlestick structure, targeting 0.9773ish as the initial upside zone (green circle).
Dow Jones Industrial Average:
Weekly gain/loss: -1.08%
Weekly close: 25629
Weekly perspective:
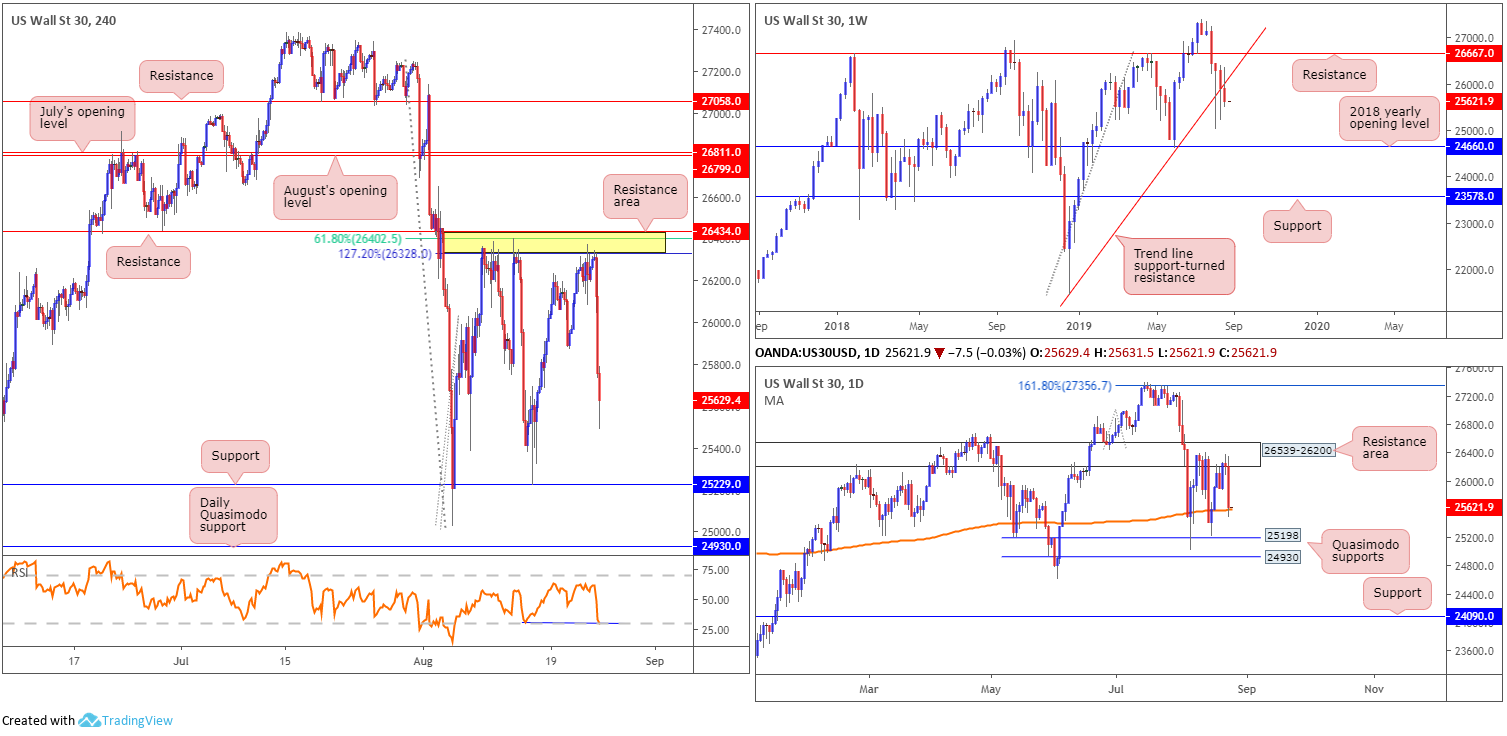
The Dow Jones Industrial Average wrapped up another week in negative terrain, down more than 280 points and sporting a four-week losing streak. Interestingly, long-term trend line support (pencilled in from the low 21452) gave way in recent movement, possibly unlatching the door for additional losses this week to depths not visited since early June 2019 at the 2018 yearly opening level drawn from 24660.
Daily perspective:
Since early August, the daily candles have been bounded by a Quasimodo support coming in at 25198 and a resistance area forged at 26539-26200. What’s notable from a technical perspective is the said resistance zone is sited just south of weekly resistance at 26667, and the week ended with the unit retreating to its 200-day SMA function (orange – 25611).
H4 perspective:
US equities plunged Friday following Beijing announcing plans to tariff $75bln of US goods. It marks the latest escalation in a damaging trade skirmish. Also pulling stocks lower was US President Donald Trump ordering US manufacturers to find alternatives to their operations in China.
The Dow Jones Industrial Average erased 623.34 points, or 2.37%; the S&P 500 declined 75.48 points, or 2.59% and the tech-heavy Nasdaq 100 lost 242.43 points, or 3.15%.
In a sign of the heightened sense of gloom, H4 flow retracted lower from a familiar resistance zone at 26434/26328 (comprised of resistance at 26434, a 127.2% Fibonacci ext. point at 26328 and a 61.8% Fibonacci retracement value at 26402). This is the third time this month the index has responded from here, once more exposing support at 25229, closely followed by daily Quasimodo support at 24930. The RSI indicator, for those who follow momentum oscillators, is also currently producing positive divergence (RSI double bottom) at the oversold value.
Areas of consideration:
Well done to any of our readers who managed to hold their shorts from the H4 resistance area at 26434/26328. With the option of reducing risk to breakeven and liquidating a portion of the position (remember we are trading at the 200-day SMA on the daily scale), the next take-profit target can be set at the H4 support registered at 25229/daily Quasimodo support at 25198, followed by daily Quasimodo support at 24930 and then possibly, with a little oomph, we could reach the 2018 yearly opening level on the weekly timeframe at 24660.
XAU/USD (GOLD):
Weekly gain/loss: +0.89%
Weekly close: 1526.7
Weekly perspective:
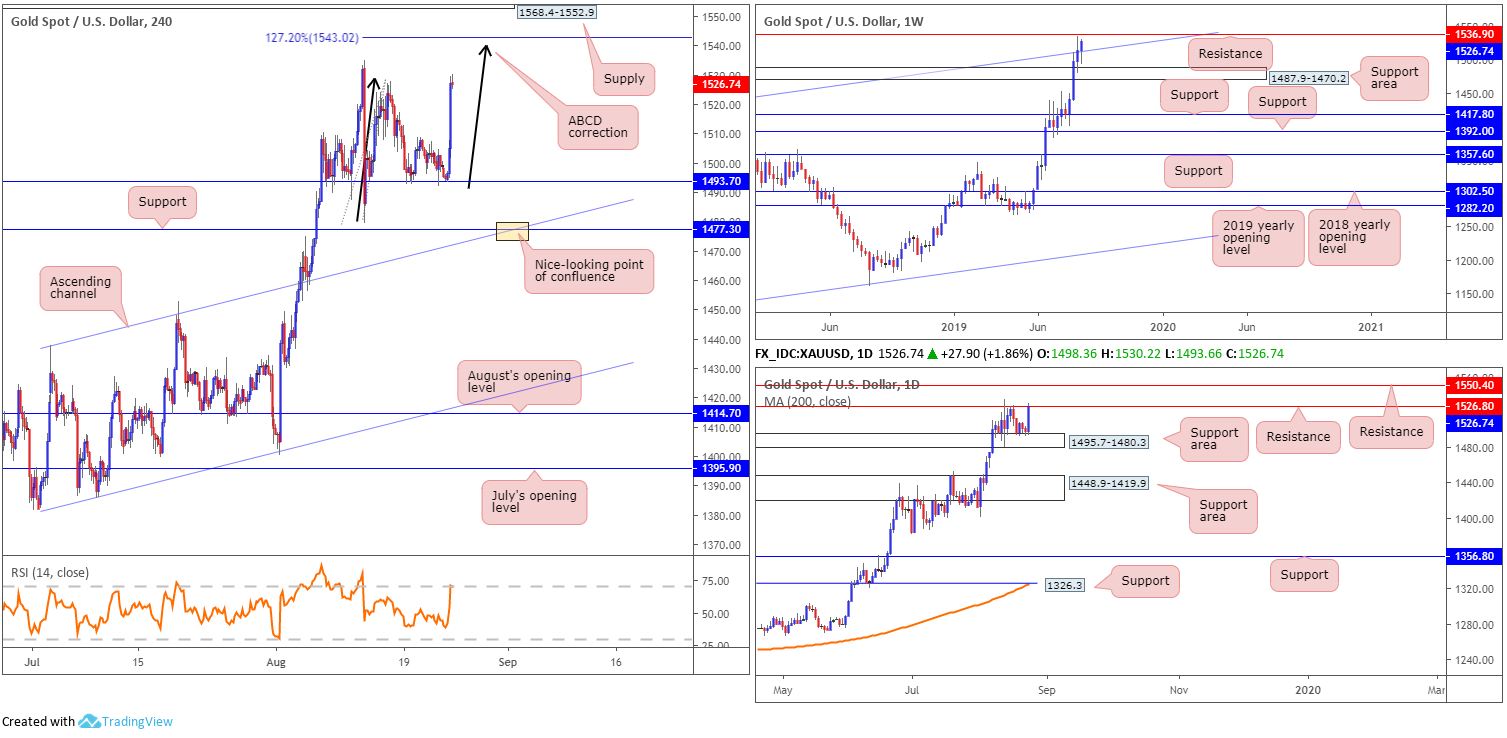
Bullion retained a strong bullish tone in recent trade, extending its winning streak to four weeks and adding more than $13 in value last week. Technicians may want to acknowledge the yellow metal engulfed channel resistance (taken from the high 1375.1) and is on course to shake hands with long-term resistance nearby at 1536.9.
Daily perspective:
The support area coming in at 1495.7-1480.3 (glued to the top edge of the weekly support area) held firm last week, spurring another wave of buying towards familiar resistance at 1526.8. Judging by the strength of the daily close, further buying could be in store towards resistance at 1550.4.
H4 perspective:
Friday’s action on the H4 timeframe staged an impressive recovery from local support 1493.7, amid increased demand for perceived safe-haven assets. Sited within the upper limit of the daily support zone mentioned above at 1495.7-1480.3, the H4 candles concluded the day on track to cross paths with a 127.2% ABCD correction (black arrows) at 1543.0, shadowed reasonably closely with supply at 1568.4-1552.9. Note also we have the RSI indicator entering overbought territory.
Areas of consideration:
Weekly resistance is a point of interest for selling opportunities this week. Although countertrend, the fact H4 price is in the process of finalising the D-leg of an ABCD correction at 1543.0 certainly adds weight to a response. However, entering without the use of additional candlestick confirmation is incredibly chancy. Not only because you’re effectively selling a strong market, but also because H4 supply could act as a magnet to price at 1568.4-1552.9, given it coincides closely with daily resistance at 1550.4. Therefore, the said H4 supply is also another option for selling opportunities this week, though traders are also urged to wait for additional candlestick confirmation before pulling the trigger. Entry/risk can be determined according to the candlestick’s structure.
In case we dip lower, the point H4 channel resistance-turned support (orange) merges with H4 support at 1477.3 is an interesting base for potential long plays this week.
The accuracy, completeness and timeliness of the information contained on this site cannot be guaranteed. IC Markets does not warranty, guarantee or make any representations, or assume any liability regarding financial results based on the use of the information in the site.
News, views, opinions, recommendations and other information obtained from sources outside of www.icmarkets.com.au, used in this site are believed to be reliable, but we cannot guarantee their accuracy or completeness. All such information is subject to change at any time without notice. IC Markets assumes no responsibility for the content of any linked site.
The fact that such links may exist does not indicate approval or endorsement of any material contained on any linked site. IC Markets is not liable for any harm caused by the transmission, through accessing the services or information on this site, of a computer virus, or other computer code or programming device that might be used to access, delete, damage, disable, disrupt or otherwise impede in any manner, the operation of the site or of any user’s software, hardware, data or property.


