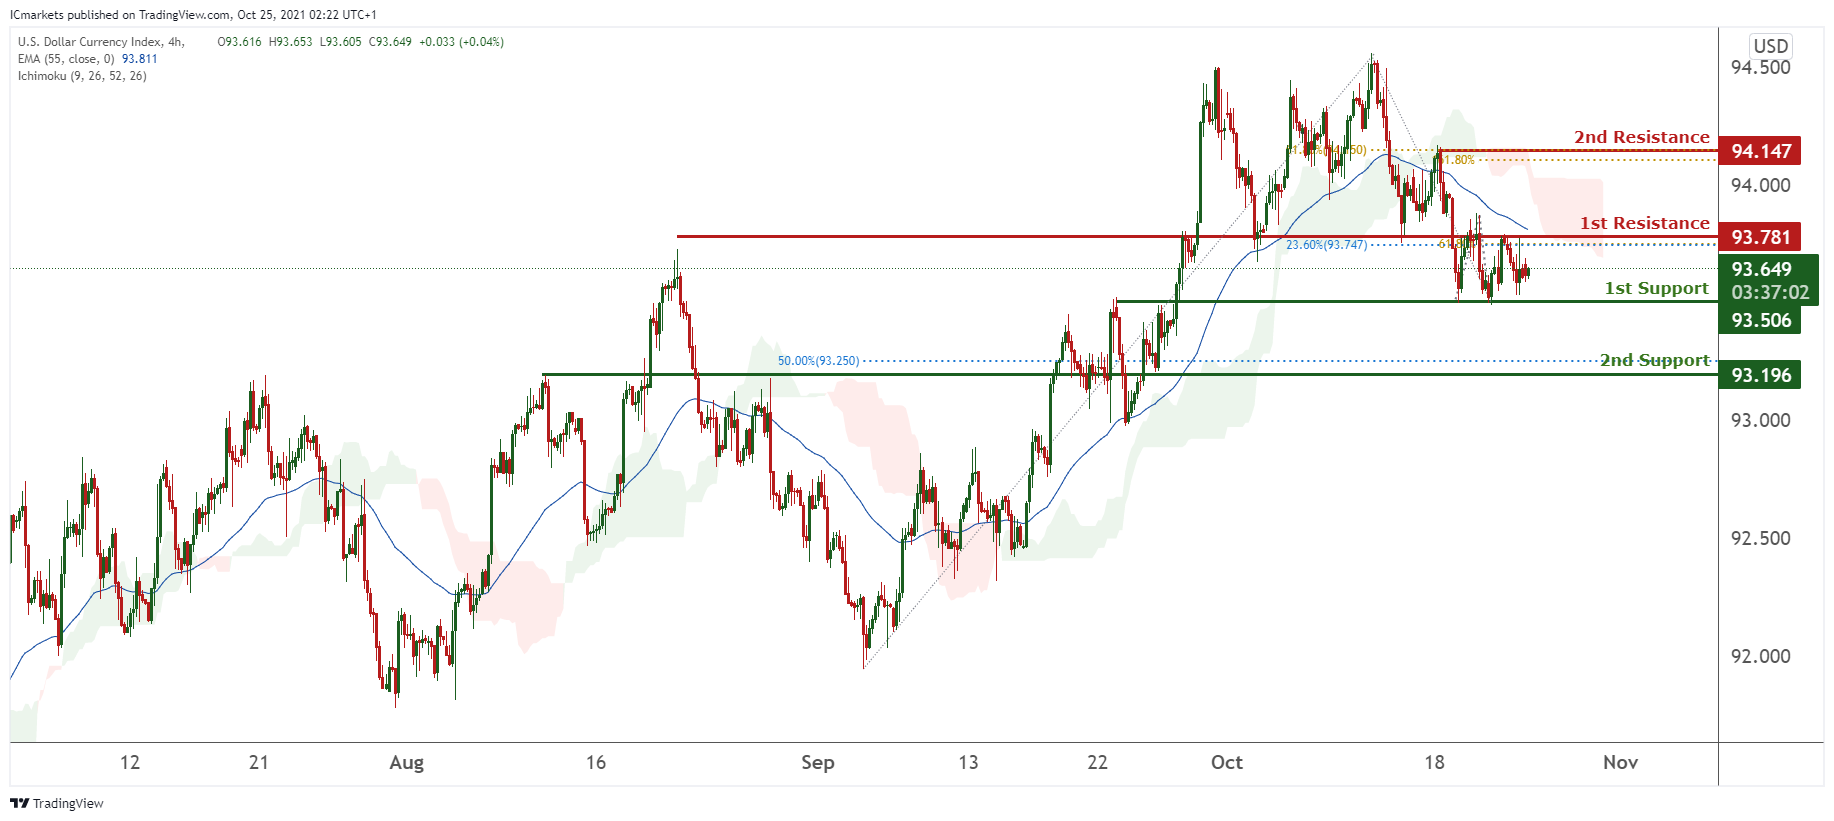
DXY:
On the H4 timeframe, prices are consolidating sideways. We see the potential for prices to dip towards our 1st support at 93.506 which is a graphical overlap. However, as technical indicators are showing mixed signals, we prefer to remain neutral for now. Alternatively, prices might climb to our 1st resistance at 93.781 in line with 23.6% Fibonacci retracement.
Areas of consideration:
- H4 time frame, 1st resistance at 93.781
- H4 time frame, 1st support at 93.506
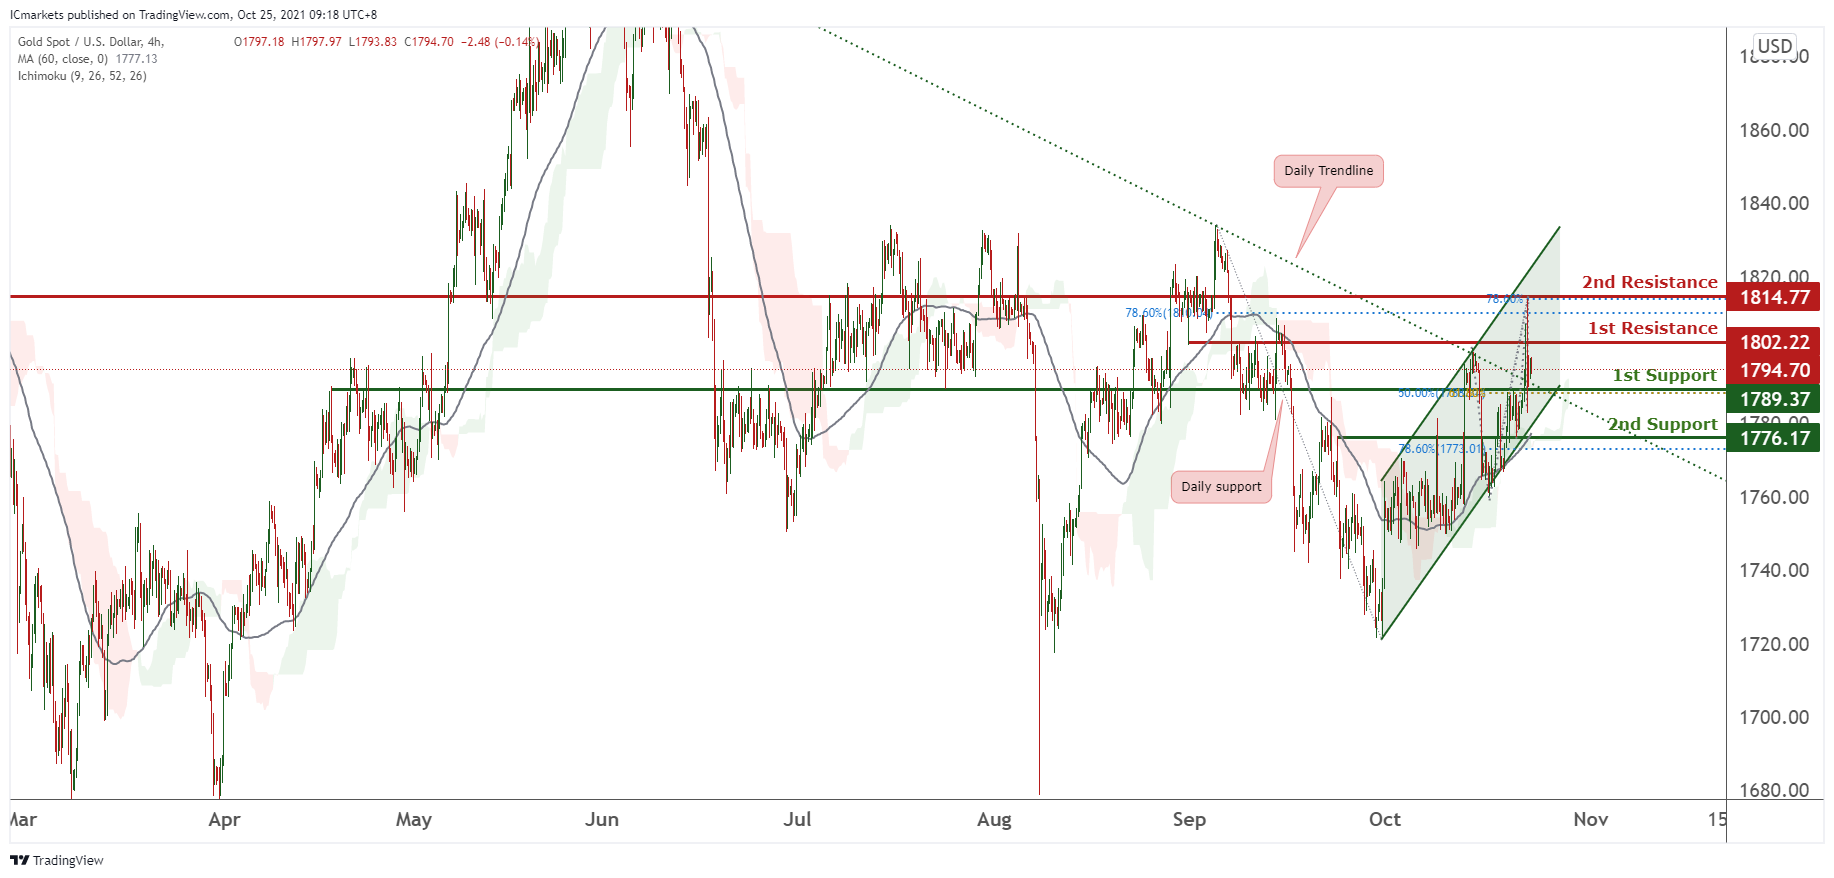
XAU/USD (GOLD):
On the H4 chart, prices have recently broken out of our bearish trendline and we see the potential for prices to retest our 1st support in line with 50% Fibonacci retracement and 61.8% Fibonacci extension and climb higher towards our 1st resistance at 1802.22 which is a graphical overlap. Technical indicators are showing bullish momentum. Alternatively, prices breaking our parallel channel might find prices dipping further towards our 2nd support at 1776.17 in line with 78.6% Fibonacci retracement.
Areas of consideration:
- 4h 1st support at 1789.37
- 4h 1st resistance at 1802.22
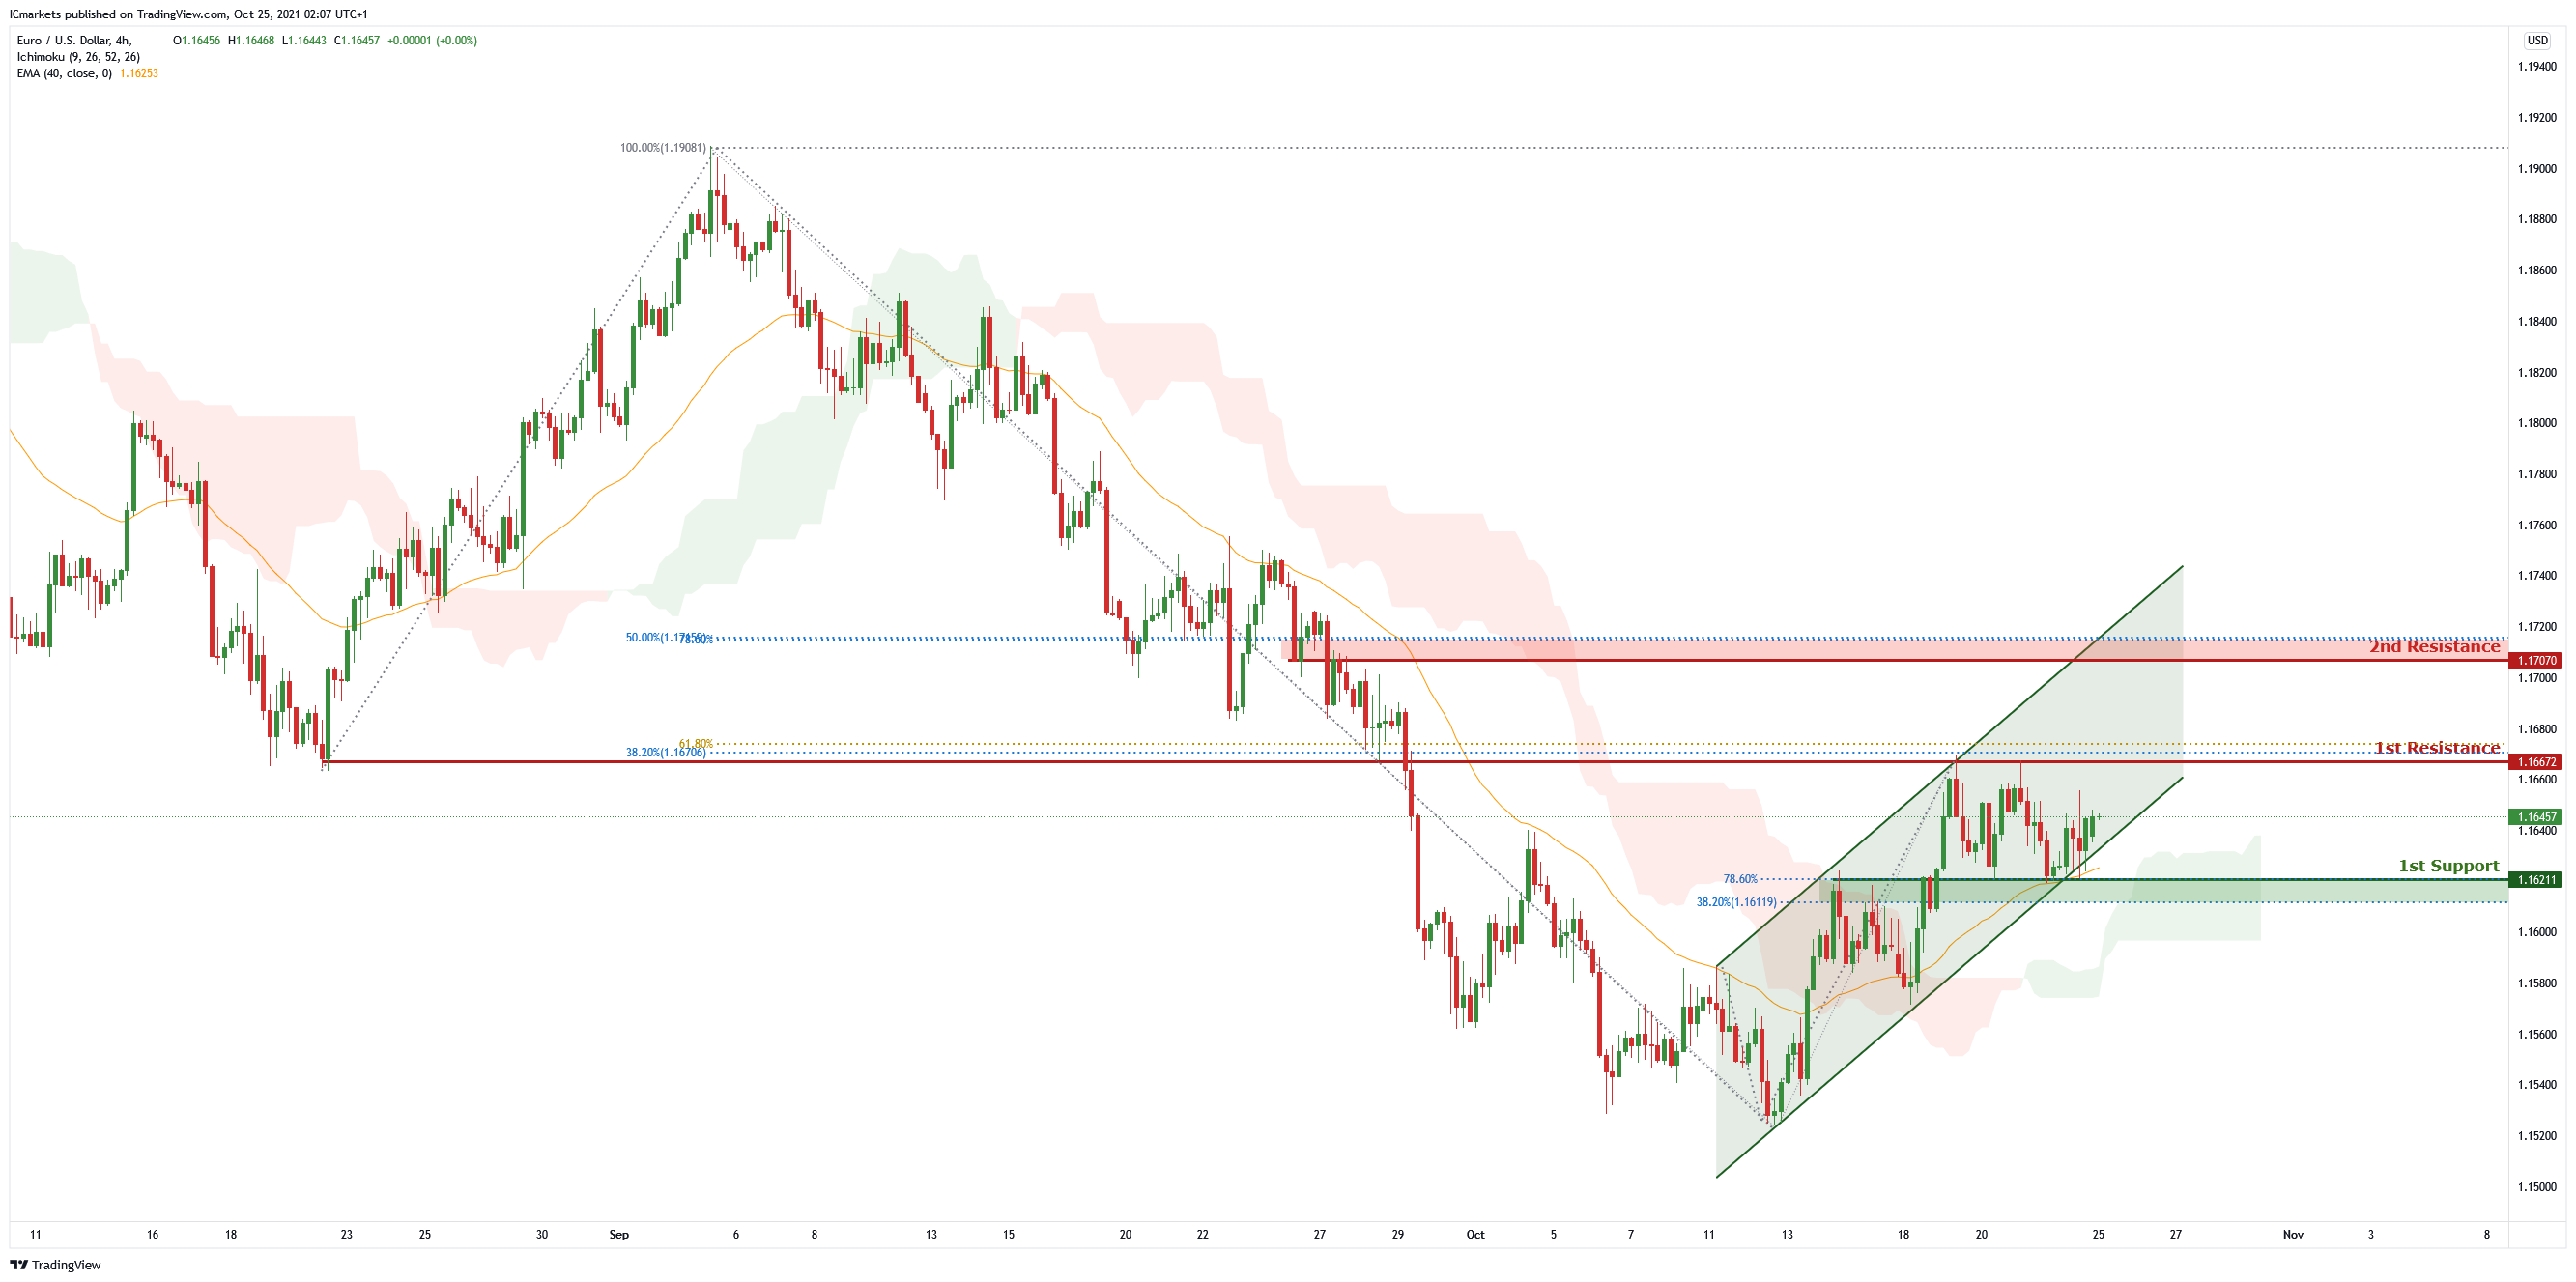
EUR/USD:
On the H4 chart , price is trading in an ascending channel and has recently bounced from 1st support of 1.16211 which is also 78.6% Fibonacci projection and 38.2% Fibonacci retracement. Price can potentially rise to 1st resistance of 1.16672 which is also Fibonacci projection of 61.8% and 38.2% retracement. Our bullish bias is further supported by the ichimoku cloud indicator and EMA as price is trading above it.
Areas of consideration:
- 4h 1st support at 1.16211
- 4h 1st resistance 1.16672
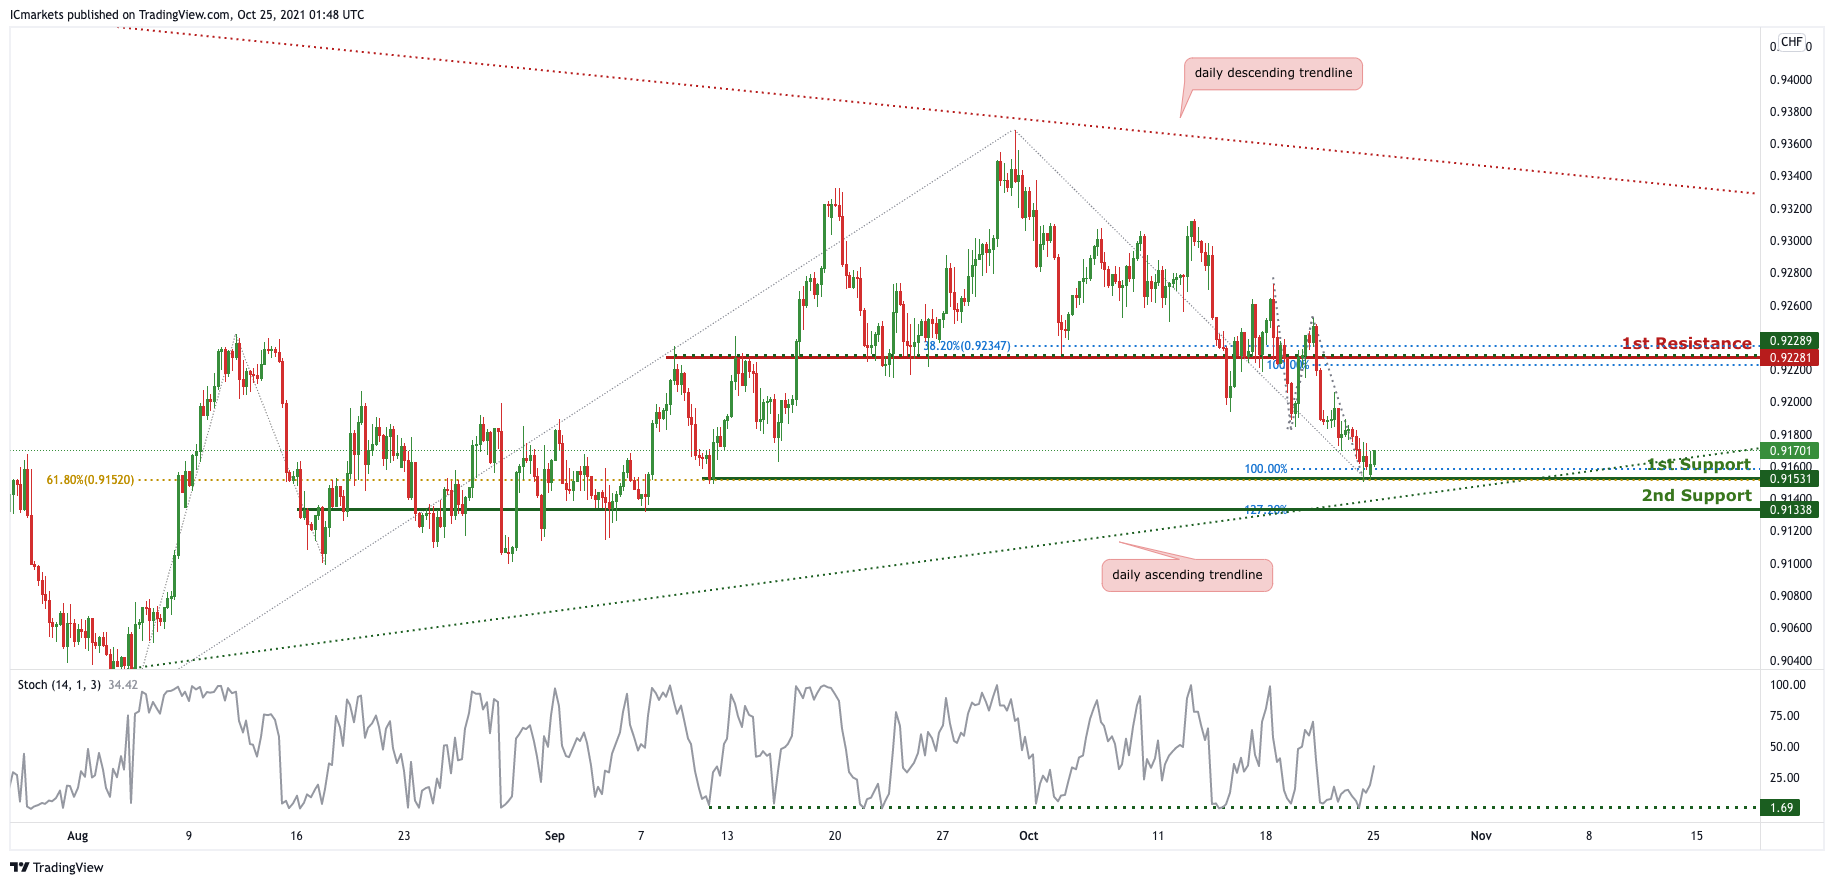
USD/CHF:
On the H4, price is seen to be reacting in a potential triangle. In reference to last week’s analysis, price did indeed move down to the 1st Support at 0.92028 and it bounced up. We can expect price to make a short-term bullish bounce from the 1st support in line with 61.8% Fibonacci retracement and 100% Fibonacci projection towards the 1st Resistance in line with 100% Fibonacci projection and 38.2% Fibonacci retracement. Our short-term bullish bounce is further supported by the stochastic indicator where the %K line bounces off the support level.
Areas of consideration:
- Watch 1st Support at 0.91531
- Watch 1st Resistance at 0.92281
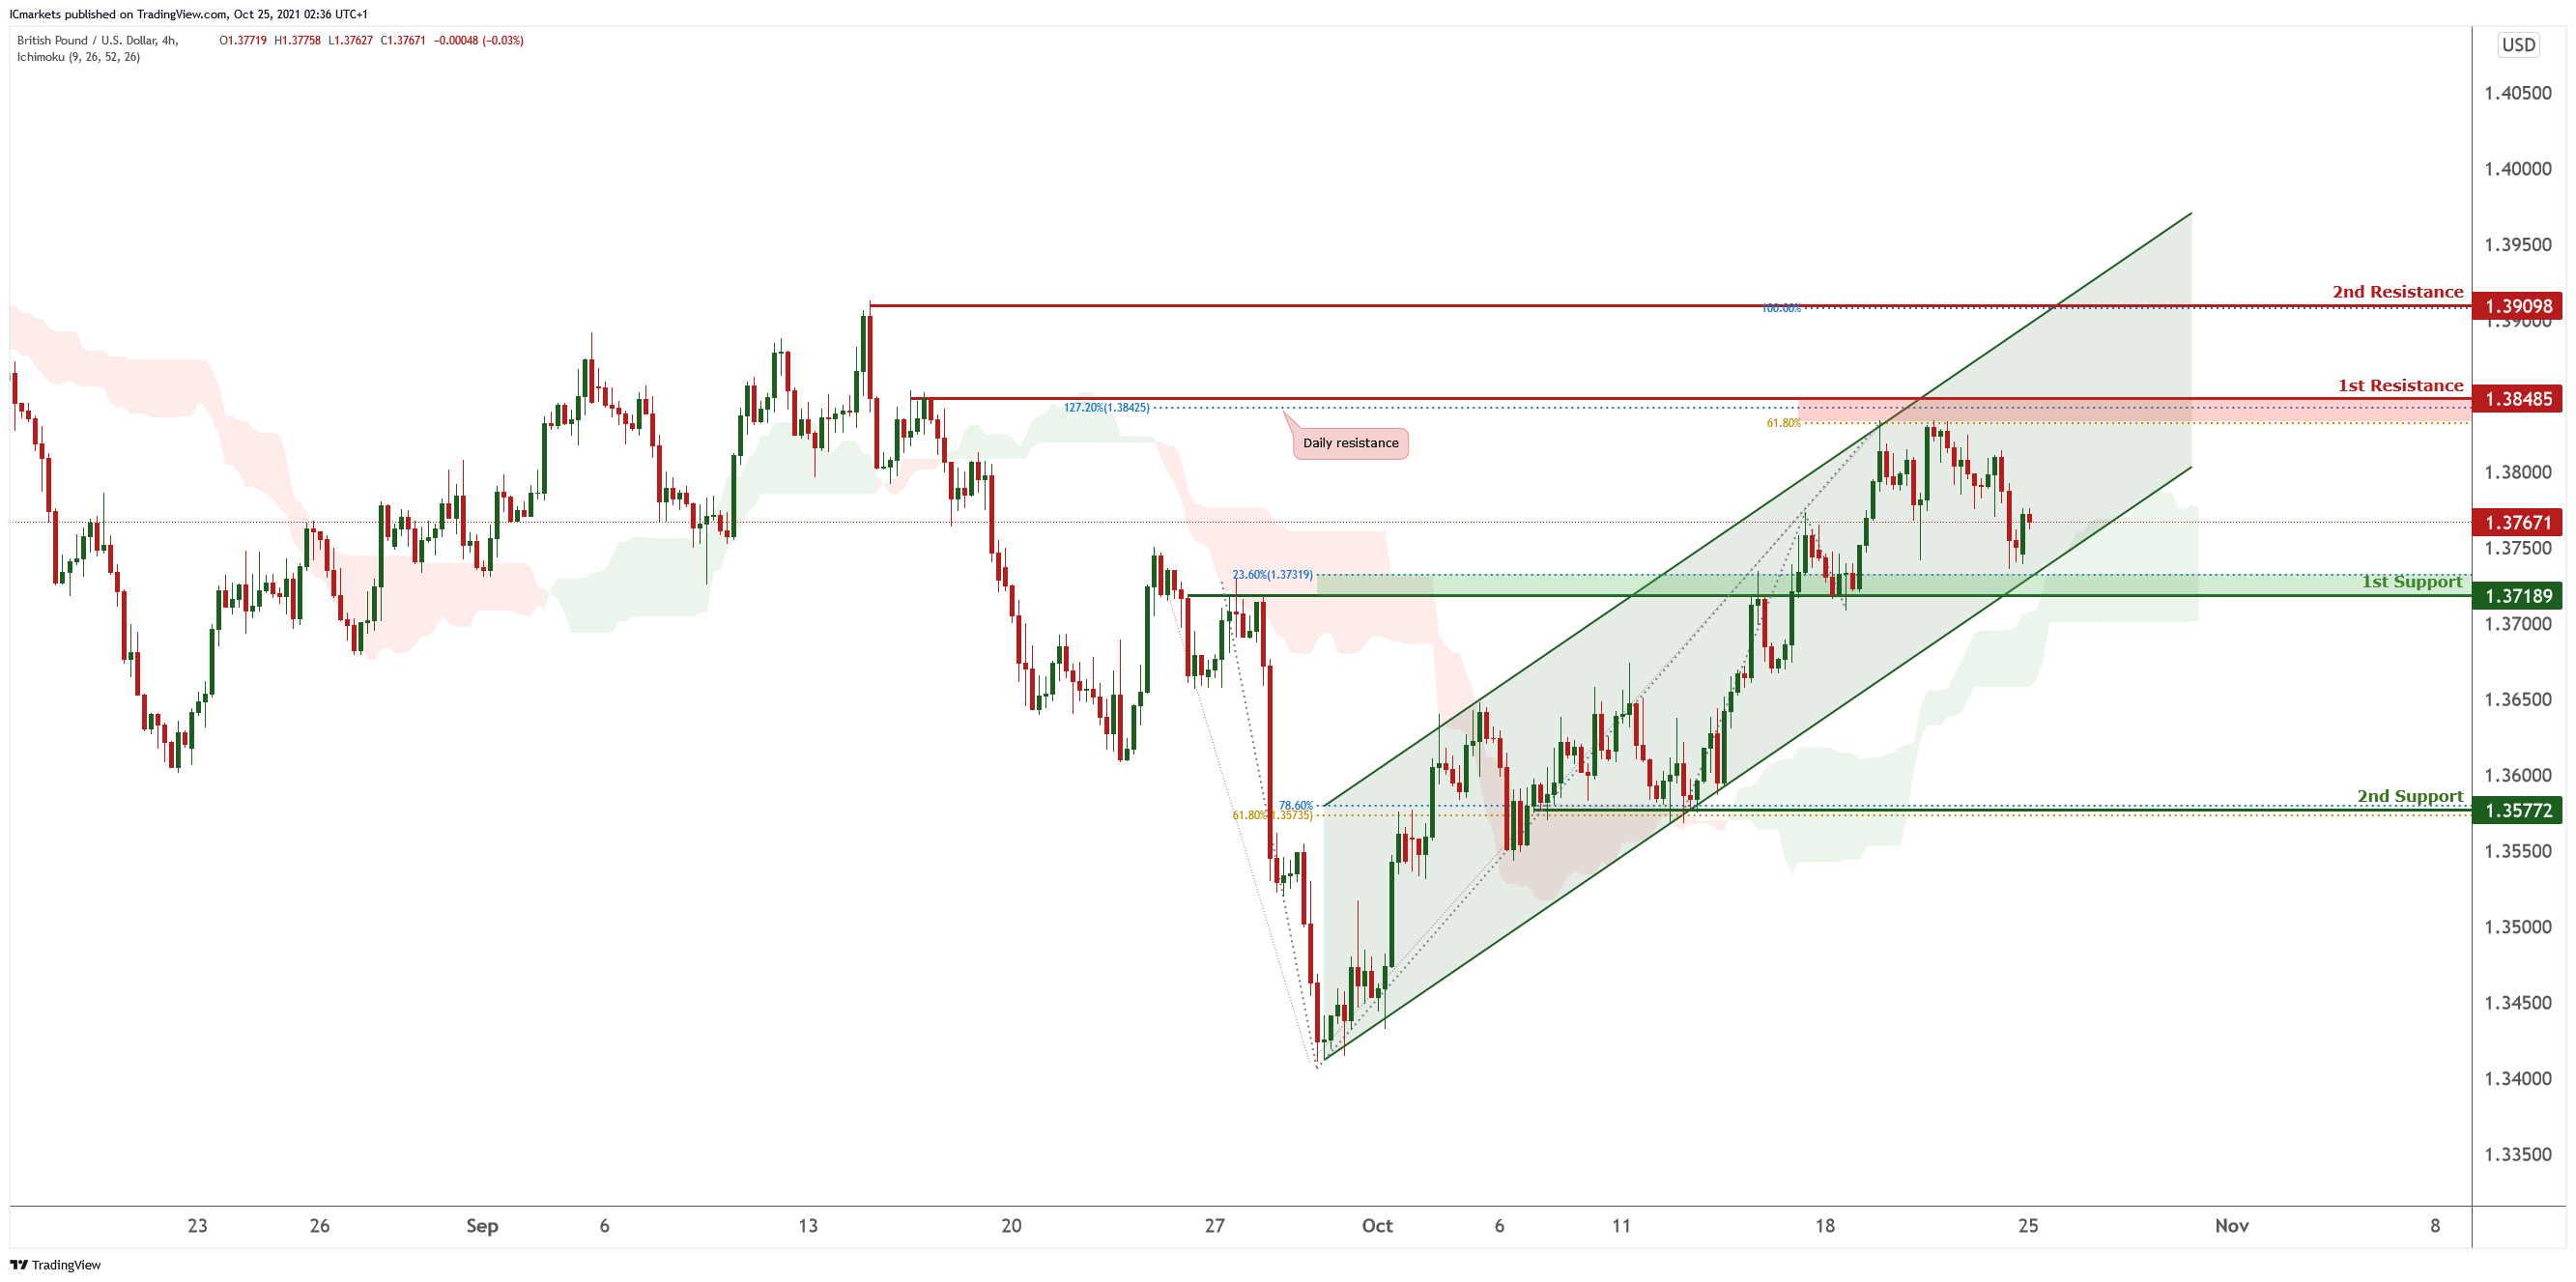
GBP/USD:
On the H4 chart, price is trading in an ascending channel and has recently bounced from the first support level of 1.37189 which is also Fibonacci retracement level 23.6%. Price can potentially rise to the first resistance level of 1.38485 which is also Fibonacci retracement 127.2% and 61.8% Fibonacci projection. Our bullish bias is further supported by the Ichimoku cloud indicator as price is trading above it
Areas of consideration :
1st support – 1.37189
1st resistance – 1.38485
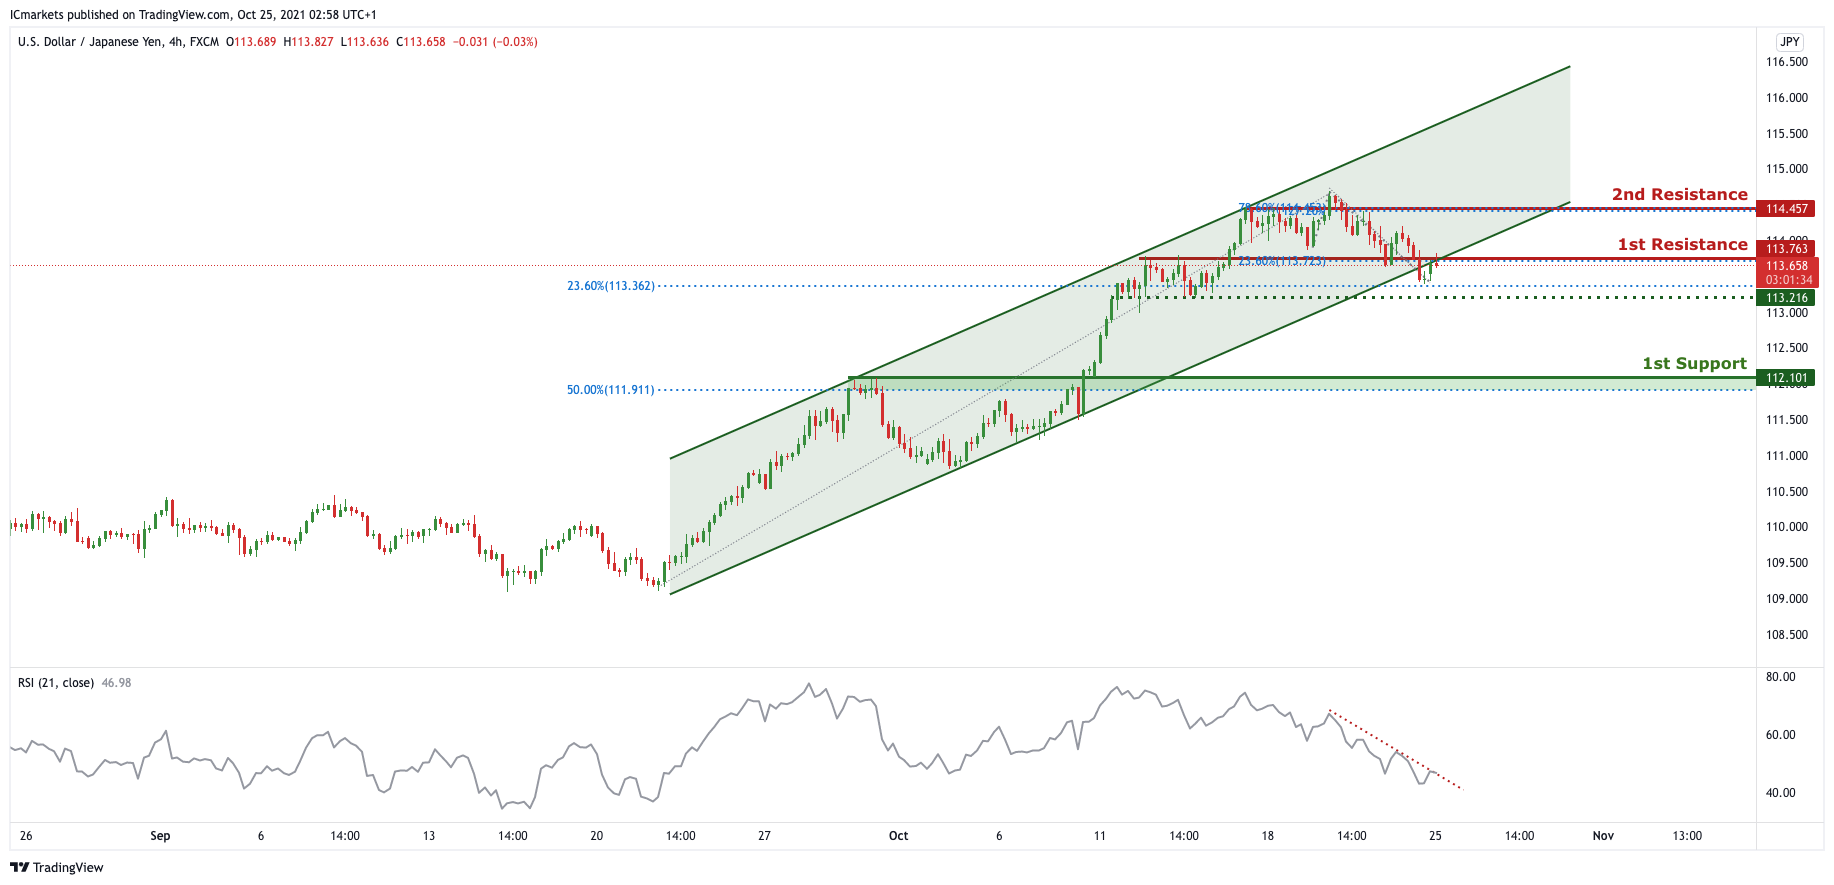
USD/JPY
On the H4 timeframe, price has broken out of the ascending channel, signifying a bearish momentum. We can expect price to drop down from the 1st Resistance in line with 23.6& Fibonacci retracement towards 1st support in line with 50% Fibonacci retracement if price breaks through the intermediate support. Our bearish bias is further supported by the RSI abiding to a descending trendline.
Areas of consideration:
- H4 1st resistance level 113.763
- H4 1st support level 112.101
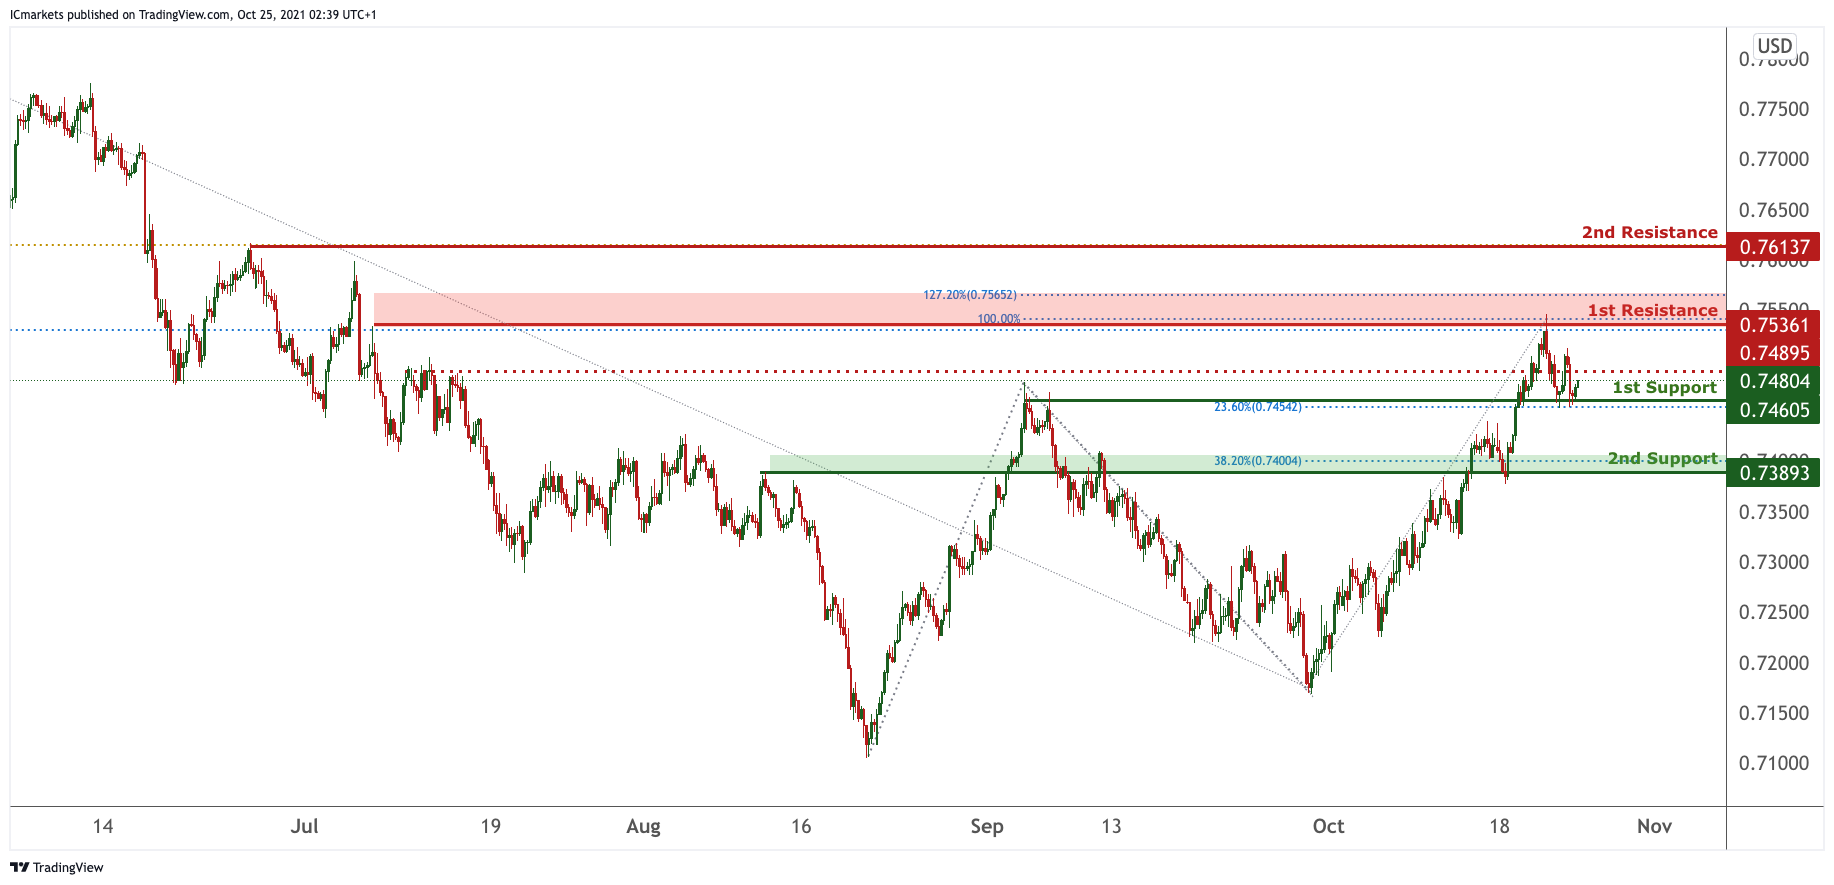
AUD/USD:
On the H4, we can see that price is reacting in between the 1st Resistance and 1st Support, price is currently holding below the intermediate resistance. If price fails to break through the intermediate resistance, we can expect price to have further downside towards the 2nd support in line with 38.2 % Fibonacci retracement. If price manages to break through the intermediate resistance, we can expect further upside on the price towards 1st resistance in line with 100% Fibonacci projection and 127.2 % Fibonacci retracement.
Areas of consideration:
- H4 1st resistance level 0.75361
- H4 1st support level 0.74605
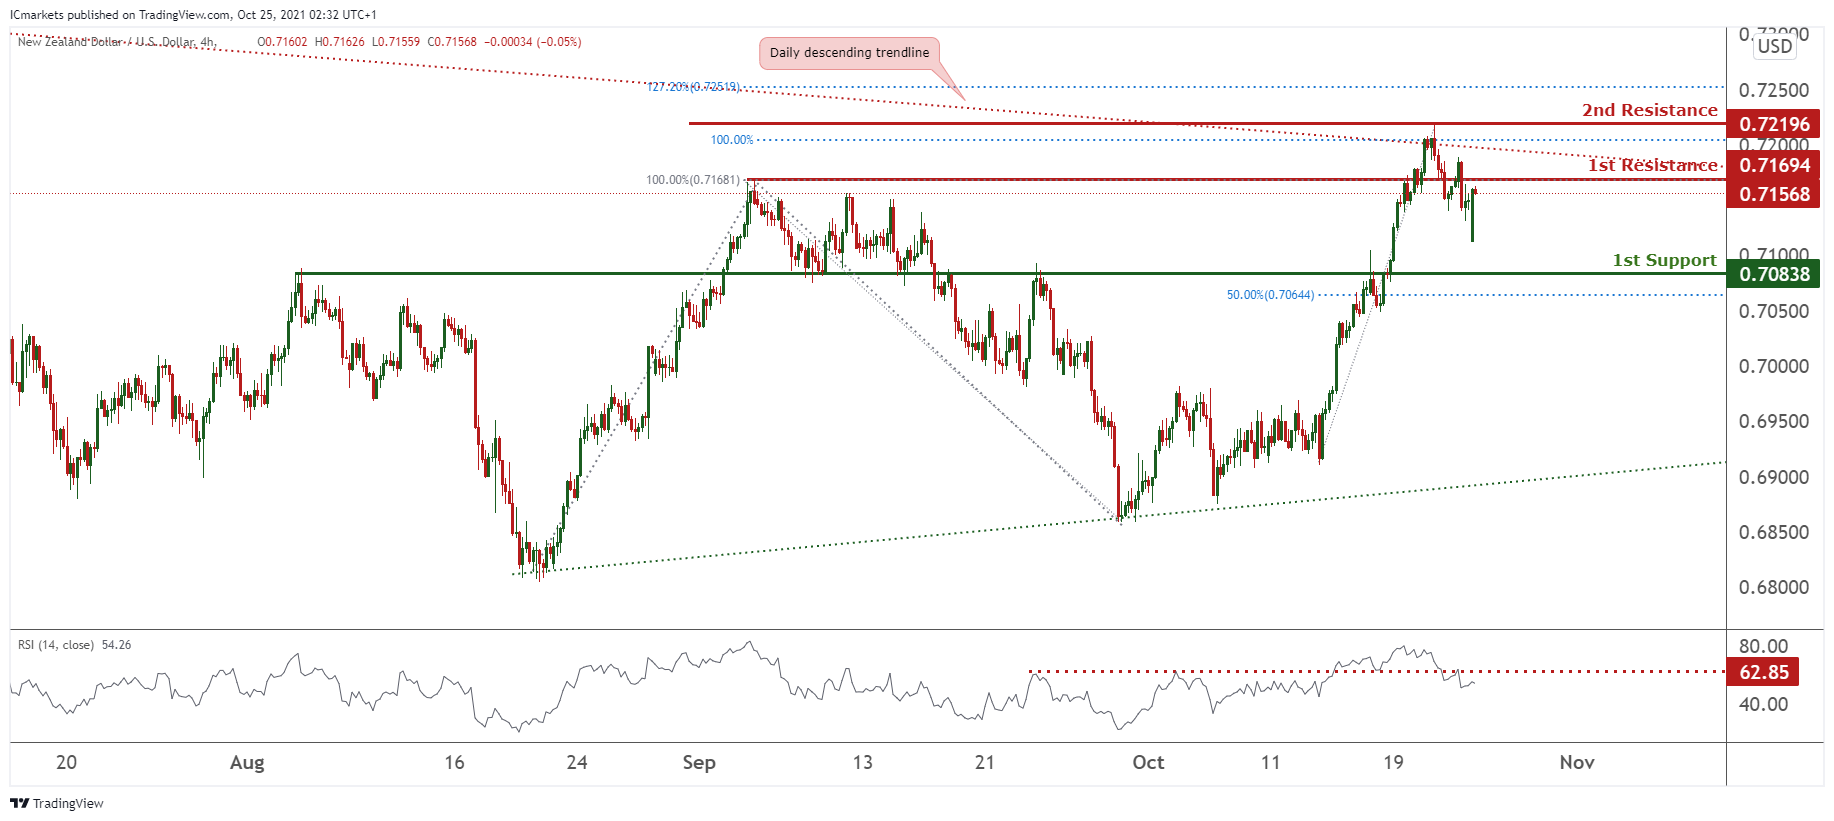
NZD/USD:
On the H4 timeframe, prices have recently reversed off our daily descending trendline and could potentially dip towards our 1st support at 0.70838 which is a graphical overlap and in line with 50% Fibonacci retracement. Technical indicators are showing bearish momentum. Alternatively, breaking our 1st resistance at 0.71694 might find prices climbing higher towards our 2nd resistance 0.72196.
Areas of consideration:
- H4 time frame, 1st resistance at 0.71694
- H4 time frame, 1st support at 0.70838
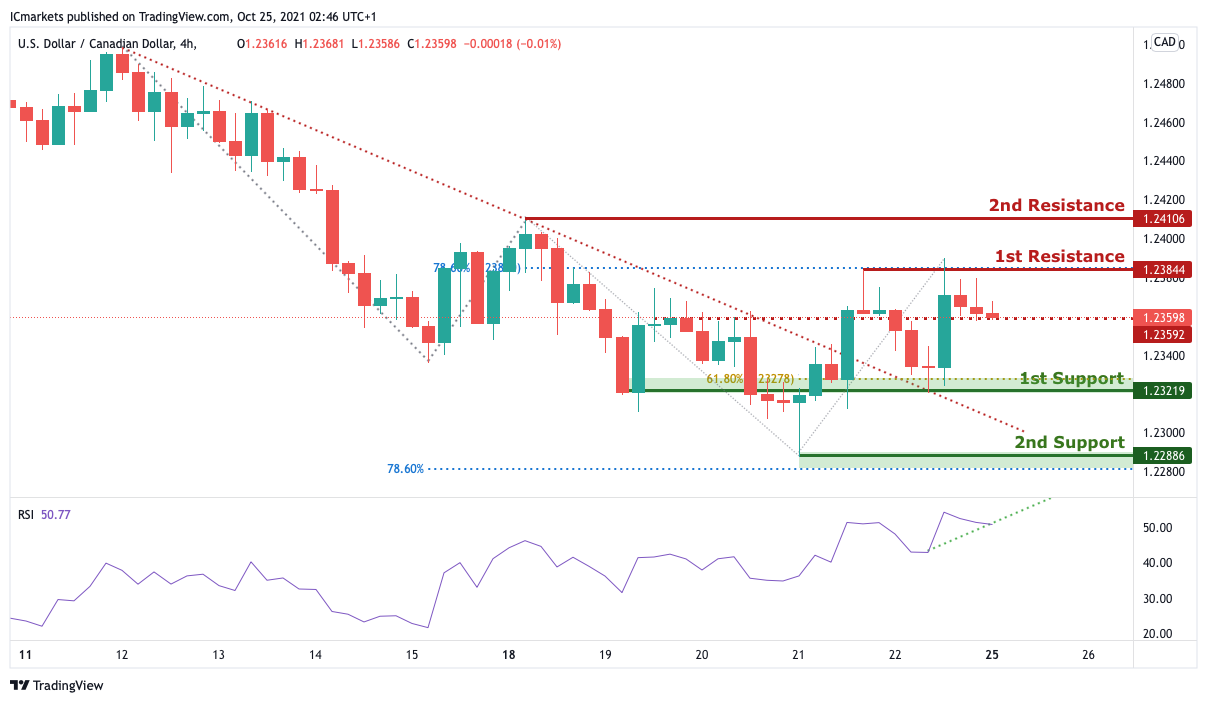
USD/CAD:
On the H4, price recently did a trendline breakout pullback. Usually after such moves, we will see more bullish momentums. Along with the stochastics indicator showing an upwards trend, we are currently biased for the pair to be bullish. Therefore, we expect price to 1st resistance at 1.23844 in line with the 78.6% Fibonacci retracement which is also a horizontal swing high resistance and possibly to 2nd resistance at 1.24106 in line with another graphical swing high resistance. Otherwise, price may break the intermediary support at 1.23598 and head for 1st support at 1.23219 before continuing with the bullish momentum.
Areas of consideration:
- H4 time frame, support at 23598
- H4 time frame, resistance at 23844
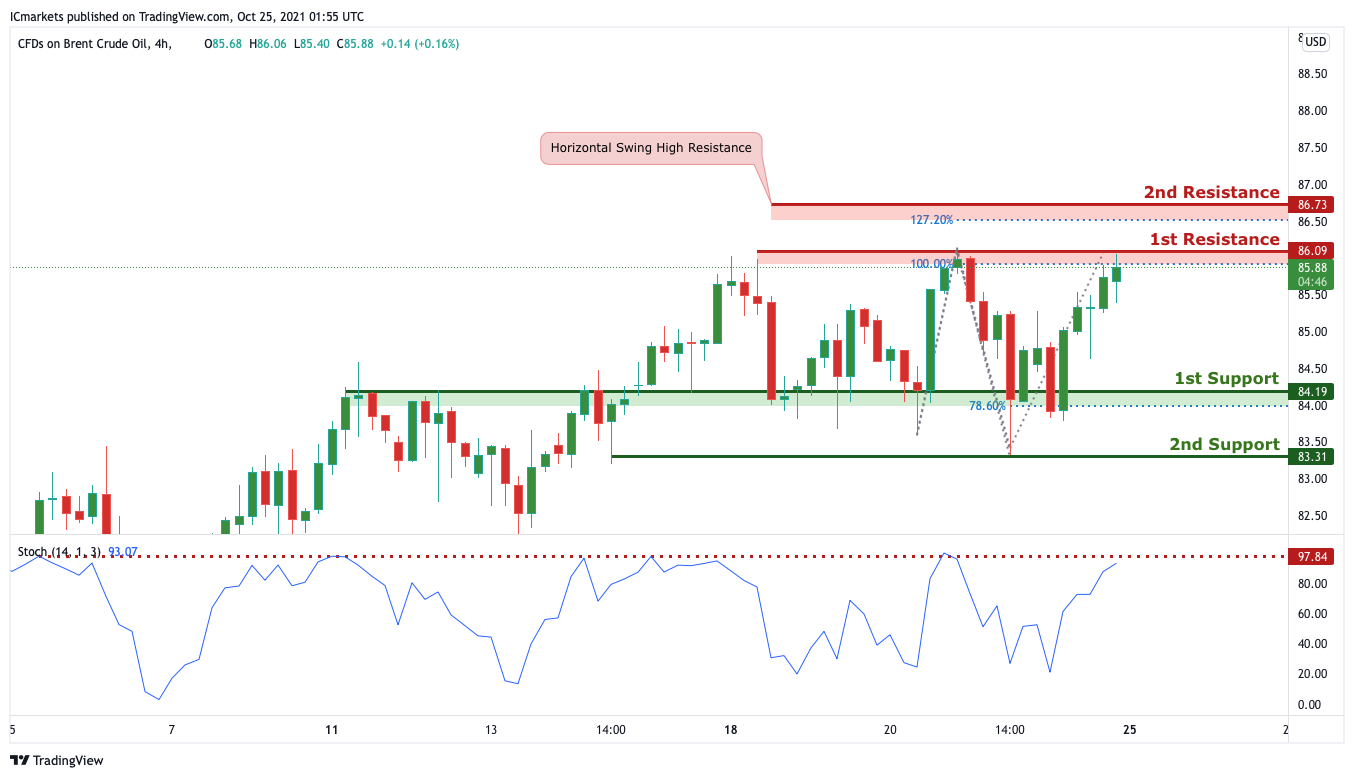
OIL:
On the H4 timeframe, price is currently at our 1st resistance at 86.09 in line with the 61.8% Fibonacci retracement. With the stochastics indicator showing that price is reaching a resistance, we are likely to see price head down to 1st support at 94.19 in line with our horizontal overlap support and 78.6% Fibonacci retracement. Alternatively, we may see price break 1st resistance and head for 2nd resistance at 86.73 in line with the 127.2% Fibonacci extension which is also our graphical horizontal swing high resistance.
Areas of consideration:
- H4 time frame, 1st resistance of 09
- H4 time frame, 1st support of 19
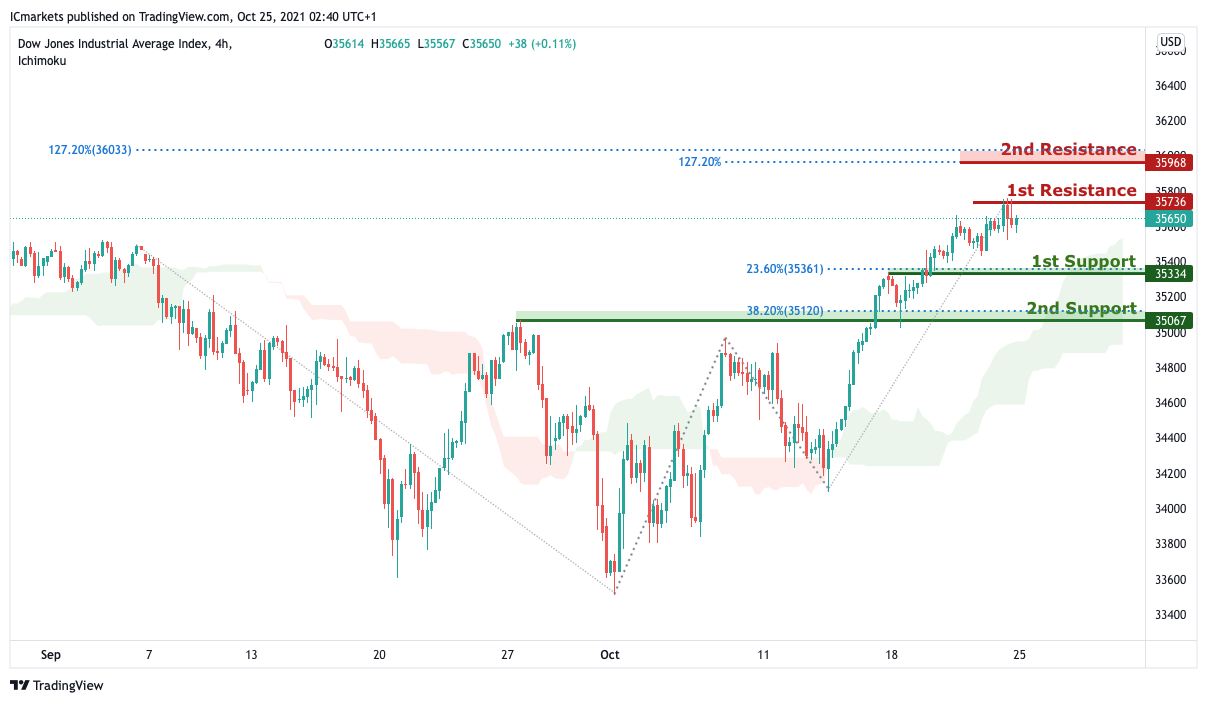
Dow Jones Industrial Average:
On the H4, price has just bounced off the 1st resistance at 35736 which is a graphical horizontal swing high resistance. Despite our bullish bias, we have may see a slide pullback of price to 1st support at 35334 in line with the 23.6% Fibonacci retracement level which is a horizontal overlap support before continuing with its bullish momentum. Alternatively, price may just head for 2nd resistance now and at 35968 in line two 127.2% Fibonacci extension levels.
Areas of consideration:
- 4H resistance at 35664
- 4H support at 35334
The accuracy, completeness and timeliness of the information contained on this site cannot be guaranteed. IC Markets does not warranty, guarantee or make any representations, or assume any liability regarding financial results based on the use of the information in the site.
News, views, opinions, recommendations and other information obtained from sources outside of www.icmarkets.com.au, used in this site are believed to be reliable, but we cannot guarantee their accuracy or completeness. All such information is subject to change at any time without notice. IC Markets assumes no responsibility for the content of any linked site.
The fact that such links may exist does not indicate approval or endorsement of any material contained on any linked site. IC Markets is not liable for any harm caused by the transmission, through accessing the services or information on this site, of a computer virus, or other computer code or programming device that might be used to access, delete, damage, disable, disrupt or otherwise impede in any manner, the operation of the site or of any user’s software, hardware, data or property.