
Key risk events today:
German Ifo Business Climate; New Zealand Core Retail Sales q/q and Retail Sales q/q.
EUR/USD:
Weekly gain/loss: -0.28%
Weekly close: 1.1018
Weekly perspective:
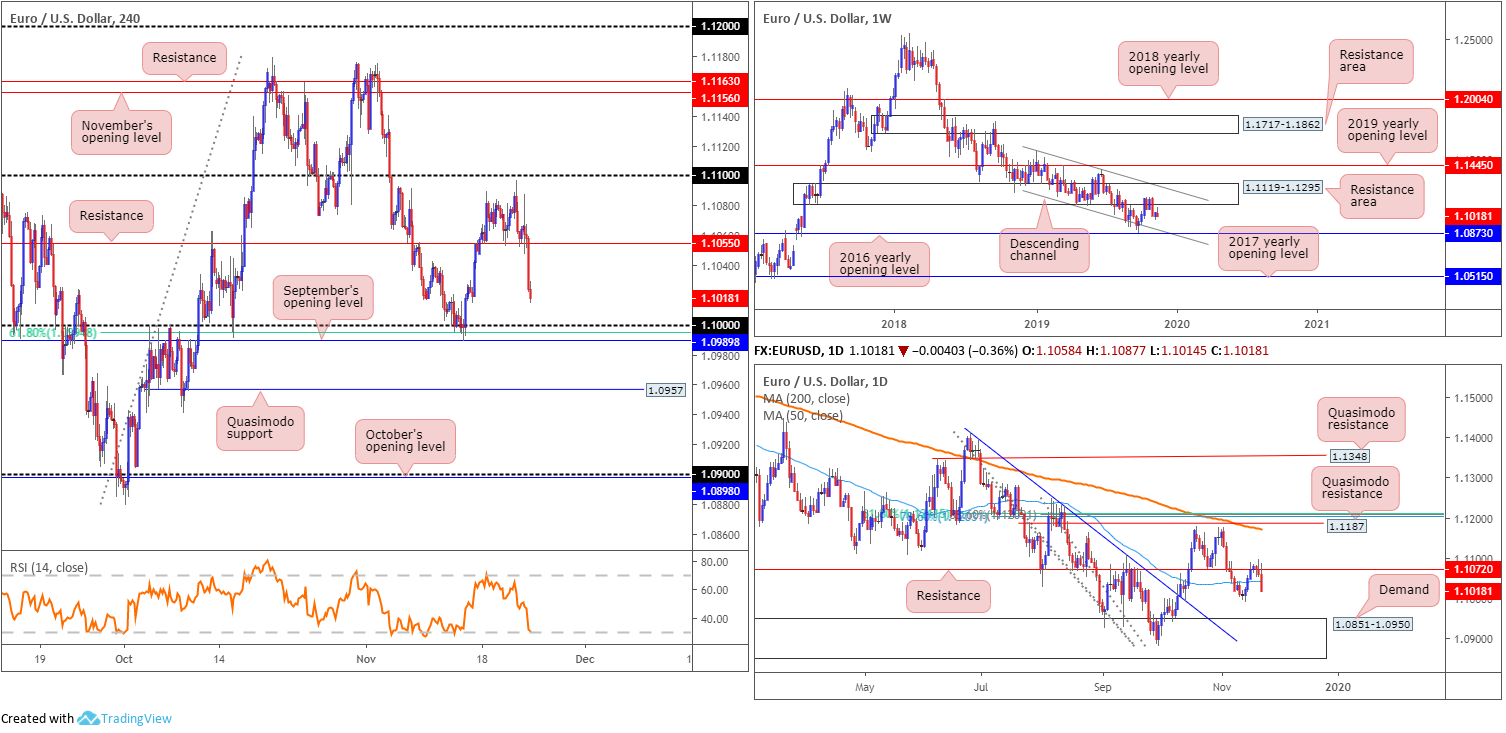
Longer-term flow retained a bearish tone last week, languishing south of a long-standing resistance area at 1.1119-1.1295. Further selling going forward has the lower boundary of a descending channel to target (extended from the low 1.1109), merging closely with the 2016 yearly opening level at 1.0873.
Concerning trend direction, the primary downtrend has been in motion since topping in early 2018 at 1.2555.
Daily perspective:
Despite several upside attempts, resistance at 1.1072, which boasts reasonably significant history since the beginning of August, maintained its presence in recent trade. Support in the form a 50-day SMA (blue – 1.1041) gave way Friday, consequently exposing the 1.0989 November 14 low, followed by daily demand at 1.0851-1.0950. Note the said demand base holds the 2016 yearly opening level at 1.0873 within its lower boundary.
H4 perspective:
According to Markit:
- The Eurozone economy remained close to stagnant for a third successive month in November, according to the flash PMI. Flash Eurozone Manufacturing PMI came in at 46.6 (45.9 in October), and Flash Eurozone Services PMI Activity Index saw 51.5 (52.2 in October).
- US private sector output increased at a faster pace in November, with the rate of expansion quickening to a four-month high. Growth was supported by stronger increases in activity across both the manufacturing and service sectors. Flash US Manufacturing PMI registered 52.2 (51.3 in October), while Flash US Services Business Activity Index came in at 51.6 (50.6 in October).
Sellers strengthened their grip in the early hours of London Friday, following disappointing Eurozone data, consequently drawing price action marginally beneath support pencilled in at 1.1055. Further selling emerged in early US trade, weighed by strong US data.
The market concluded within striking distance of the key figure 1.10, which boasts additional layers of support nearby in the form of a 61.8% Fibonacci retracement at 1.0994 and September’s opening level at 1.0989. Below this base, nevertheless, scope for a run towards Quasimodo support at 1.0957 is visible. Indicator-based traders may also want to note the relative strength index (RSI) trades at its oversold value.
Areas of consideration:
The area between September’s opening level at 1.0989 and the 1.10 figure on the H4 likely commands interest this week as a potential buy zone. However, whipsaws are common viewing around psychological levels; waiting for additional candlestick confirmation to form before pulling the trigger is, therefore, an idea worth considering (entry/risk can be defined according to the selected candlestick pattern).
A decisive close beneath 1.0989 opens the door to an intraday bearish theme, targeting H4 Quasimodo support at 1.0957 as the initial downside take-profit area. Do bear in mind, weekly price suggests the 2016 yearly opening level at 1.0873 could eventually make an appearance, so keeping a portion of the position open is certainly an idea.
GBP/USD:
Weekly gain/loss: -0.53%
Weekly close: 1.2829
Weekly perspective:
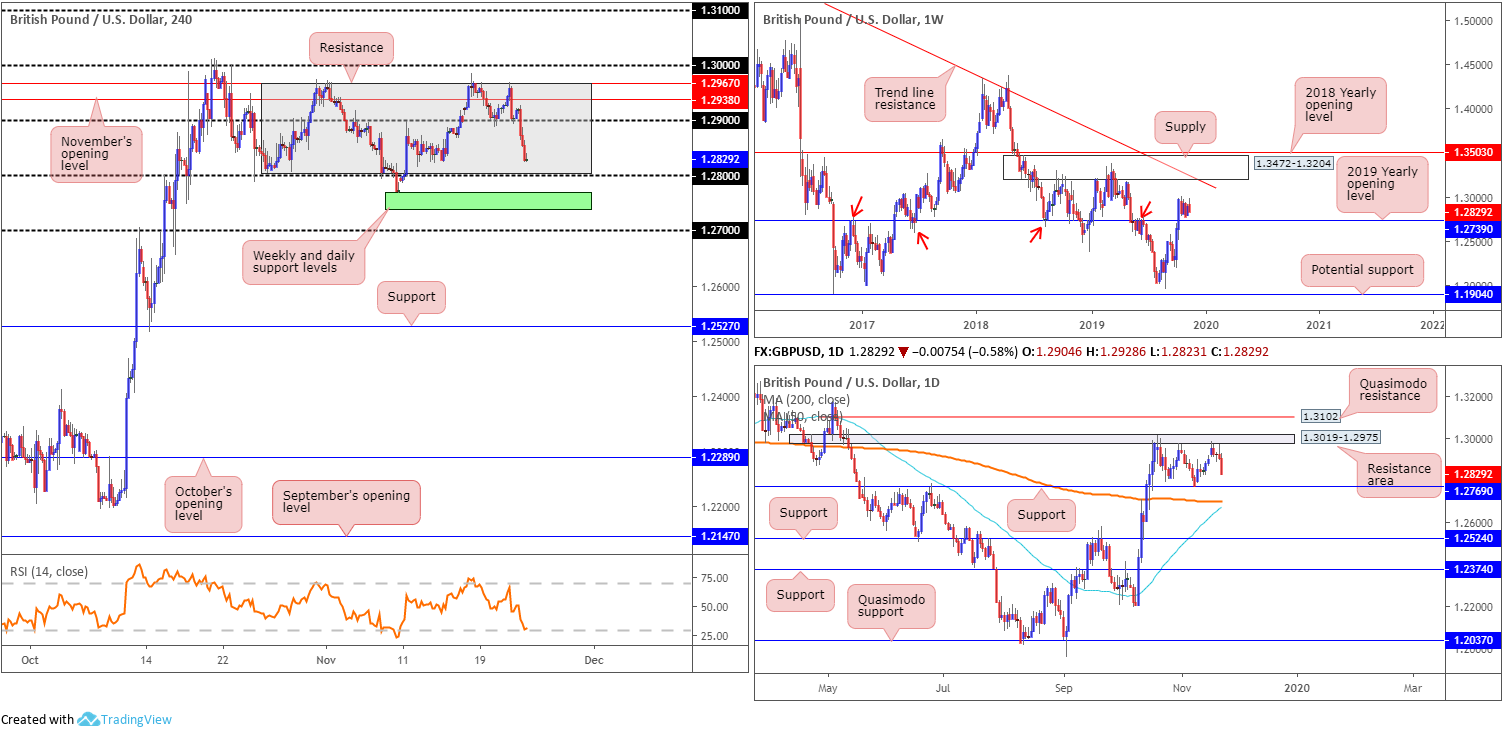
Structurally, the view on the weekly timeframe remains optimistic, exhibiting scope to extend north until crossing swords with supply at 1.3472-1.3204 and long-term trend line resistance etched from the high 1.5930. However, before a move higher materialises, a retest at the 2019 yearly opening level 1.2739 is certainly a scenario to keep a tab on this week, having seen the barrier boast reasonably significant history (red arrows).
Regarding the immediate trend, the market faces a downward trajectory from 1.4376, with a break of the 1.1904 low (labelled potential support) confirming the larger downtrend from 1.7191.
Daily perspective:
Since mid-October, candle action on the daily timeframe has been carving out a consolidation between a resistance area plotted at 1.3019-1.2975 and a well-placed support level at 1.2769. Outside of this range, Quasimodo resistance lies at 1.3102, whereas south of 1.2769, the 200-day SMA (orange – 1.2700) and 50-day SMA (blue – 1.2672) offer support and are, at the time of writing, seen closing in on each other for a possible cross higher (sometimes referred to as a ‘Golden Cross’).
H4 perspective:
Friday witnessed the release of the first UK flash manufacturing data. According to Markit, the headline IHS Markit / CIPS Flash UK Composite Output Index – which is based on approximately 85% of usual monthly replies – registered 48.5 in November, down from 50.0 in October and below the crucial 50.0 no-change value. Flash UK Manufacturing PMI for November came in at 48.3 (Oct final: 49.6); Flash UK Services Business Activity Index for November registered 48.6 (Oct final: 50.0).
A combination of weak UK data and upbeat manufacturing figures out of the US saw the pound lose grip of 1.29 and close a few points north of 1.28. Since late October, the H4 candles have traded within a range between H4 resistance at 1.2967 and the 1.28 handle (grey). Notice this consolidation represents a cleaner version of the range depicted on the daily timeframe.
Areas of consideration:
Many traders will likely have eyes on 1.28 for a bounce higher early week. While this is considered a valid approach, the possibility of a fakeout occurring beneath 1.28 to the weekly and daily support levels at 1.2739 and 1.2769, respectively (green on the H4), is also worthy of consideration.
A break beneath the aforesaid higher-timeframe supports has the two SMAs to contend with around the 1.27 region, offering another potential base for longs this week, should we reach this far south.
AUD/USD:
Weekly gain/loss: -0.54%
Weekly close: 0.6781
Weekly perspective:
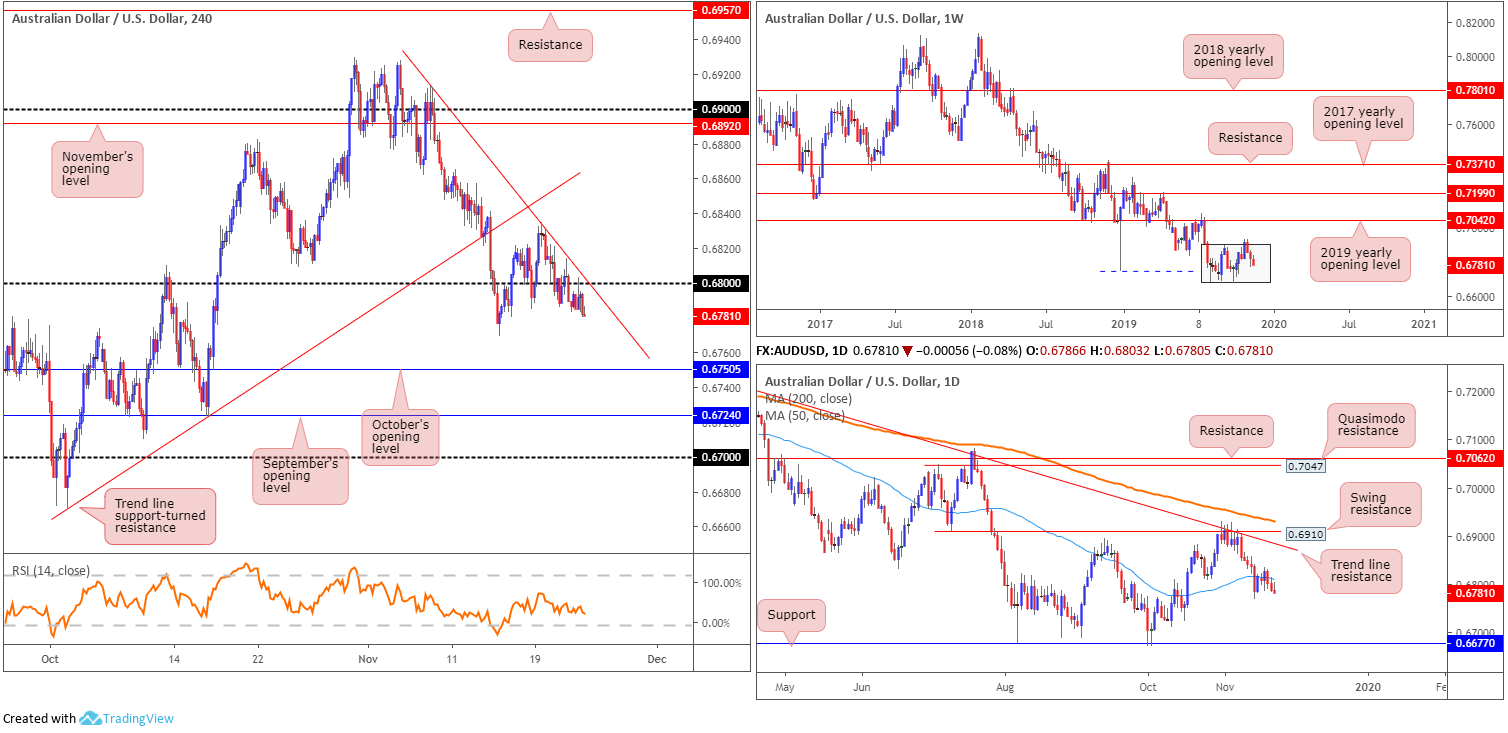
The Australian dollar surrendered ground to the buck for a third successive session last week, hauling weekly price deeper into its current range between 0.6894/0.6677 (light grey). With a primary downtrend in play since early 2018, breaking through the lower edge of the said range is likely, with the next support target not visible until around 0.6359.
Daily perspective:
Despite an earnest attempt to conquer higher ground last week, price failed to sustain gains beyond the 50-day SMA (blue – 0.6810). Mid-week witnessed a relatively decisive push south, followed through with a modest continuation Friday.
Although support may develop around the 0.6728ish region on the daily timeframe, traders likely have their crosshairs fixed on support pencilled in from 0.6677.
H4 perspective:
Friday’s movement on the H4 timeframe was not really anything to get excited above. Price did, however, attempt to reclaim 0.68+ status, though failed to grasp fresh ground. Closing beneath 0.68 will likely push for a test of October’s opening level this week at 0.6750.
Areas of consideration:
Those who read our recent technical reports may recall the following piece:
With buyers and sellers squaring off around the 0.68 handle this morning, as well as daily price nudging back beneath its 50-day SMA and weekly flow demonstrating scope to explore lower levels within its current range, further selling is a possibility today. A decisive H4 close beneath 0.68 that’s followed up with a retest, preferably in the shape of a H4 bearish candlestick configuration (entry and risk can [trader dependent] be set according to this structure), would likely be viewed as a potential short, targeting October’s opening level at 0.6750 on the H4 scale as an initial take-profit zone.
In light of the strong close sub 0.68 and retest at the underside of the figure Friday, shaped by way of a reasonably strong H4 selling wick (upper shadow), a short position may be considered at the open with a protective stop-loss order plotted north of trend line resistance etched from the high 0.6913.
USD/JPY:
Weekly gain/loss: -0.11%
Weekly close: 108.62
Weekly perspective:
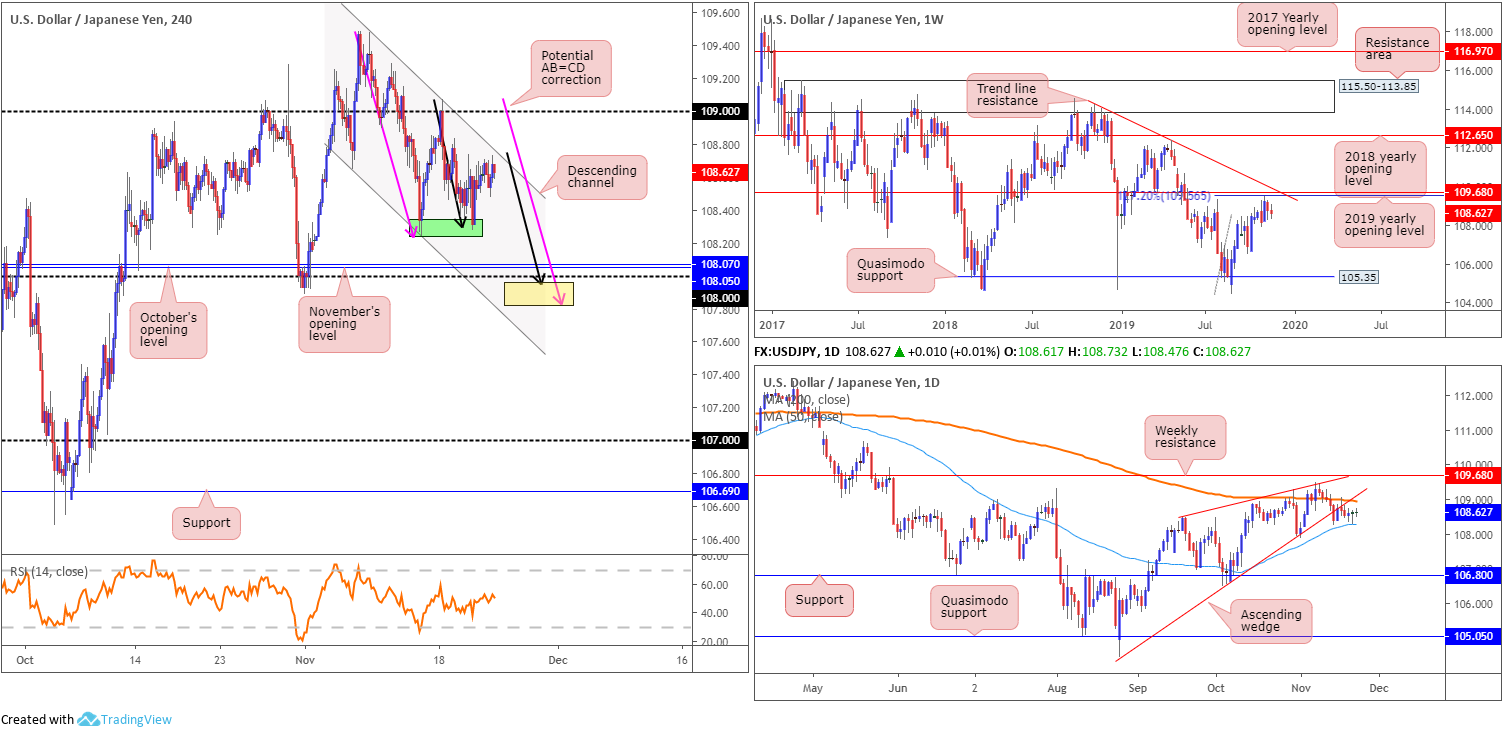
Technical research based on the weekly timeframe had the USD/JPY contained within the prior week’s range (109.29/108.24) last week. Structurally, resistance is seen close by in the form of the 2019 yearly opening level at 109.68 and a 127.2% Fibonacci ext. point at 109.56 (taken from the low 104.44). Also sited nearby is trend line resistance extended from the high 114.23.
In regards to the market’s primary trend, the pair has been entrenched within a range since March 2017, spanning 115.50/105.35.
Daily perspective:
USD/JPY kicked off last week retesting the underside of a 200-day SMA (orange – 108.95) and the lower edge of a recently broken ascending wedge formation (104.44). Going into the new week, we essentially have the daily candles battling for position between the said resistances and the 50-day SMA value (blue – 108.29), which held price higher Thursday, with probabilities favouring a break lower. The next downside objective, beyond the 50-day SMA, falls in around support at 106.80.
H4 perspective:
Since topping at 109.47, H4 price has been compressing within the limits of a descending channel formation (109.47/108.64). Local support is seen around 108.30 (green), with a break of this area shining the spotlight on 108, along with November and October’s opening levels at 108.05 and 108.07, respectively. In addition to this, traders may also find use in pencilling in two potential AB=CD bullish formations (pink and black arrows), terminating a few points south of 108 (yellow) at 107.82/107.96.
Areas of consideration:
All three timeframes, according to chart studies highlighted above, indicate selling may be on the cards over the coming weeks.
The current H4 channel resistance, therefore, should hold ground, with a push lower seen to the 108 boundary. As such, searching for intraday short setups around this neighbourhood may be an idea.
Buying from 108ish is expected, particularly if a fakeout through the round number is observed to the AB=CD supports that’s followed up with a H4 close back above 108. However, upside from here is still unlikely to be record breaking as both weekly and daily timeframes forecast lower levels.
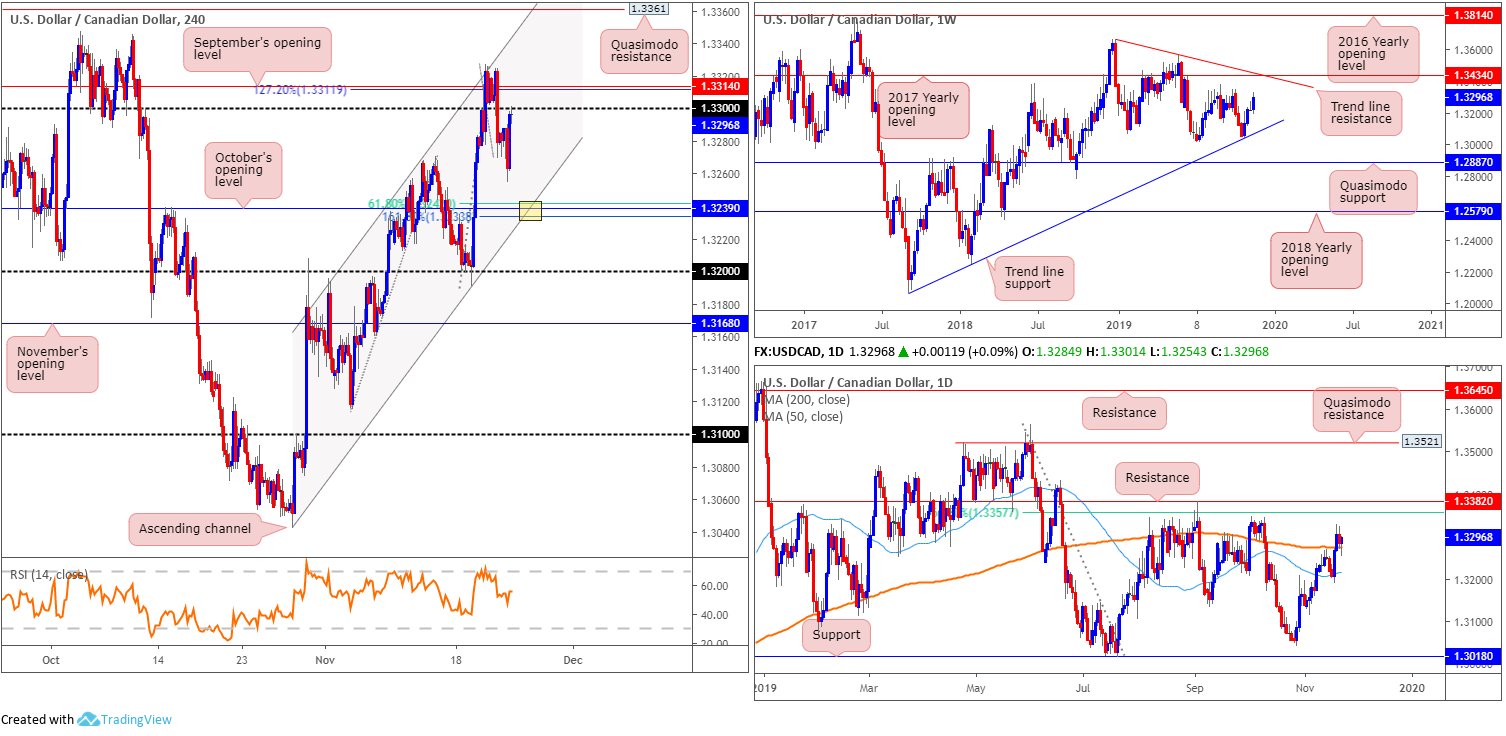
USD/CAD:
Weekly gain/loss: +0.60%
Weekly close: 1.3296
Weekly perspective:
Despite the prior week’s gravestone doji candlestick formation (considered a bearish signal), the US dollar continued to flex its financial muscle against the Canadian dollar last week. Adding more than 75 points, the new week has tops around 1.3342 in sight, closely followed by the 2017 yearly opening level at 1.3434 and trend line resistance taken from the peak at 1.3661.
Overall, the immediate trend faces north since bottoming in September 2017, though this move could also be considered a deep pullback in a larger downtrend from the 1.4689 peak in early January 2016.
Daily perspective:
Wednesday observed daily price overthrow the 200-day SMA (orange – 1.3275) in reasonably robust fashion, potentially gearing up for a continuation move to around the 1.3382 neighbourhood/61.8% Fibonacci retracement ratio at 1.3357. Interestingly, Friday also witnessed a hammer candlestick pattern form at the top edge of the said 200-day SMA, considered a bullish signal at troughs.
H4 perspective:
The aftermath of Friday’s upbeat retail sales print out of Canada saw USD/CAD immediately dip to a session low of 1.3254. The move was reasonably short-lived, with price rotating north and shortly after gaining traction on the back of better-than-expected US manufacturing data.
Technically, the week concluded at the underside of 1.33, with a break of this figure likely to draw in September’s opening level at 1.3314 and a 127.2% Fibonacci extension point at 1.3311. Above here, significant resistance lies at 1.3361, a Quasimodo resistance level that aligns closely with channel resistance extended from the high 1.3196.
Areas of consideration:
H4 Quasimodo resistance at 1.3361 is a vital level for potential shorts this week. Note the line boasts a strong connection with daily resistances mentioned above at 1.3382 and 1.3357. In fact, the apex of the H4 Quasimodo resistance is based at the daily resistance 1.3382, therefore protective stop-loss orders can be sited above here, though is trader dependent.
In terms of potential long opportunities, should we reject 1.33 in early trade this week, October’s opening level on the H4 timeframe at 1.3239 boasts strong confluence (aligns with channel support extended from the low 1.3042 and a 61.8% Fibonacci retracement at 1.3241/161.8% Fibonacci ext. point at 1.3233).
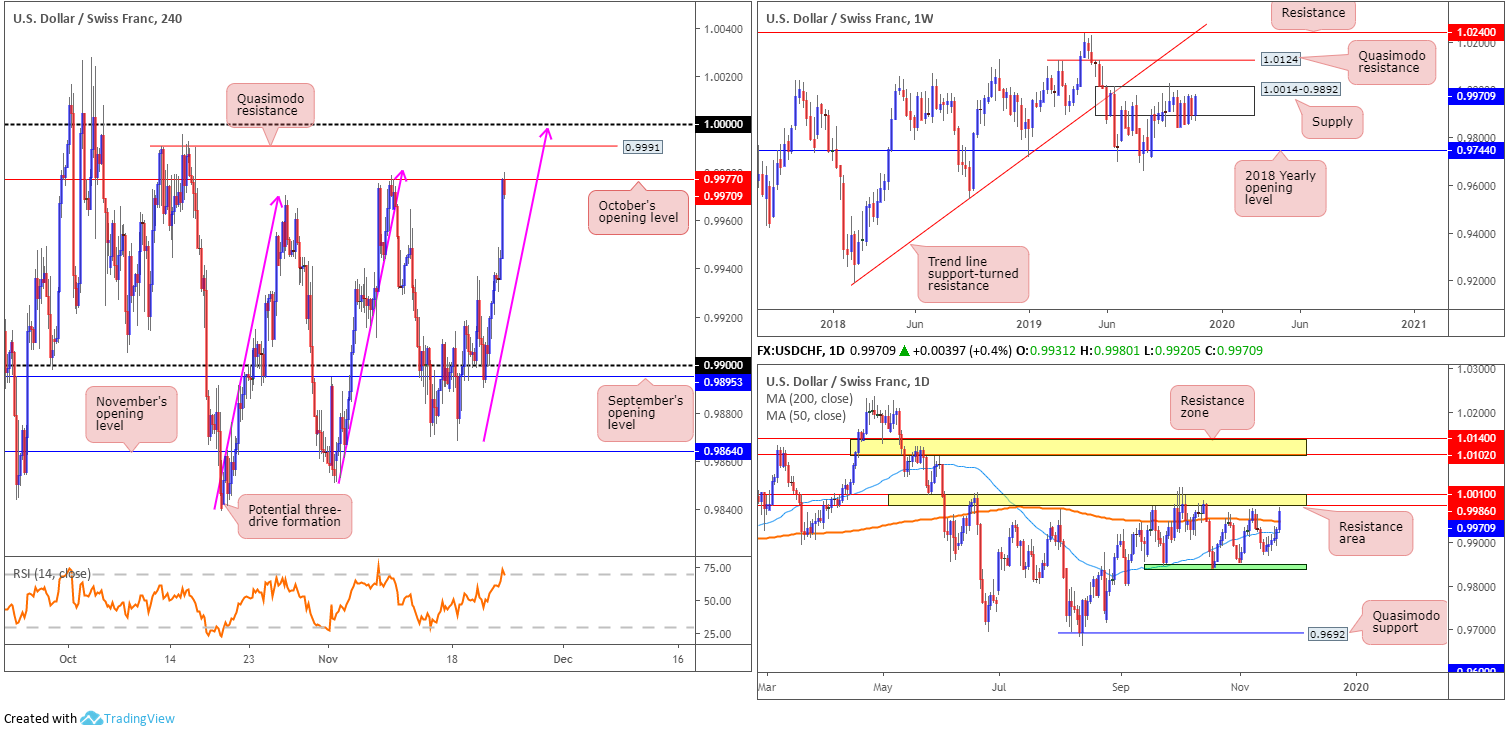
USD/CHF:
Weekly gain/loss: +0.79%
Weekly close: 0.9970
Weekly perspective:
Weekly price remains nestled within supply at 1.0014-0.9892. As highlighted in previous reports, the beginning of October witnessed a penetration to the outer edge of the supply area’s limit, possibly tripping a portion of buy stops and weakening sellers. An upside move out of the said supply may draw in Quasimodo resistance at 1.0124, while downside has the 2018 yearly opening level at 0.9744 in sight.
According to the primary trend, price also reflects a slightly bullish tone; however, do remain aware we have been rangebound since the later part of 2015 (0.9444/1.0240).
Daily perspective:
As evident from the daily timeframe, recent buying absorbed both the 50-day SMA (blue – 0.9923) and 200-day SMA (orange – 0.9948). Traders may also want to acknowledge that since mid-September, the unit has been busy carving out a consolidation between support around the 0.9845ish region (green) and a resistance area coming in at 1.0010/0.9986. Note price closed the week within striking distance of the upper edge of the said range.
H4 perspective:
Friday’s movement extended a five-day bullish phase off lows of 0.9868, bolstered by stronger-than-expected US manufacturing. Although price wrapped up the week testing familiar resistance: October’s opening level at 0.9977, Quasimodo resistance at 0.9991 shines bright as the next valid ceiling, closely followed by 1.0000 (parity).
Buy stops plotted above 0.9977 make Quasimodo resistance at 0.9991 incredibly attractive for shorts this week, though stop-loss placement is vitally important given 1.0000 may also act as a magnet. This is further emphasised by a potential three-drive formation (pink arrows) at 0.9998.
Areas of consideration:
The higher-probability shorts this week likely reside around the 1.0000 vicinity. Not only is the level stationed within weekly supply at 1.0014-0.9892, it merges closely with a three-drive H4 pattern and also resides within the daily resistance area at 1.0010/0.9986.
From 1.0000, traders have the option of positioning protective stop-loss orders above the top edge of the daily resistance area, targeting 0.9977 as the initial take-profit zone.
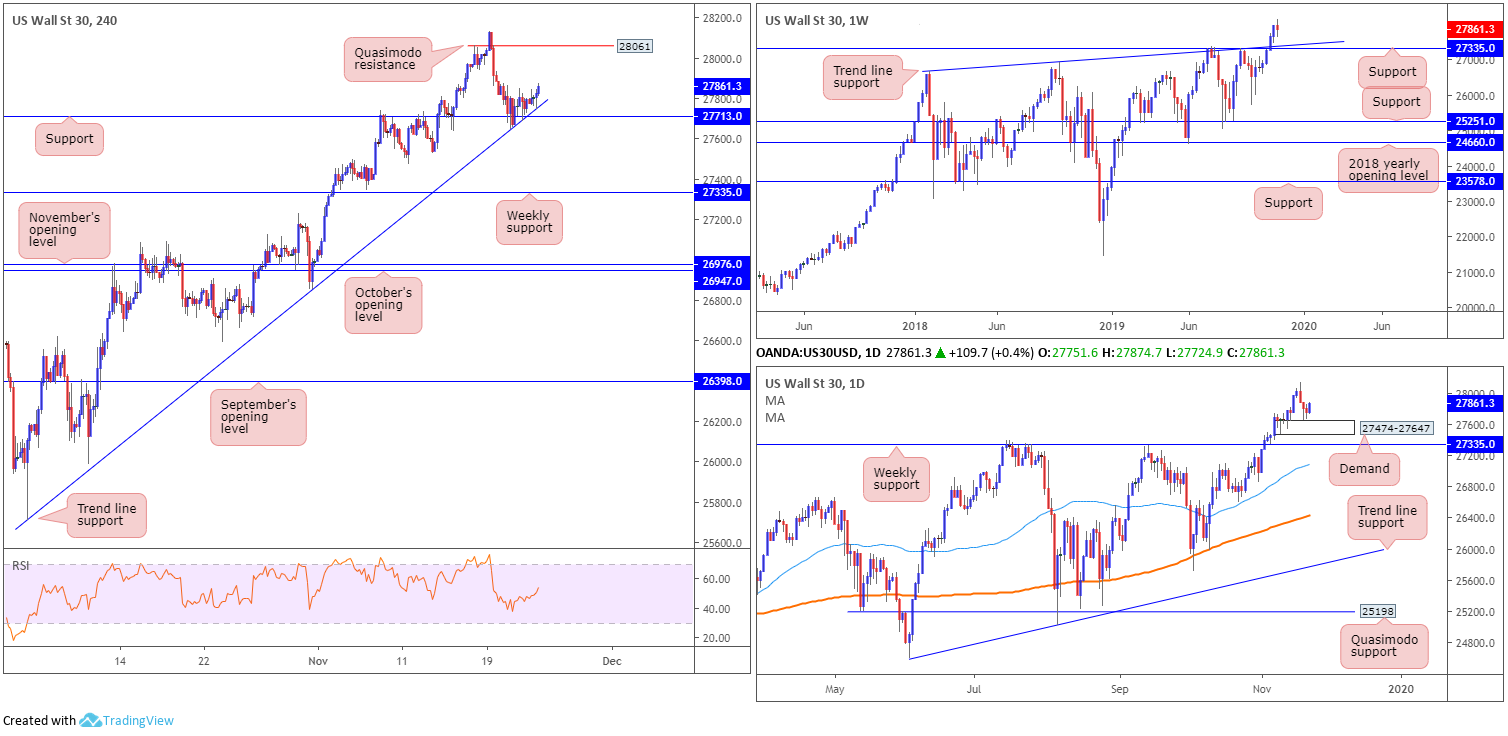
Dow Jones Industrial Average:
Weekly gain/loss: -0.38%
Weekly close: 27861
Weekly perspective:
Despite striking fresh records for a third successive week, US equities concluded recent trade in negative territory, snapping a four-week winning streak. Support at 27335, along with trend line support etched from the high 26670. remains a key focal point on the weekly timeframe this week.
Daily perspective:
Local demand at 27474-27647, sited a few points north of the said weekly support levels, held price action higher last week. Continued bidding from this point has the all-time high 28130 to target.
H4 perspective:
Although down on the week, Friday had the index higher, following China’s President Xi Jinping calling for Beijing and Washington to strengthen communications. The Dow Jones Industrial Average advanced 109.33 points, or 0.39%; the S&P 500 added 6.75 points, or 0.22% and the tech-heavy Nasdaq 100 added 6.43 points, or 0.08%.
Technically speaking, H4 price remains buoyed by support at 27713, which happens to merge with trend line support extended from the low 25710. To the upside, we have Quasimodo resistance residing around 28061, followed by all-time highs. Note the said support level is stationed just north of daily demand highlighted above at 27474-27647.
Areas of consideration:
Additional upside this week is certainly a strong possibility, knowing daily demand recently entered the fold. A long at current price could be an idea, with protective stop-loss orders plotted beneath the current H4 trend line support, targeting 28061 as the initial objective.
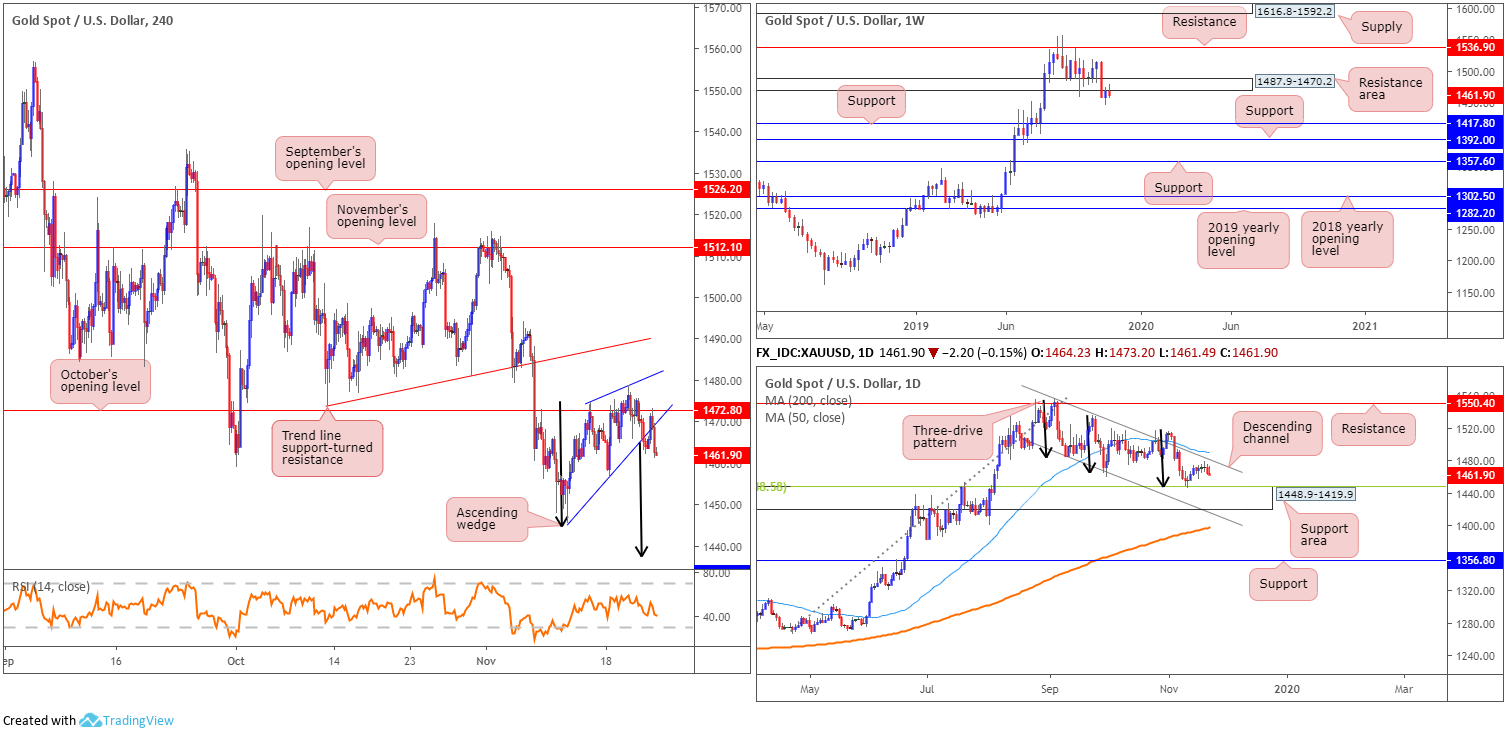
XAU/USD (GOLD):
Weekly gain/loss: -0.41%
Weekly close: 1461.9
Weekly perspective:
After price recently tunnelled through a notable support area at 1487.9-1470.2, shaped by way of a near-full-bodied bearish candle, XAU/USD retested the underside of the said base and has so far remained firm. Further rejection off the underside of 1487.9-1470.2 potentially sets the long-term stage for a move towards two layers of support at 1392.0 and 1417.8.
Daily perspective:
With respect to daily positioning, the candles remain confined within a descending channel formation (taken from the high 1557.1 and a low of 1484.6). Price continues to defend the top edge of a support area coming in at 1448.9-1419.9 (aligns closely with a 38.2% Fibonacci retracement ratio at 1448.5), bolstered by the completion of a three-drive pattern (black arrows).
H4 perspective:
As highlighted in Friday’s technical briefing, the H4 ascending wedge, formed since bottoming at 1445.5, had its lower edge give way in recent trade, suggesting a run lower may be on the cards. The take-profit target for an ascending wedge can be measured by taking the size of the base and applying the value to the breakout point (black arrows); in this case, 1437.7.
Friday concluded the week outside of the said wedge configuration, though not before retesting the underside of October’s opening level at 1472.8.
Areas of consideration:
Shorts at current price remain an option. Stop-loss placement, however, depends on risk appetite. Ultimately, structure on the H4 scale recommends stop-loss placement either above October’s opening level at 1472.8 or beyond the upper edge of the wedge pattern.
The top edge of the daily support area: 1448.9 is considered an initial take-profit target, followed by 1437.7.
The accuracy, completeness and timeliness of the information contained on this site cannot be guaranteed. IC Markets does not warranty, guarantee or make any representations, or assume any liability regarding financial results based on the use of the information in the site.
News, views, opinions, recommendations and other information obtained from sources outside of www.icmarkets.com.au, used in this site are believed to be reliable, but we cannot guarantee their accuracy or completeness. All such information is subject to change at any time without notice. IC Markets assumes no responsibility for the content of any linked site.
The fact that such links may exist does not indicate approval or endorsement of any material contained on any linked site. IC Markets is not liable for any harm caused by the transmission, through accessing the services or information on this site, of a computer virus, or other computer code or programming device that might be used to access, delete, damage, disable, disrupt or otherwise impede in any manner, the operation of the site or of any user’s software, hardware, data or property.


