
EUR/USD:
Weekly gain/loss: -0.21%
Weekly close: 1.1299
Weekly perspective:
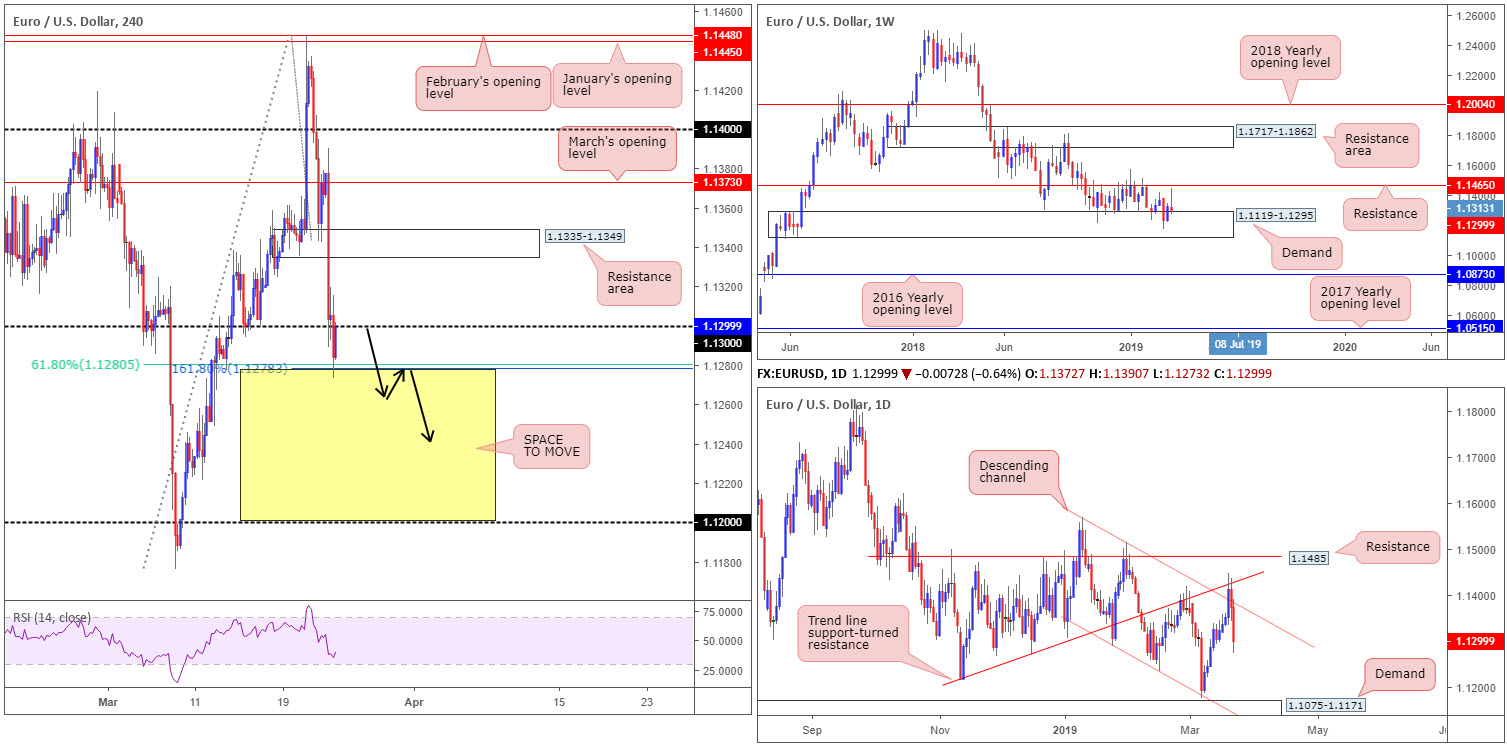
Although braced by demand coming in at 1.1119-1.1295, the unit failed to shake hands with nearby resistance at 1.1465 last week and concluded in the shape of a bearish pin-bar formation.
Overall, the long-term trend on this timeframe continues to face a southerly direction. The next area of interest beyond the current demand falls in around the 2016 yearly opening level priced in at 1.0873.
Daily perspective:
Wednesday observed the pair push through channel resistance (extended from the high 1.1569), reaching highs at 1.1448. Possibly drawing in a truckload of breakout buyers above here, many likely suffered a swift loss given the move crossed swords with a nearby trend line support-turned resistance (etched from the low 1.1216).
With the unit charging lower over the course of Thursday and Friday’s sessions (dragging the candles back within the walls of the descending channel pattern), the research team maintains a fairly pessimistic outlook on this timeframe given the room seen for the pair to push as far south as demand coming in at 1.1075-1.1171.
H4 perspective:
Dismal German and Eurozone manufacturing PMIs kicked Friday off on a negative footing, stoking fears of recession in the German manufacturing sector. Couple this with a robust US dollar, the EUR/USD, over the space of 30 minutes, declined almost 0.60% (see M30 chart for a clearer view).
Follow-through selling came to life as US traders entered the fold, conquering 1.13 and testing support by way of a 61.8% Fibonacci level at 1.1280 and a 161.8% Fibonacci extension point at 1.1278. As is evident from the chart, though, the week concluded testing the underside of 1.13.
Areas of consideration:
The space beneath 1.1280/1.1278 (yellow) is appealing this week for shorts. To the left, limited demand is visible, with the next port of interest falling in around 1.12, parked less than 30 points above the top edge of daily demand at 1.1171. Should we push through 1.1280/1.1278 this week and retest the area as resistance (black arrows), a sell (using the rejecting candlestick’s structure to base entry and risk levels) could be an option. The only grumble is weekly demand mentioned above at 1.1119-1.1295, despite the timeframe printing a bearish pin-bar foundation.
A break above 1.13, on the other hand, has a H4 resistance area at 1.1335-1.1349 in sight, which may hold should a test be seen this week. The more attractive area for sellers, however, is likely above here around March’s opening level at 1.1373, as it fuses closely with the current daily channel resistance.
Today’s data points: German IFO Business Climate.
GBP/USD:
Weekly gain/loss: -0.61%
Weekly close: 1.3204
Weekly perspective:
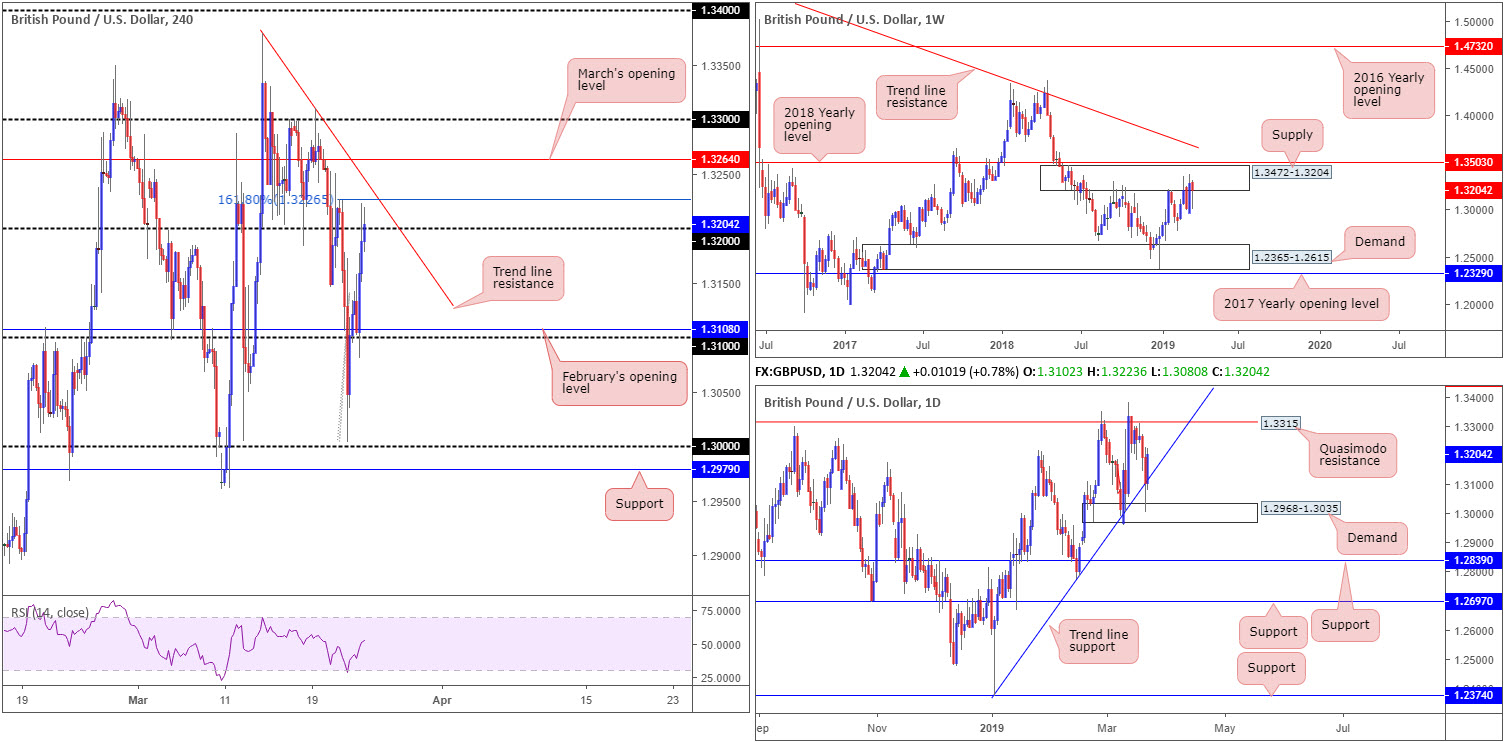
Focus on the weekly timeframe remains around the underside of a supply zone pictured at 1.3472-1.3204. Since the end of February this has been home to many traders as price flipped between gains/losses.
In view of the number of times this area has been tested since July 2018, the supply’s foundation is likely weakened, giving rise to a possible advance towards the 2018 yearly opening level at 1.3503.
Daily perspective:
The stop run through trend line support (extended from the low 1.2373) into nearby demand plotted at 1.2968-1.3035 Thursday provoked a round of buying Friday, up 0.78% on the day. Erasing all of Thursday’s losses, Friday’s move may encourage further buying today/early week in the direction of Quasimodo resistance at 1.3315.
Beyond 1.3315, resistance at 1.3465 will likely be drawn back into the spotlight (not seen on the screen).
H4 perspective:
Sterling drew some comfort from the fact the EU granted an extension to the Article 50 negotiating period until April 12. In spite of an advancing dollar, the British pound retested 1.31 Friday as support and reclaimed 1.32+ status into the week’s end.
While buyers may interpret the close above 1.32 as positive, neighbouring resistance is awkward. A 161.8% Fibonacci extension at 1.3226 is the first point of concern, shadowed closely by a trend line resistance (etched from the high 1.3379) and then March’s opening level at 1.3264.
Areas of consideration:
According to our studies, technical elements remain mixed. Selling is emphasised on the weekly timeframe from supply at 1.3472-1.3204, though buyers are supported on the daily timeframe from the current trend line support. H4 action also shows rough terrain above 1.32 for a long. A rejection off 1.32 this week does, however, show potential to the downside towards 1.31ish. The problem here, though, is you’d be selling directly into potential daily buying, despite the number corroborating with weekly supply.
Unless you’re comfortable shorting below 1.32, knowing daily buyers could potentially enter the mix, the research team have come to the conclusion this market may be best left on the back burner today.
Today’s data points: Limited.
AUD/USD:
Weekly gain/loss: -0.04%
Weekly close: 0.7079
Weekly perspective:
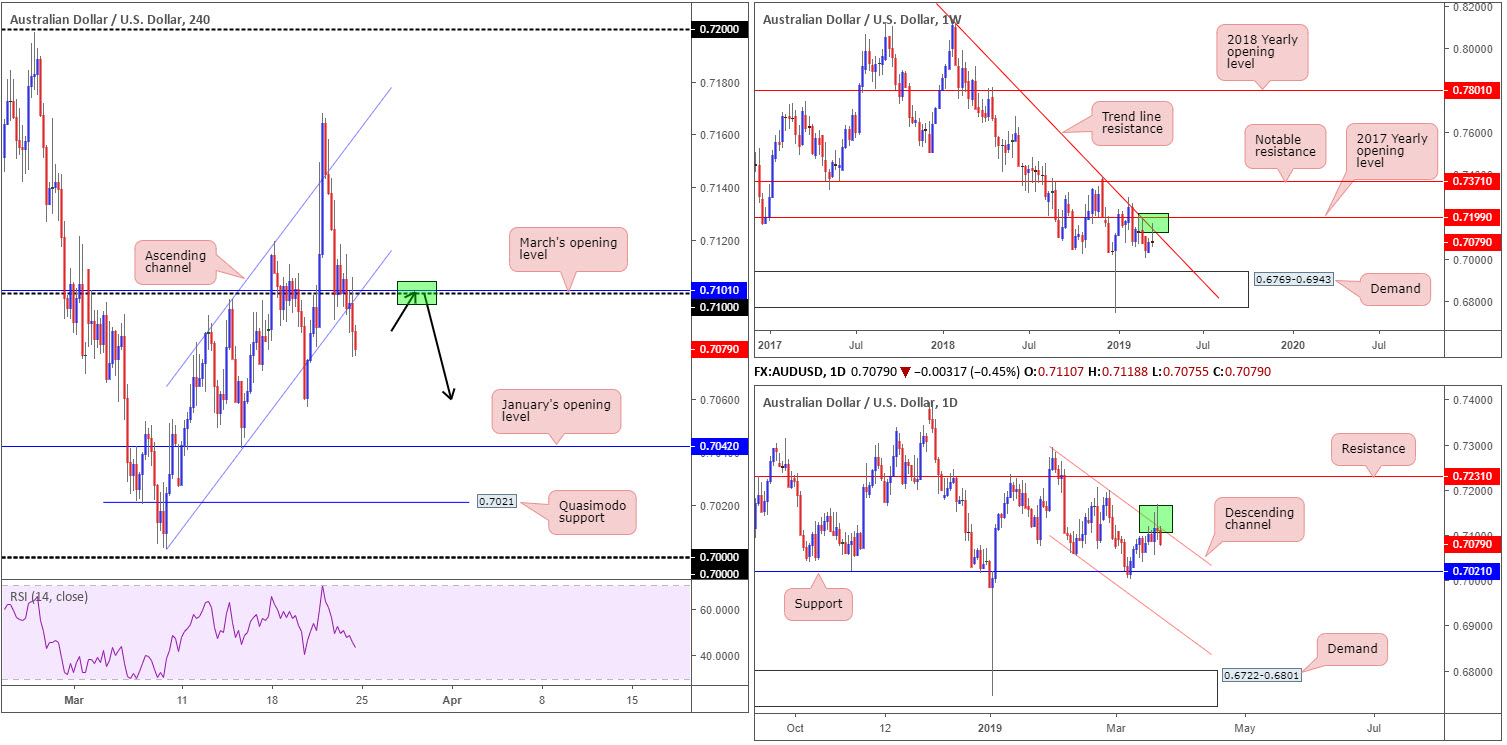
Ranging more than 100 pips last week, the market developed an attractive bearish pin-bar pattern. What’s also notable from a technical perspective is the pattern emerged around a long-standing trend line resistance (etched from the high 0.8135). Likely of interest to candlestick traders this week, the market could observe additional selling take shape as downside appears reasonably free until connecting with demand pencilled in at 0.6769-0.6943.
Daily perspective:
Daily flow continues to compress within a descending channel (high: 0.7295 low: 0.7060), with the market drawing in the upper limit of this formation last week. Friday responded by way of a near-full-bodied bearish candle, placing the spotlight on a possible move to nearby support at 0.7021 this week.
H4 perspective:
Friday’s selling, bolstered by dollar demand, hauled the H4 candles sub 0.71 (and merging March’s opening level at 0.7101) as well as a channel support (drawn from the low 0.7003). The move potentially set the stage for a run towards last Wednesday’s low 0.7056, followed by January’s opening level at 0.7042.
Areas of consideration:
Keeping it short and simple this week, a retest of 0.71 as resistance (black arrows) is considered a strong sell signal given the overall technical picture (entry and stop-loss placement can be determined on the rejecting candle’s structure), targeting H4 supports highlighted above in bold.
Today’s data points: RBA Assist Gov. Ellis Speaks.
USD/JPY:
Weekly gain/loss: -1.39%
Weekly close: 109.90
Weekly perspective:
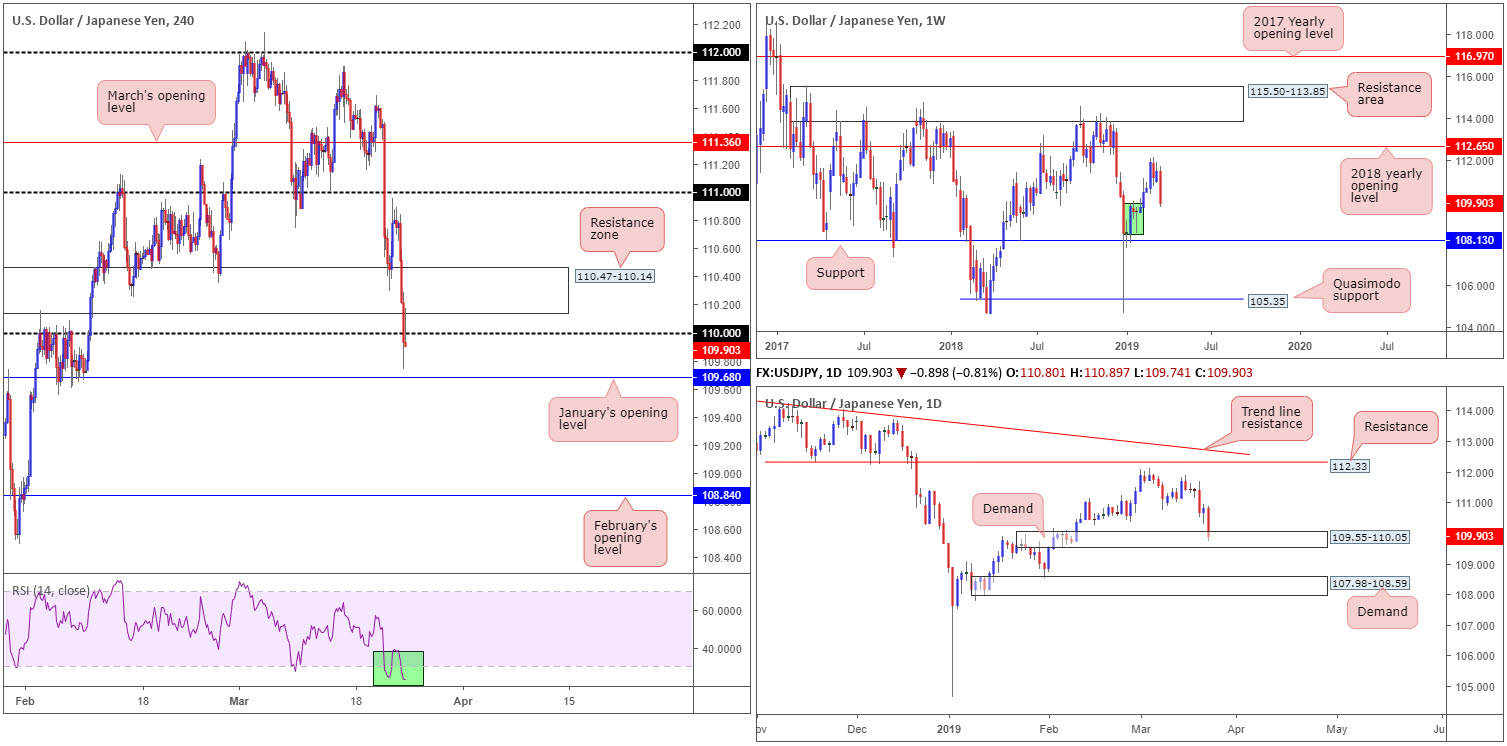
Regardless of weekly price leaving its 2018 yearly opening level at 112.65 unchallenged, the pair charged south in strong fashion last week, closing in the mould of a near-full-bodied candle. Although a response from nearby demand marked in green at 108.49/109.74 could be seen this week, support at 108.13 is the more appealing level for buyers on this timeframe. By and of itself, the aforesaid demand area achieved very little in terms of breaking anything significant to the left.
Daily perspective:
A closer reading on the daily timeframe exposes demand at 109.55-110.05. Formed on the break of the 109.95 Jan 25 high, the area has yet to be tested. Friday’s strong push into the zone is a concern, though given this area is reasonably fresh buyers could still make an appearance.
In the event we do push lower this week, however, demand at 107.98-108.59 is next on the hit list. Unlike the current demand base, this area was already tested back on Jan 31, therefore traders can expect a slightly deeper push into the zone in order to draw in fresh buyers.
H4 perspective:
Demand for the Japanese yen picked up pace Friday following the release of disappointing German and Eurozone manufacturing PMIs, fuelling concerns regarding the health of the global economy. Further acceleration to the downside followed, seemingly taking cues from tumbling US Treasury yields.
Technical flows on the H4 timeframe show price action swept through a support area coming in at 110.47-110.14, and marginally engulfed 110 to the downside. The H4 close beyond 110 is interesting as the final H4 candle for the week retested both the underside of the psychological mark and also the underside of the broken support area (now acting resistance). Presented in the form of a bearish pin-bar pattern, this is likely to attract sellers today.
Areas of consideration:
Although the H4 bearish pin-bar pattern is a tempting short, neighbouring support on the H4 timeframe falls in close by at 109.68 (January’s opening level). Further adding to this is the current daily demand area highlighted above at 109.55-110.05, along with the possibility of weekly buyers entering the market from the top edge of minor demand at 109.74. With a considerable number of red flags warning a sell from current price may not be the path to take, sellers are urged to exercise caution.
Buying, according to our technical reading, is possible once/if we reclaim position back above the H4 resistance area at 110.47-110.14.
Today’s data points: Limited.
USD/CAD:
Weekly gain/loss: +0.69%
Weekly close: 1.3426
Weekly perspective:
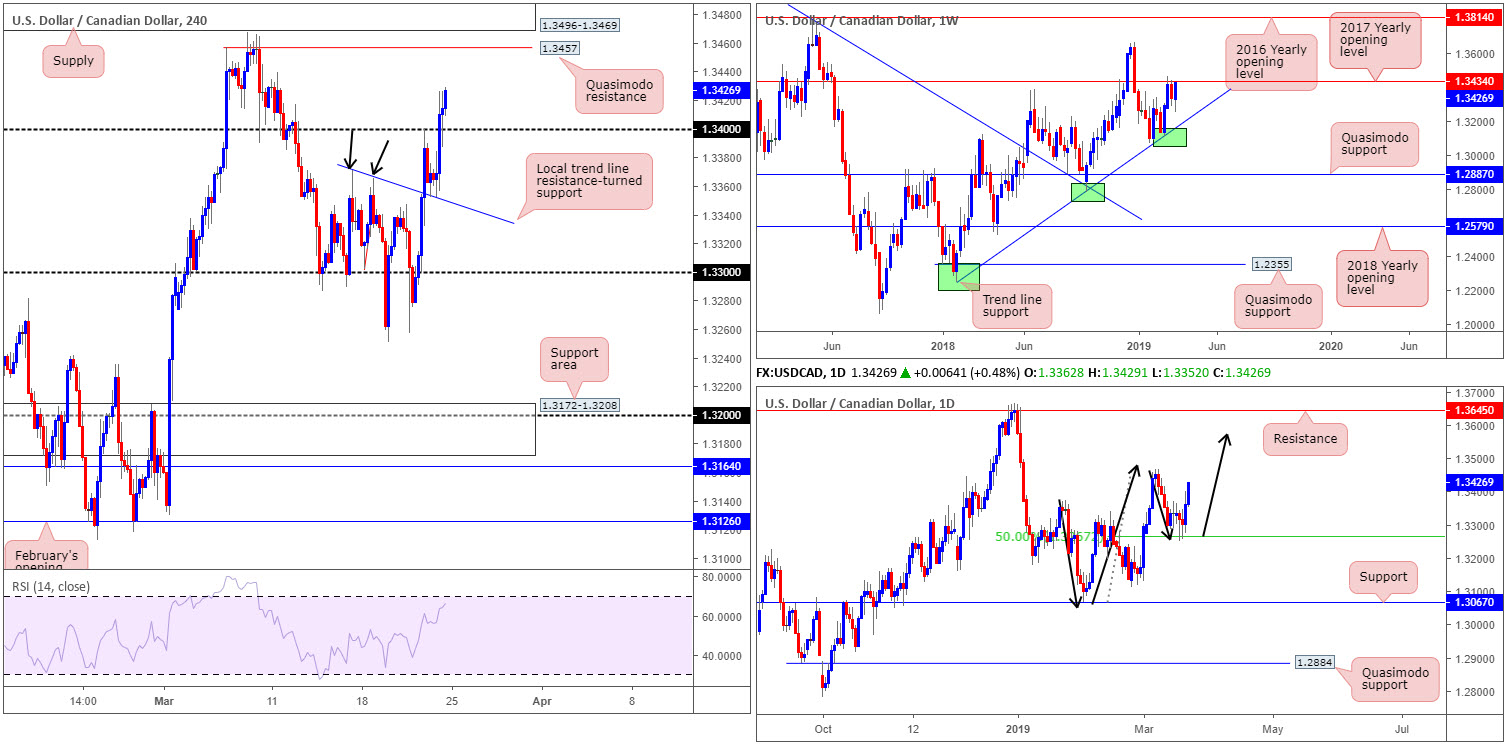
In recent weeks, the USD/CAD has been engaging with notable resistance at 1.3434 (the 2017 yearly opening level) following an impressive rally from trend line support (taken from the low 1.2247). Should price action run through 1.3434 this week, keep tabs on the 1.3664 Dec 31 high, followed reasonably closely by the 2016 yearly opening level at 1.3814.
Daily perspective:
On the other side of the spectrum, daily action indicates it may be poised to approach higher ground this week. The higher high sported on March 7th at 1.3467 followed by a 50.0% retracement to 1.3265 which held firm, places the buyers in good stead to overthrow the said high and explore higher ground.
H4 perspective:
Mixed Inflation and retail sales figures out of Canada, as well as a reasonably strong dollar bid across the board and WTI energetically charging lower Friday ultimately provided fresh impetus for buyers. Local trend line resistance-turned support (extended from the high 1.3371) served as a strong base, allowing buyers to wash through orders at 1.34 and perhaps unlock upside towards Quasimodo resistance at 1.3457, tailed closely by supply at 1.3496-1.3469. Note above 1.34, limited (fresh) supply is visible to the left of the current price until reaching the aforesaid Quasimodo. It may also be of interest to some traders the RSI indicator is seen nearing its overbought value.
Areas of consideration:
Although the path is reasonably free of resistance above 1.34 on the H4 timeframe towards 1.3457, it’s worth pointing out the 2017 yearly opening level mentioned above on the weekly timeframe at 1.3434 may hinder upside, alongside the possibility of daily price potentially stumbling prior to reaching its noted high. This could trap breakout buyers above 1.34 today.
Should our analysis be correct and the market does indeed pause today/early week, a H4 close back beneath 1.34 may be of interest to some traders. A retest to the underside of this barrier (preferably in the shape of a H4 bearish candlestick signal as this provides entry/risk levels to work with) opens up a possible intraday sell (black arrows) back to the local trend line resistance-turned support highlighted above.
Today’s data points: Limited.
USD/CHF:
Weekly gain/loss: -0.87%
Weekly close: 0.9932
Weekly perspective:
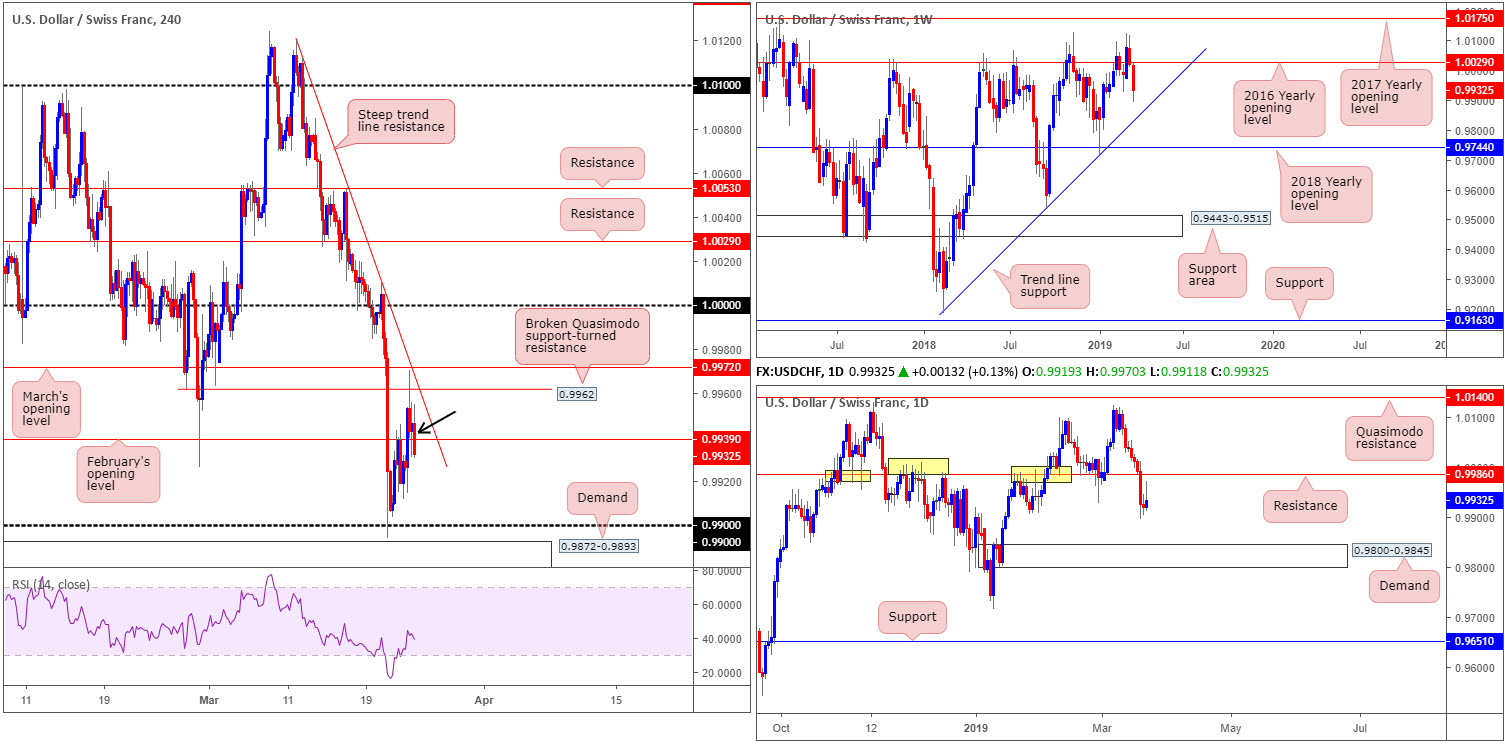
In spite of the unit reaching highs at 1.0124 in recent trading, the last couple of weeks saw the USD/CHF give way to lower ground, recording a firm position beneath the 2016 yearly opening level at 1.0029. Having seen this level cap upside since May 2017, lower levels are promising this week with the next area of interest to the downside seen at a trend line support (extended from the low 0.9187).
Daily perspective:
Daily flow, aside from the 0.9905 Jan 28 low that appears to be holding as temporary support, also demonstrates potential to charge as far south as demand plotted at 0.9800-0.9845. Friday’s closing candle (a reasonably nice-looking bearish pin-bar formation) will likely encourage candlestick sellers into the market today/early week, with an initial target objective set at demand taken from 0.9800-0.9845. However, do remain cognizant of the possibility a test of resistance at 0.9986 could also come to fruition.
H4 perspective:
Against the backdrop of higher-timeframe flows, a brief overview of Friday’s movement on the H4 timeframe shows the unit connected with a broken Quasimodo support-turned resistance at 0.9962 and sold off (0.9962 merges close by a steep trend line resistance [drawn from the high 1.0119] and March’s opening level at 0.9972). As you can see, this positioned things marginally beneath February’s opening level at 0.9939 into the close, with 0.99 eyed as viable support today, trailed closely by demand pencilled in at 0.9872-0.9893.
Areas of consideration:
Both weekly and daily timeframes suggest a possible move lower this week, therefore should the H4 candles remain defensive below February’s opening level at 0.9939 on the H4 timeframe, an intraday short position could be in the offing to 0.99ish. Rather than selling Friday’s breakout candle (black arrow) traders are urged to drill down to the lower timeframes and attempt entry there. This should lower risk and ultimately increase reward towards 0.99, which is where price may encounter prepared buyers.
On more of a medium-term perspective, higher-timeframe sellers could eventually pull the pair beyond the noted H4 demand to 0.9800-0.9845 (daily demand) which happens to merge with the current weekly trend line support. This daily demand, therefore, is a valid zone worthy of the watch list for a potential long in the near future.
Today’s data points: Limited.
Dow Jones Industrial Average:
Weekly gain/loss: -1.37%
Weekly close: 25505
Weekly perspective:
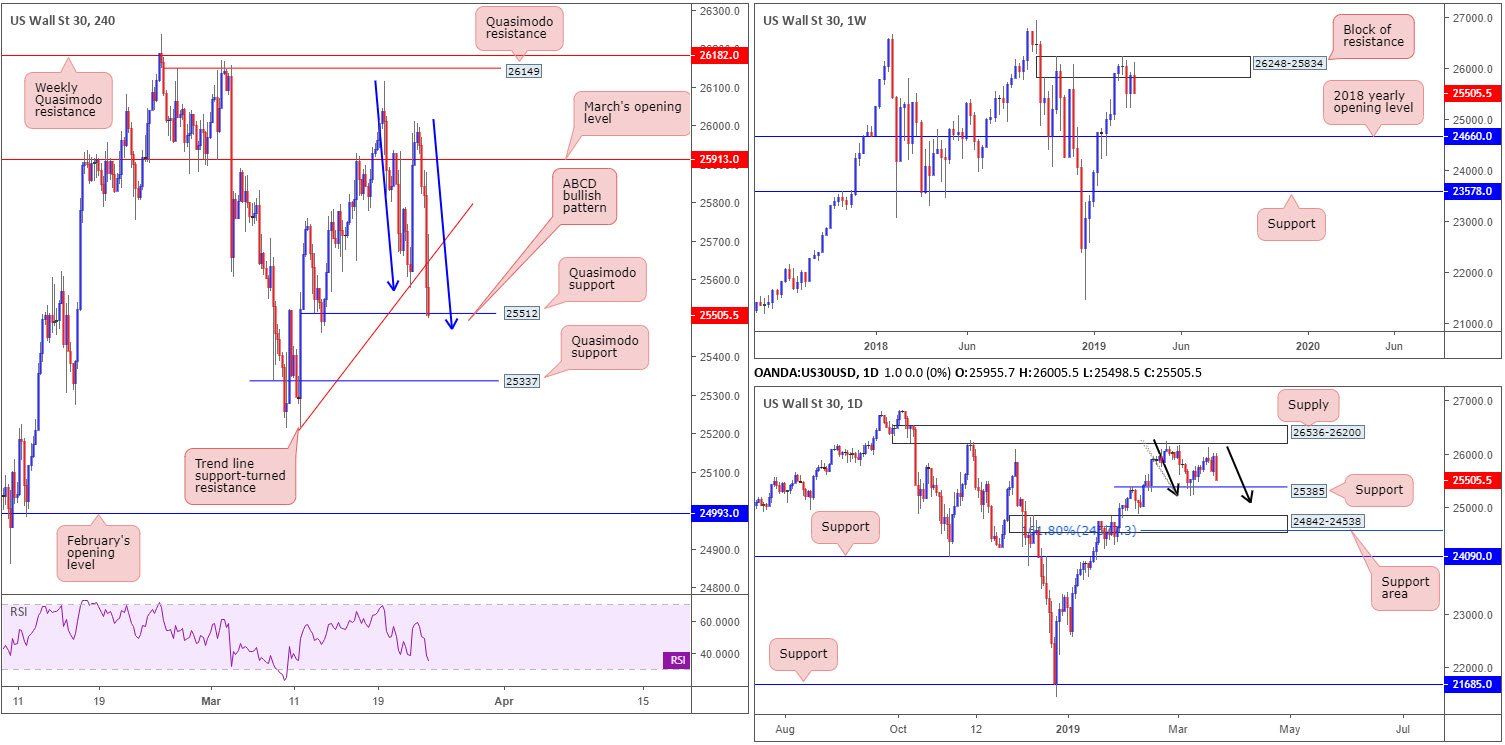
Since early February, traders have called a block of resistance at 26248-25834 home. Last week’s response from this barrier was of notable strength, closing not too far off its lows. Further downside from this point could eventually see the index knocking on the door of its 2018 yearly opening level at 24660.
Daily perspective:
Support at 25385 along with a nearby supply coming in at 26536-26200 are in focus on this timeframe, as is a possible ABCD bullish motion (black arrows) terminating around 25112. Traders may also want to acknowledge a support area seen at 24842-24538 which holds within it a 161.8% Fibonacci extension at 24588 (an addition to the aforesaid ABCD formation).
H4 perspective:
Thanks to Friday’s bearish descent, the H4 candles overthrew trend line support (marked from the low 25215) and shook hands with Quasimodo support at 25512. Note this level also resides close by an ABCD bullish completion point at 25498 (blue arrows). Therefore, buyers and sellers will likely battle for position between these levels today. Continued selling has another layer of Quasimodo support in view at 25337, whereas buying back above the current trend line could potentially pull the unit as far north as March’s opening level at 25913.
Areas of consideration:
With room seen for the market to extend lower on both the weekly and daily timeframes this week, at least until reaching daily support at 25385, it’s likely the H4 Quasimodo support at 25512 and its aligning ABCD formation will give way to H4 Quasimodo support at 25337.
On account of the above reading, the research team believes a bounce from 25337 could be in the offing this week, due to the level fusing closely with daily support priced in at 25385. The only caveat here, of course, is the threat of selling on the weekly timeframe towards 24660. As such, trading 25337 with additional confirmation, be it on the H4 or lower timeframes, is recommended. Not only will this help identify buyer interest, it’d also provide entry and risk levels to work with.
Today’s data points: Limited.
XAU/USD (GOLD):
Weekly gain/loss: +0.86%
Weekly close: 1313.1
Weekly perspective:
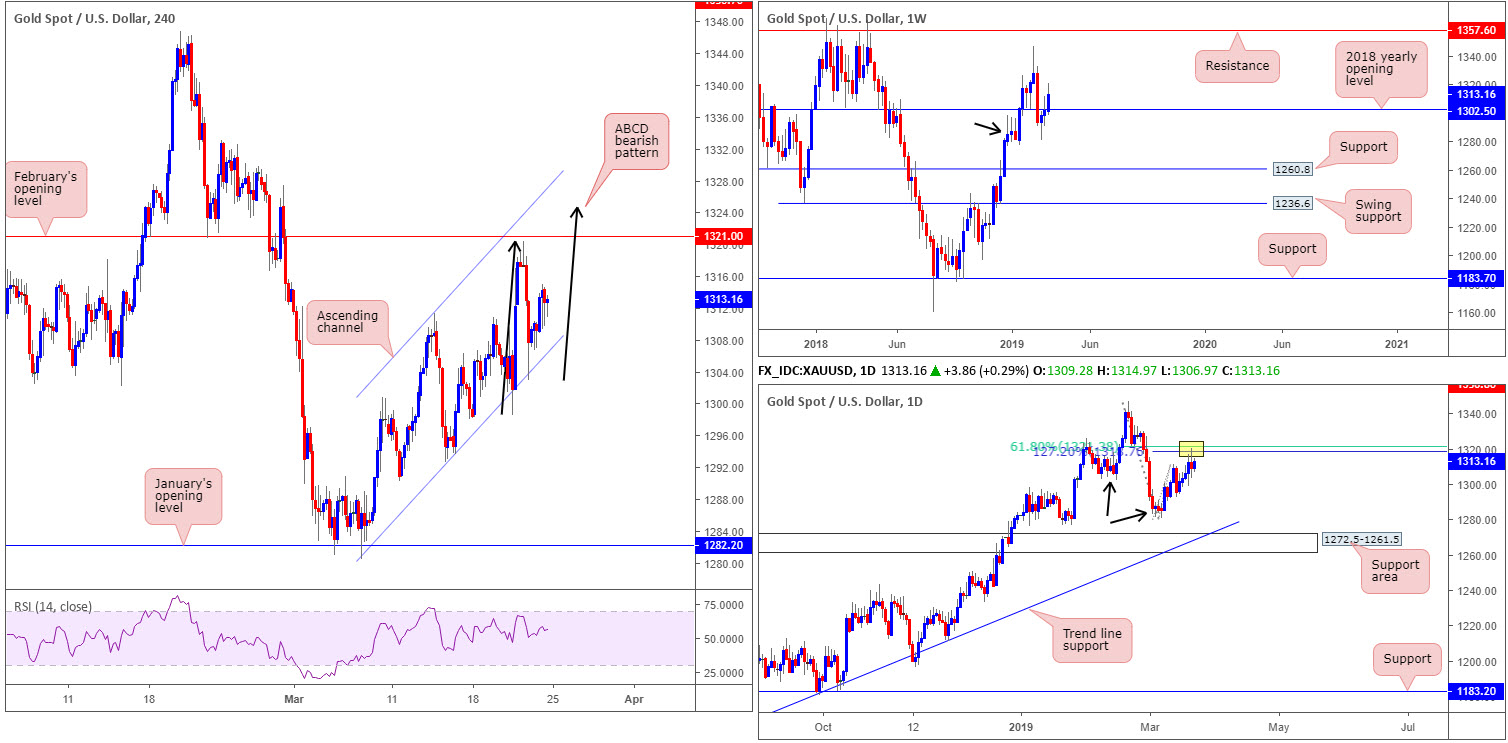
Over the past three weeks, the market has been engaging with a demand area at 1276.9-1298.5 (black arrow), pressuring the candles beyond its 2018 yearly opening level at 1302.5. Last week’s advance, as you can see, firmly elbowed the unit above 1302.5, positioning the yellow metal in good stead for a continuation move north this week, targeting the 1346.7 Feb 18 high, as well as nearby resistance parked at 1357.6.
Daily perspective:
Capping upside on the daily timeframe, however, is the 1321.3/1318.7 area: a 61.8% Fibonacci resistance and 127.2% Fibonacci ext. point. This area appeared on the radar following a lower low taking shape at 1281.0 (March 7), breaking the 1302.4 Feb 14 low (black arrows). The question is whether this area has enough clout to withstand weekly buying and force a dip lower this week?
H4 perspective:
Since forming the 1281.0 March 7 low mentioned above, the H4 candles have been entrenched within an ascending channel formation, with channel support (taken from the low 1280.4) holding ground Thursday. Assuming further upside materialises from here, the next port of call falls in around February’s opening level at 1321.0.
Areas of consideration:
Having seen weekly price hold firm above 1302.5 last week, a move towards 1321.0 on the H4 timeframe is a possibility this week. The research team expects reasonably strong selling to emerge from here, given it aligns closely with the 1321.3/1318.7 Fibonacci area on the daily timeframe and also a nearby ABCD bearish pattern on the H4 timeframe at 1324.6 (black arrows). An ideal target for a 1321.0 sell would be the H4 channel support highlighted above.
Traders concerned regarding the threat of further buying on the weekly timeframe may opt to wait for additional candlestick confirmation from 1321.0 before pulling the trigger. A H4 bearish pin-bar pattern printed would, owing to its surrounding confluence, certainly add weight to the area and also provide entry and stop-loss parameters.
The accuracy, completeness and timeliness of the information contained on this site cannot be guaranteed. IC Markets does not warranty, guarantee or make any representations, or assume any liability with regard to financial results based on the use of the information in the site.
News, views, opinions, recommendations and other information obtained from sources outside of www.icmarkets.com.au, used in this site are believed to be reliable, but we cannot guarantee their accuracy or completeness. All such information is subject to change at any time without notice. IC Markets assumes no responsibility for the content of any linked site. The fact that such links may exist does not indicate approval or endorsement of any material contained on any linked site.
IC Markets is not liable for any harm caused by the transmission, through accessing the services or information on this site, of a computer virus, or other computer code or programming device that might be used to access, delete, damage, disable, disrupt or otherwise impede in any manner, the operation of the site or of any user’s software, hardware, data or property.


