
DXY:
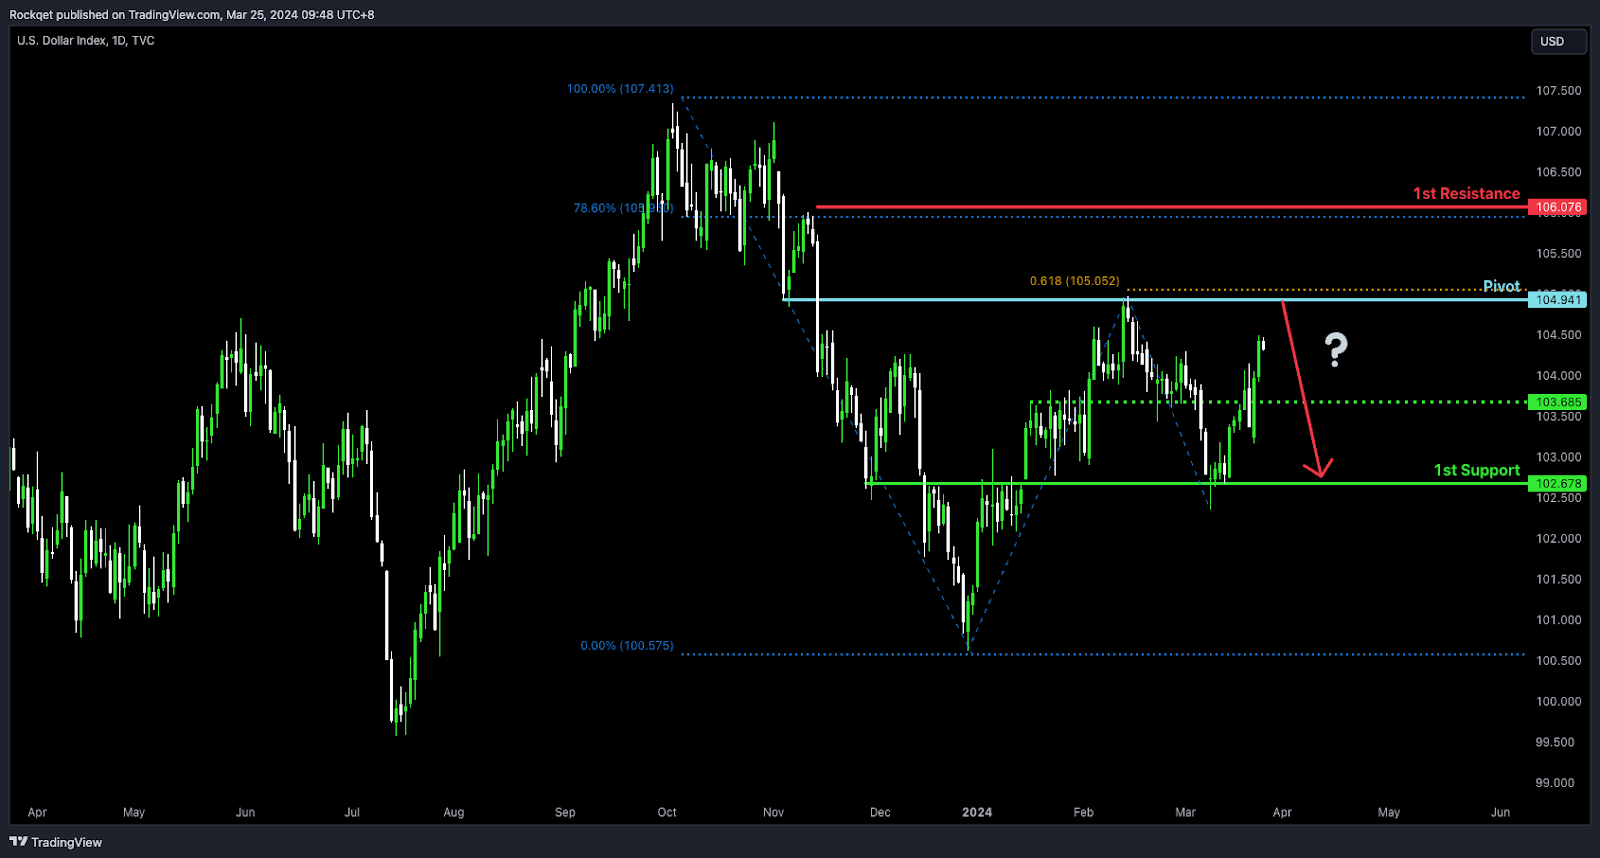
Potential Direction: Bearish
Overall momentum of the chart: Neutral
Price could potentially make a bearish reaction off pivot and drop to 1st support
Pivot: 104.94
Supporting reasons: This level acts as pullback resistance, aligning with a 61.80% Fibonacci projection. The convergence of these technical factors suggests it could be a turning point for the price, potentially initiating a bearish movement if the level holds as resistance.
1st Support: 102.67
Supporting reasons: The presence of an overlap support indicates a level where previously, buying interest was significant enough to halt declines and initiate recoveries. This historical significance, coupled with current market dynamics, suggests it might serve as a strong foundation should prices retreat from higher levels.
1st Resistance: 106.07
Supporting reasons: This level is significant due to its alignment with a 78.60% Fibonacci retracement, marking it as a critical threshold for bullish momentum to overcome. Resistance at this level could cap upside movements, making it a pivotal point for traders monitoring the potential for a bearish reversal.
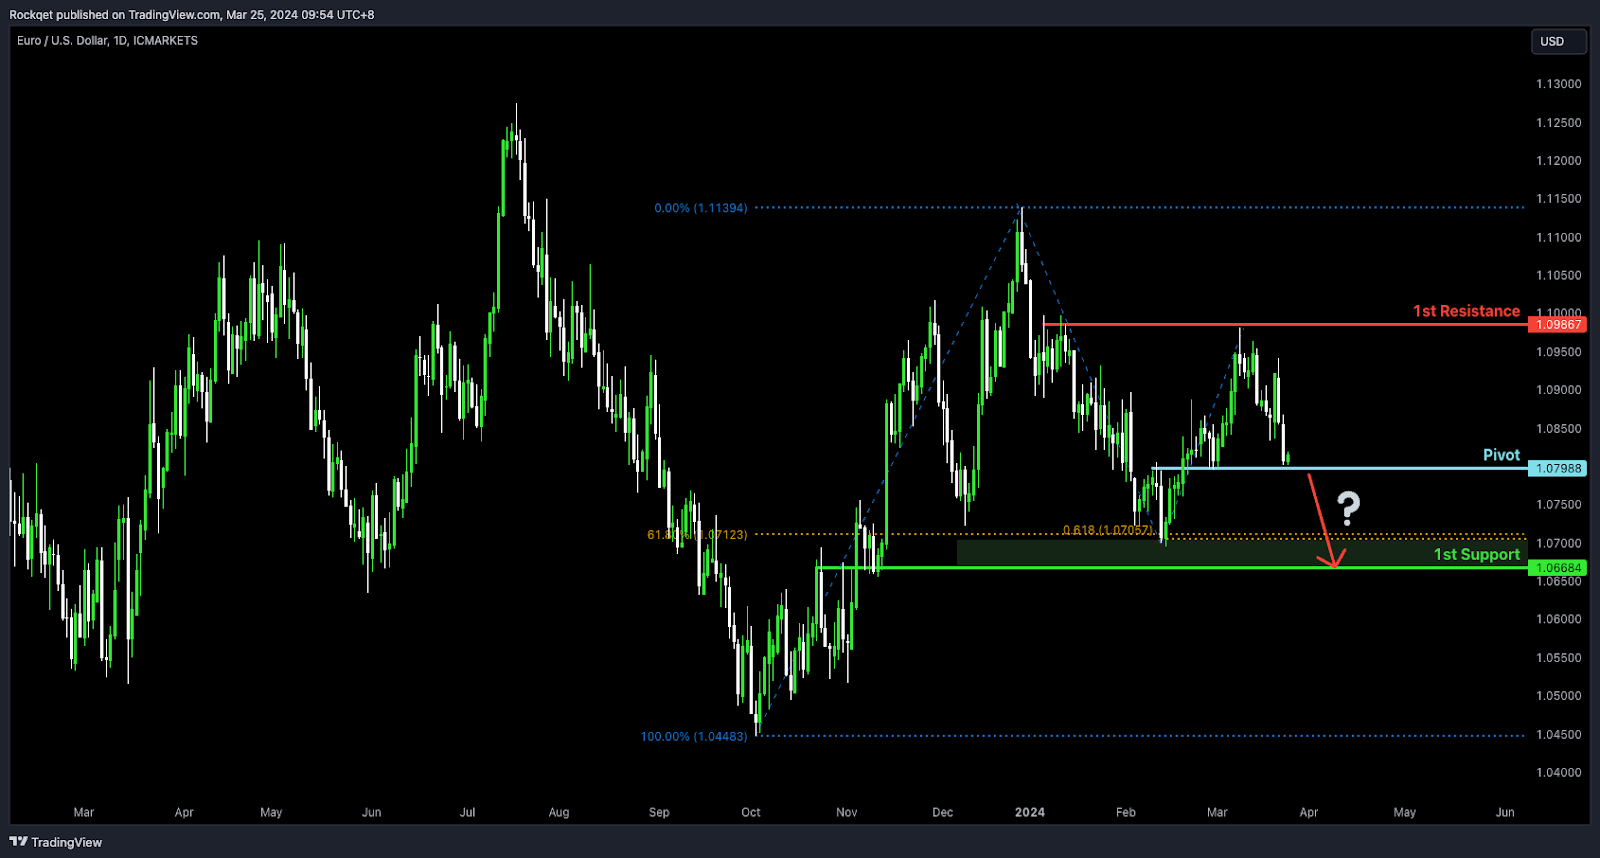
EUR/USD:
Potential Direction: Bearish
Overall momentum of the chart: Medium Bearish
Price could potentially make a bearish breakout below the pivot and drop towards the 1st support
Pivot: 1.0798
Supporting reasons: This level acts as an overlap support, aligning with a 61.80% Fibonacci retracement, which suggests it could be a turning point for the price, potentially initiating a bearish breakout if the level fails to hold as support.
1st Support: 1.0668
Supporting reasons: This level acts as an overlap support, aligning with a confluence of Fibonacci levels i.e. a 61.80% retracement and a 61.80% projection, indicating a level where previously buying interest was significant enough to halt declines and initiate recoveries.
1st Resistance: 1.0986
Supporting reasons: This level is identified as a pullback resistance, making it a critical threshold for bullish momentum to overcome. Resistance at this level could cap upside movements, making it a pivotal point for traders monitoring the potential for a bearish reversal.
Potential Direction: Bearish
Price could potentially make a bearish break off pivot and drop towards 1st support
Pivot: 1.0798
Supporting reasons: This pivot point is an overlap support and aligns with a 61.80% Fibonacci retracement level, marking it as a critical juncture. A bearish break below this pivot could signify the market’s decision to continue the downtrend.
1st Support: 1.0668
Supporting reasons: The first support level is not only marked by an overlap support but is also a 61.80% Fibonacci retracement and a 61.80% Fibonacci projection.
1st Resistance: 1.0986
Supporting reasons: Identified by multi-swing high resistance, this level has historically proven to be a formidable barrier for bullish advances.
EUR/JPY:
Potential Direction: Weak Bullish
Overall momentum of the chart: Bullish
Price could potentially make a bullish reaction off the pivot and rise towards the 1st resistance
Pivot: 163.53
Supporting reasons: This level acts as an overlap support, aligning with a 23.60% Fibonacci retracement, suggests it could be a turning point for the price, potentially initiating a bullish bounce if the level holds as support.
1st Support: 160.40
Supporting reasons: This level acts as a pullback support, aligning close to a 38.20% Fibonacci retracement, indicating a level where previously buying interest was significant enough to halt declines and initiate recoveries.
1st Resistance: 165.40
Supporting reasons: This level is identified as a pullback resistance, making it a critical threshold for bullish momentum to overcome. Resistance at this level could cap upside movements, making it a pivotal point for traders monitoring the potential for a bearish reversal.

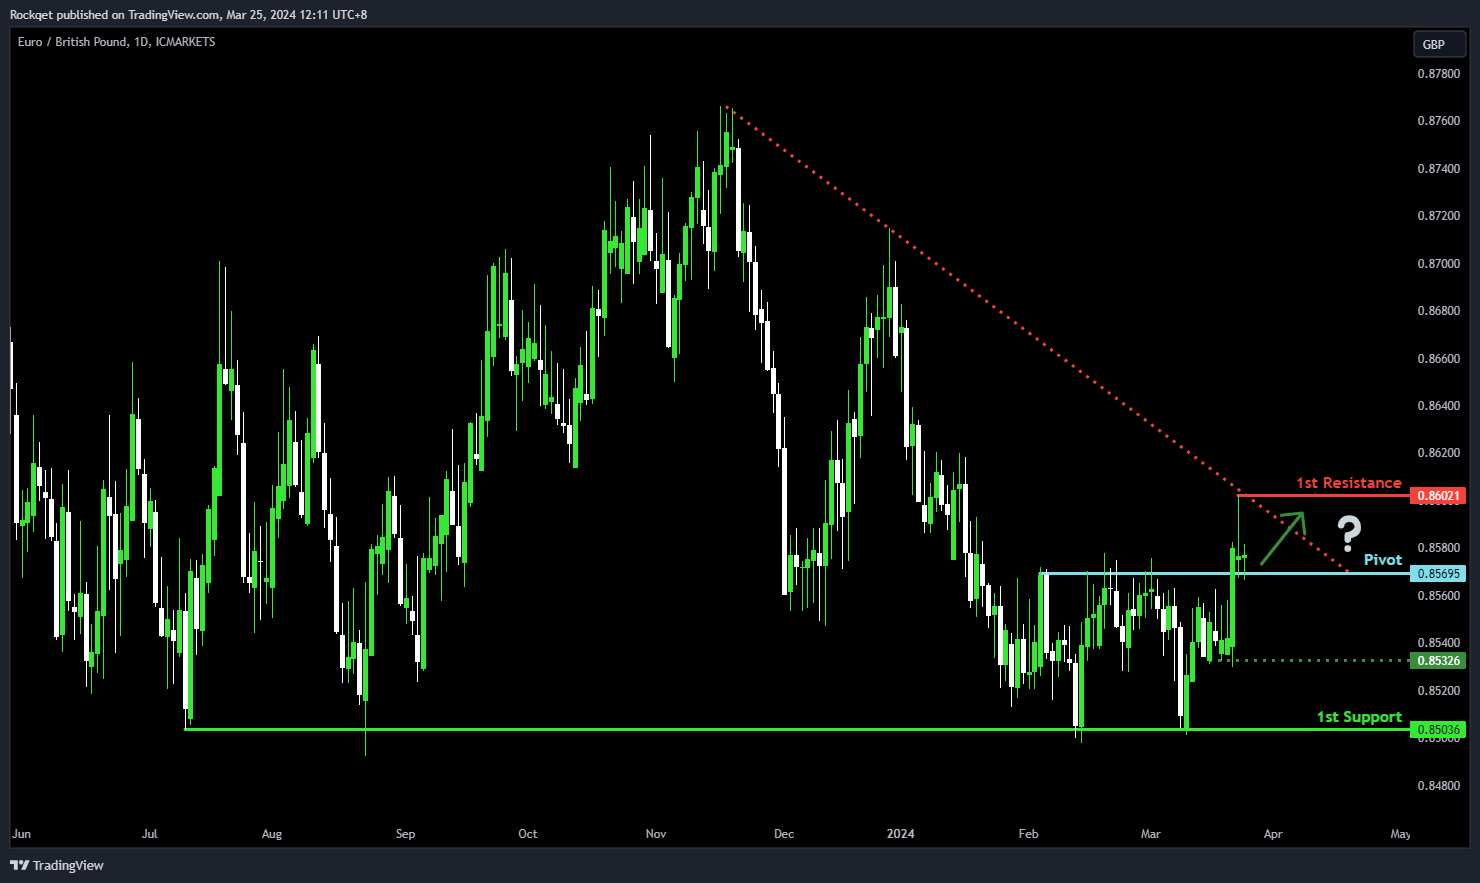
EUR/GBP:
Potential Direction: Weak Bullish
Overall momentum of the chart: Bearish
Price could potentially make a bullish reaction off the pivot and rise towards the 1st resistance
Pivot: 0.8569
Supporting reasons: This level acts as a pullback support which suggests it could be a turning point for the price, potentially initiating a bullish bounce if the level holds as support.
1st Support: 0.8503
Supporting reasons: This level acts a multi-swing-low support, indicating a level where previously buying interest was significant enough to halt declines and initiate recoveries.
1st Resistance: 0.8602
Supporting reasons: This level is identified as a pullback resistance that is bounded by a descending trendline, making it a critical threshold for bullish momentum to overcome. Resistance at this level could cap upside movements, making it a pivotal point for traders monitoring the potential for a bearish reversal.
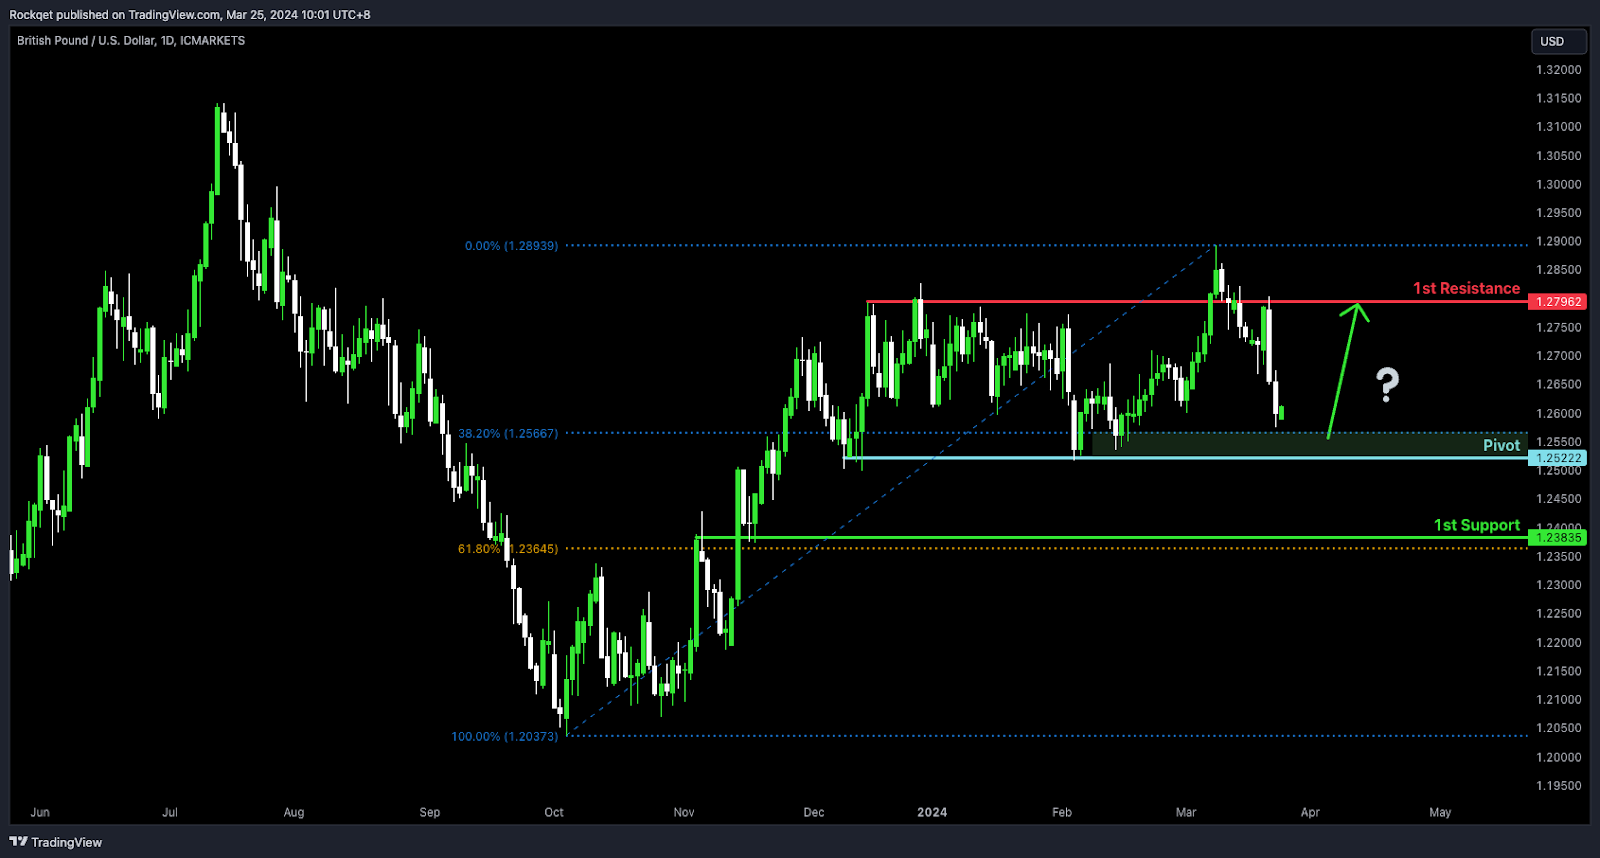
GBP/USD:
Potential Direction: Weak Bullish
Overall momentum of the chart: Neutral
Price could potentially make a bullish reaction off the pivot and rise towards the 1st resistance
Pivot: 1.2522
Supporting reasons: This level acts as a pullback support, aligning close to a 38.20% Fibonacci retracement, which suggests it could be a turning point for the price, potentially initiating a bullish bounce if the level holds as support.
1st Support: 1.2383
Supporting reasons: This level acts as an overlap support, aligning with a 61.80 Fibonacci retracement, indicating a level where previously buying interest was significant enough to halt declines and initiate recoveries.
1st Resistance: 1.2796
Supporting reasons: This level is identified as a pullback resistance, making it a critical threshold for bullish momentum to overcome. Resistance at this level could cap upside movements, making it a pivotal point for traders monitoring the potential for a bearish reversal.
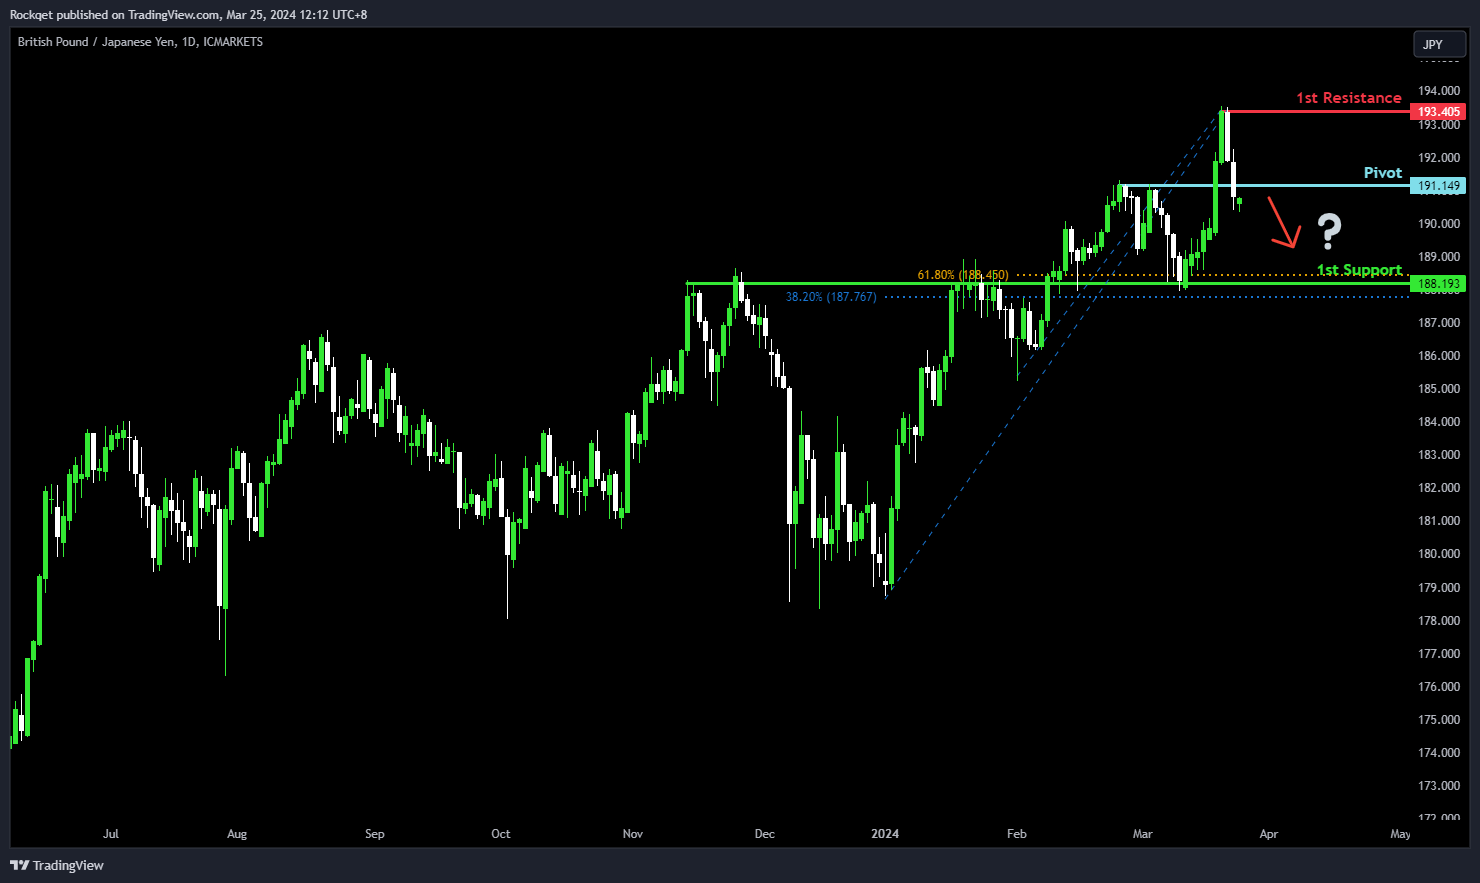
GBP/JPY:
Potential Direction: Weak Bullish
Overall momentum of the chart: Medium Bearish
Price could potentially make a bearish reaction off the pivot and drop towards the 1st support
Pivot: 191.14
Supporting reasons: This level acts as a pullback resistance which suggests it could be a turning point for the price, potentially initiating a bearish reversal if the level holds as resistance.
1st Support: 188.19
Supporting reasons: This level acts as an overlap support, aligning with a confluence of Fibonacci levels i.e. the 38.20% and 61.80% retracements, indicating a level where previously buying interest was significant enough to halt declines and initiate recoveries.
1st Resistance: 193.40
Supporting reasons: This level is identified as a pullback resistance, making it a critical threshold for bullish momentum to overcome. Resistance at this level could cap upside movements, making it a pivotal point for traders monitoring the potential for a bearish reversal.
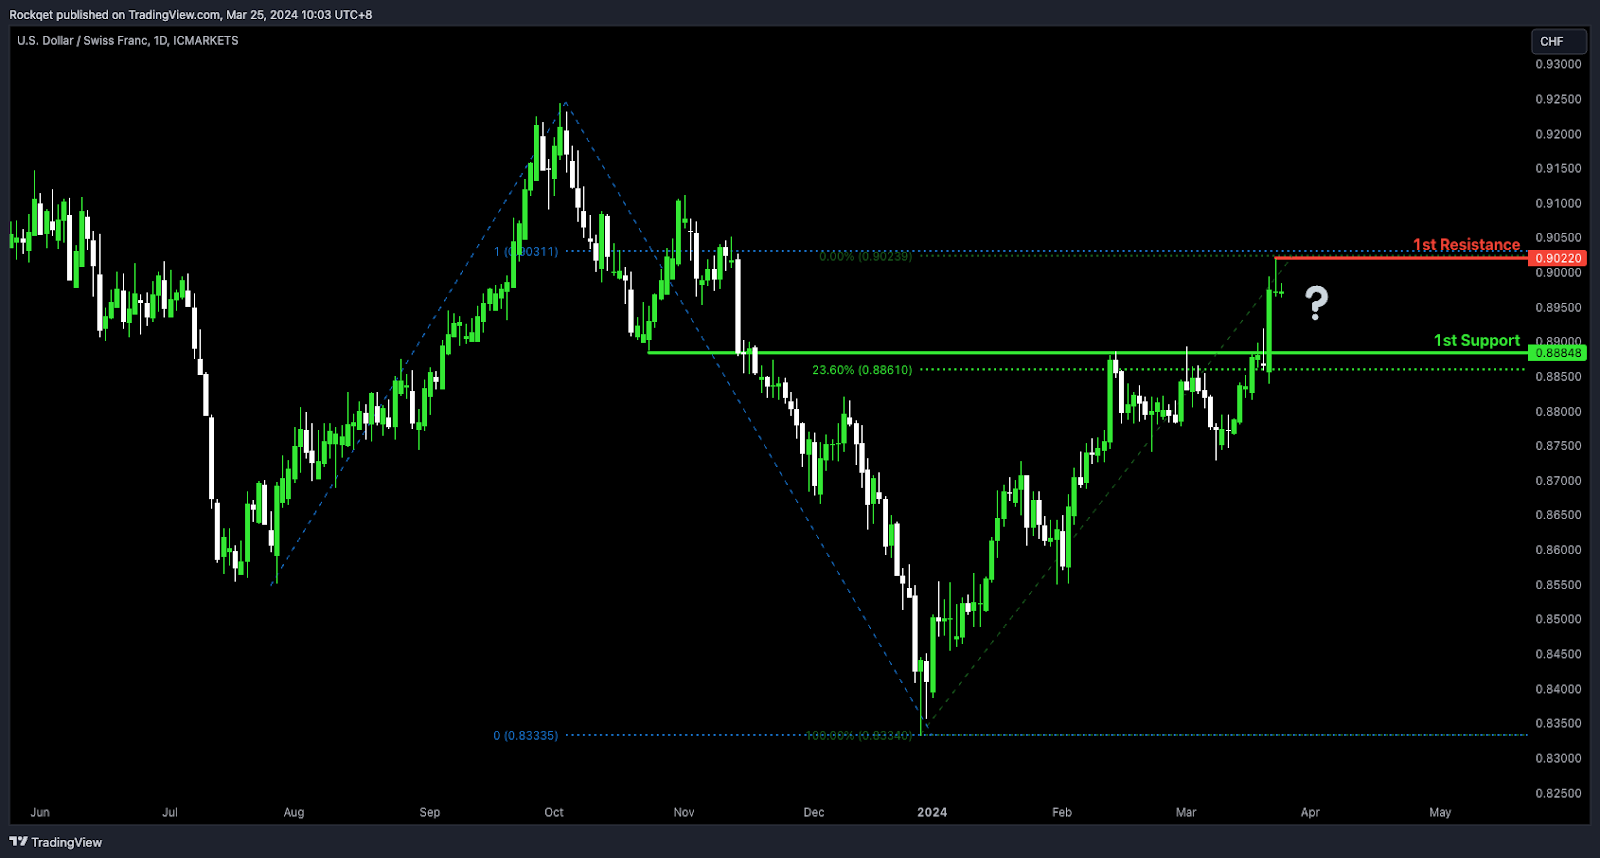
USD/CHF:
Potential Direction: Neutral
Overall momentum of the chart: Bullish
Price could potentially fluctuate between the 1st resistance and the 1st support
1st Support: 0.8848
Supporting reasons: This level acts as an overlap support, aligning close to a 23.60% Fibonacci retracement, indicating a level where previously buying interest was significant enough to halt declines and initiate recoveries.
1st Resistance: 0.9022
Supporting reasons: This level is identified as a pullback resistance level, aligning with a 100.00% Fibonacci projection, marking it as a critical threshold for bullish momentum to overcome. Resistance at this level could cap upside movements, making it a pivotal point for traders monitoring the potential for a bearish reversal.
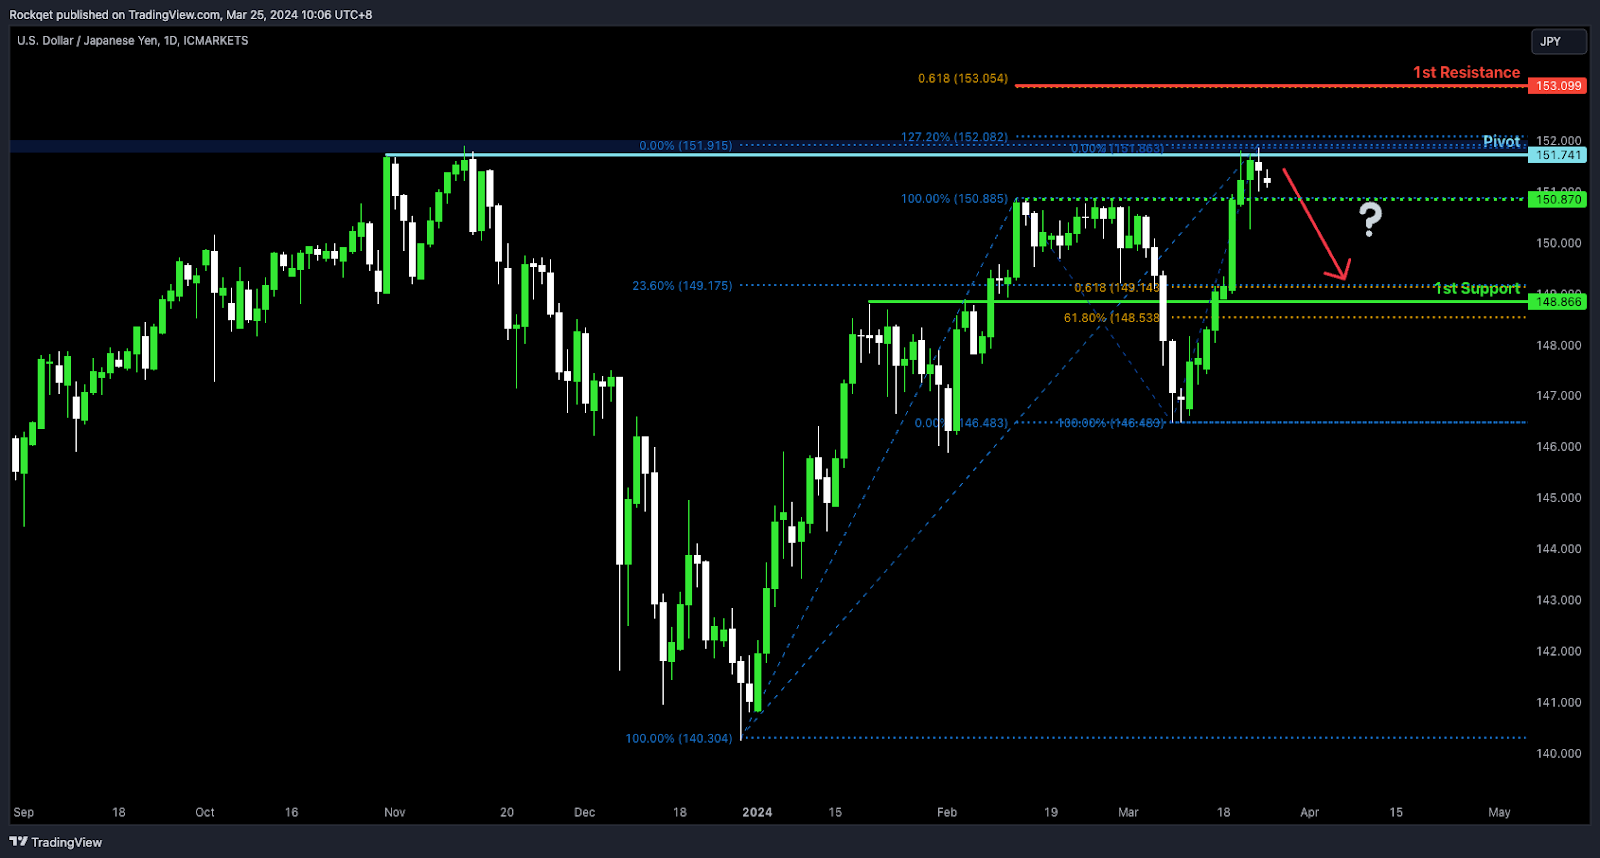
USD/JPY:
Potential Direction: Bearish
Overall momentum of the chart: Bullish
Price could potentially make a bearish reaction off the pivot and drop towards the 1st support
Pivot: 151.74
Supporting reasons: This level acts as a pullback resistance, aligning close to the 127.20% Fibonacci extension, suggests it could be a turning point for the price, potentially initiating a bearish reversal if the level holds as resistance.
1st Support: 148.86
Supporting reasons: This level acts an overlap support, aligning with a confluence of Fibonacci levels i.e. the 23.60% and 61.80% retracements and the 61.80% projection, indicating a level where previously buying interest was significant enough to halt declines and initiate recoveries.
1st Resistance: 153.05
Supporting reasons: This level is identified as a resistance level, aligning with a 61.80% Fibonacci projection, marking it as a critical threshold for bullish momentum to overcome. Resistance at this level could cap upside movements, making it a pivotal point for traders monitoring the potential for a bearish reversal.
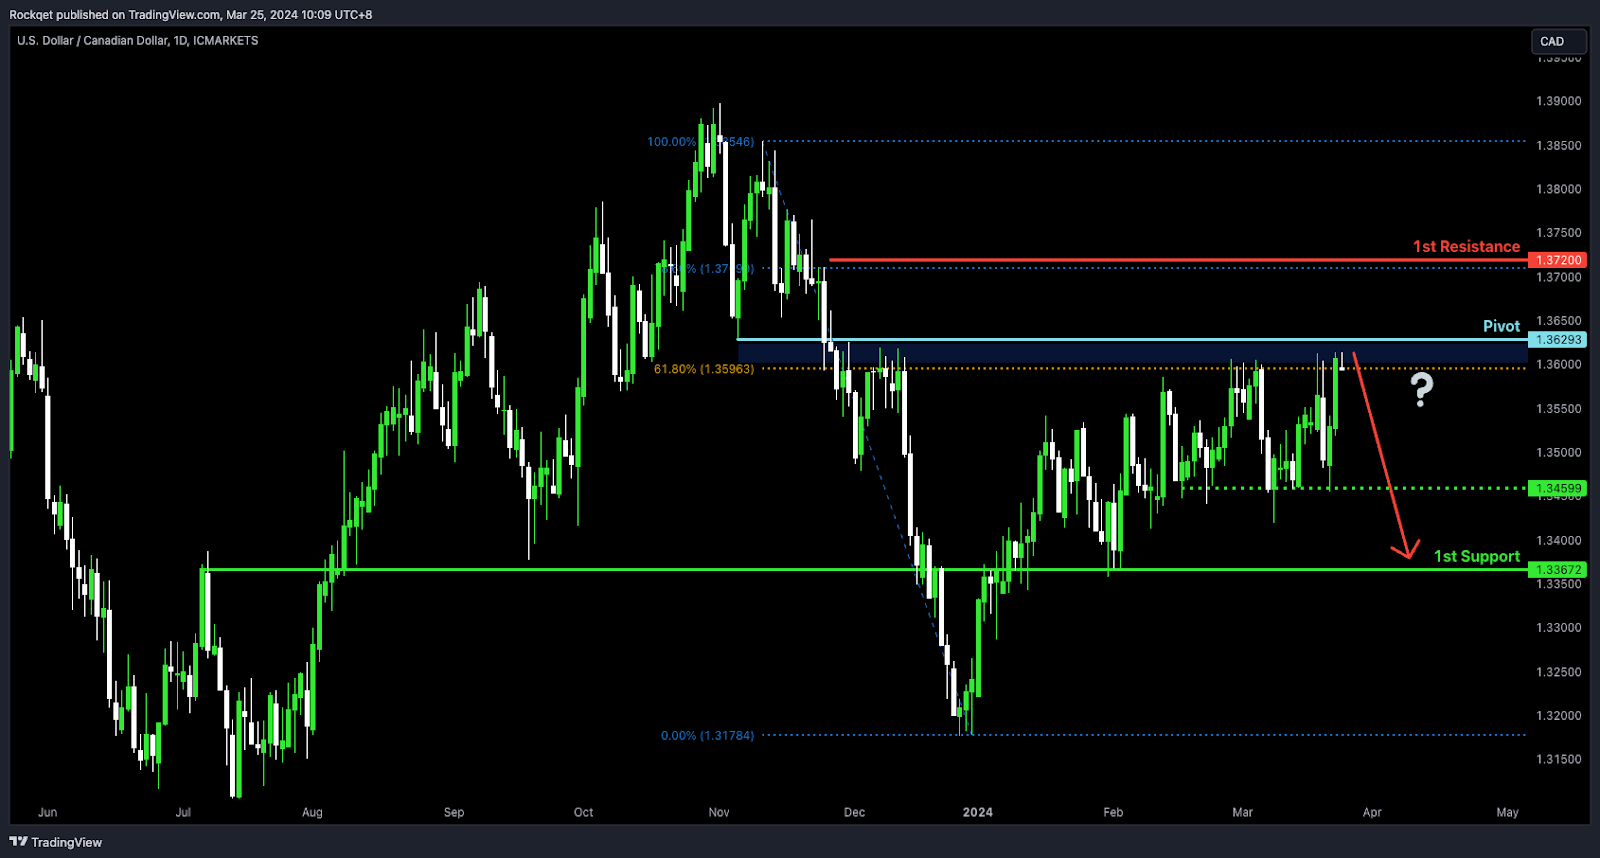
USD/CAD:
Potential Direction: Bearish
Overall momentum of the chart: Neutral
Price could potentially make a bearish reaction off the pivot and drop towards the 1st support
Pivot: 1.3629
Supporting reasons: This level acts as an overlap support, aligning close to the 61.80% Fibonacci retracement, suggests it could be a turning point for the price, potentially initiating a bearish reversal if the level holds as resistance.
1st Support: 1.3367
Supporting reasons: This level acts as an overlap support, indicating a level where previously buying interest was significant enough to halt declines and initiate recoveries.
1st Resistance: 1.3720
Supporting reasons: This level is identified as a pullback resistance, aligning with a 78.60% Fibonacci retracement, marking it as a critical threshold for bullish momentum to overcome. Resistance at this level could cap upside movements, making it a pivotal point for traders monitoring the potential for a bearish reversal.
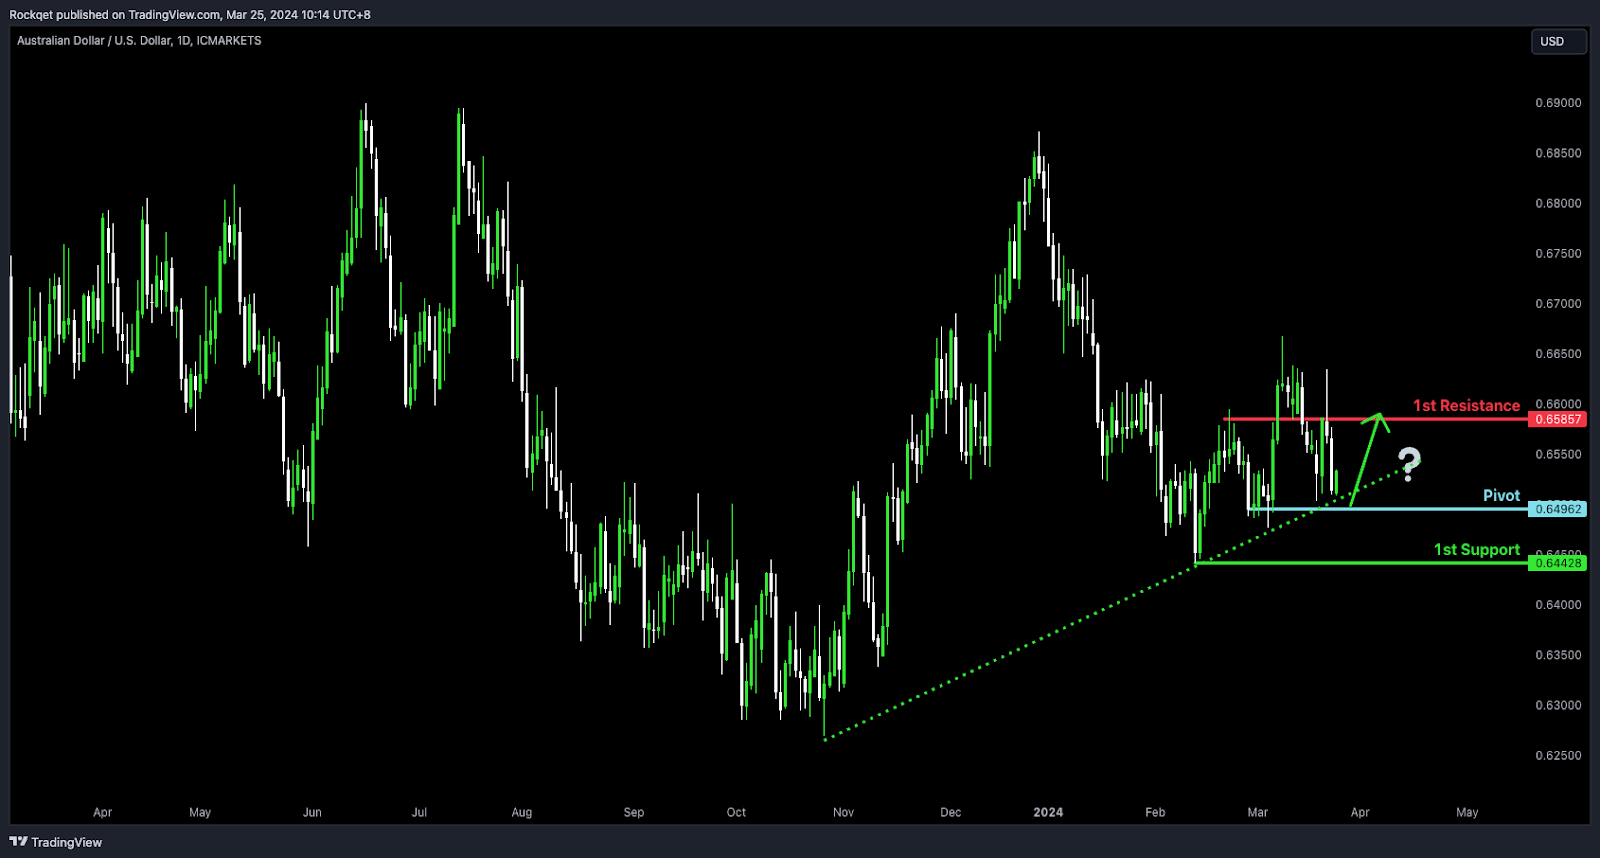
AUD/USD:
Potential Direction: Weak Bullish
Overall momentum of the chart: Medium Bearish
Price could potentially make a bullish reaction off the pivot and rise towards the 1st resistance
Pivot: 0.6496
Supporting reasons: This level acts as a pullback support which suggests it could be a turning point for the price, potentially initiating a bullish reversal if the level holds as support. In addition, price is also trading above an ascending trendline.
1st Support: 0.6442
Supporting reasons: This level acts as a swing-low support, indicating a level where previously buying interest was significant enough to halt declines and initiate recoveries.
1st Resistance: 0.6585
Supporting reasons: This level is identified as an overlap resistance, making it a critical threshold for bullish momentum to overcome. Resistance at this level could cap upside movements, making it a pivotal point for traders monitoring the potential for a bearish reversal.
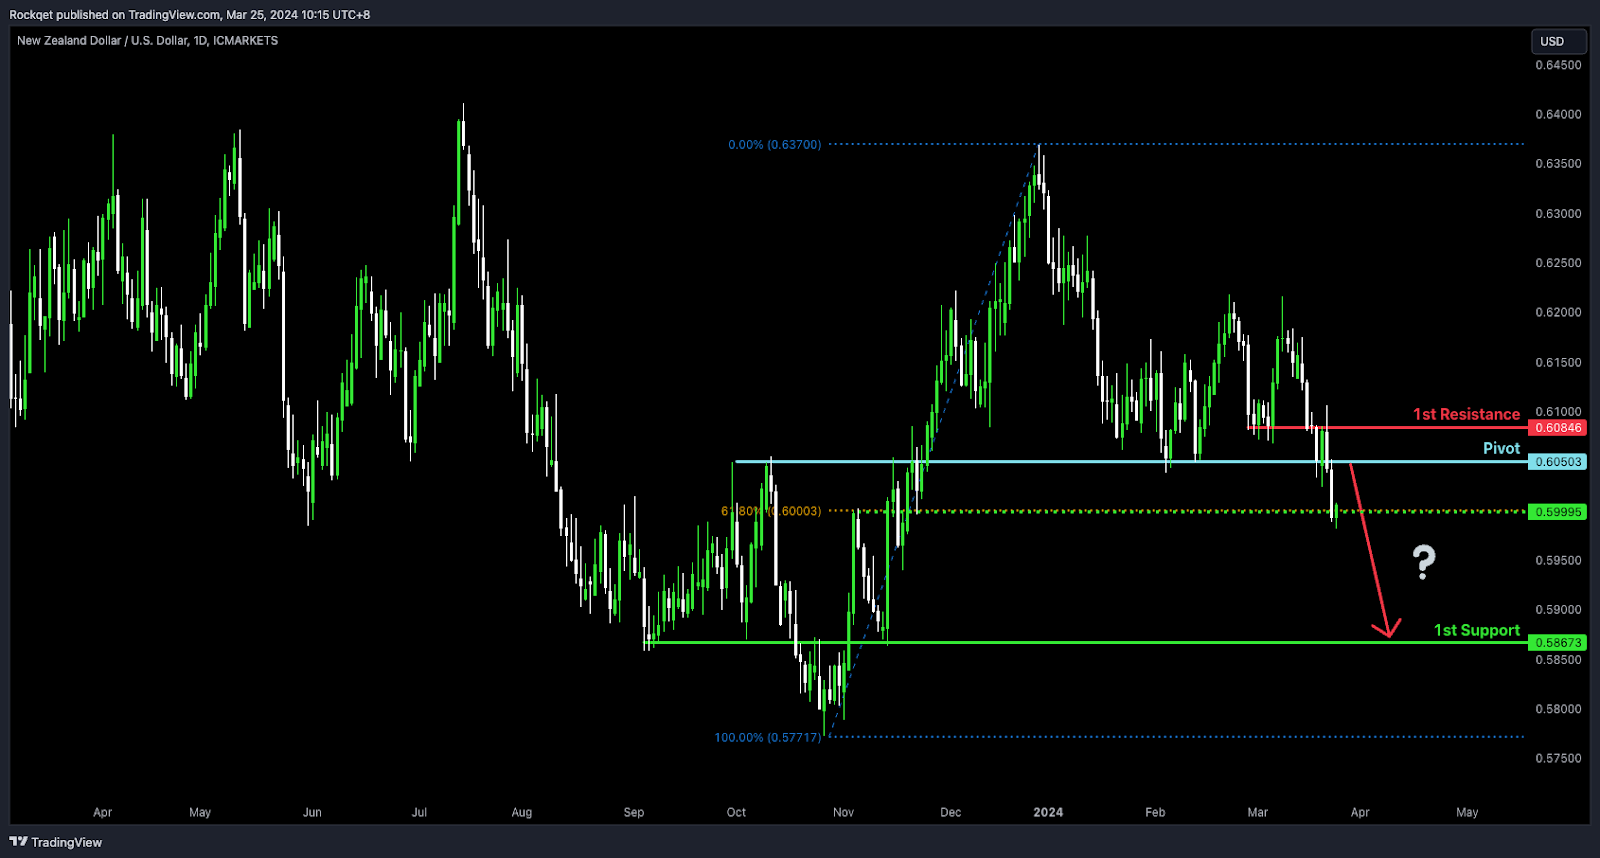
NZD/USD
Potential Direction: Weak Bullish
Overall momentum of the chart: Medium Bearish
Price could potentially make a bearish reaction off the pivot and drop towards the 1st support
Pivot: 0.6050
Supporting reasons: This level acts as an overlap resistance which suggests it could be a turning point for the price, potentially initiating a bearish reversal if the level holds as resistance.
1st Support: 0.5867
Supporting reasons: This level acts as an overlap support, indicating a level where previously buying interest was significant enough to halt declines and initiate recoveries.
1st Resistance: 0.6084
Supporting reasons: This level is identified as an overlap resistance, making it a critical threshold for bullish momentum to overcome. Resistance at this level could cap upside movements, making it a pivotal point for traders monitoring the potential for a bearish reversal.
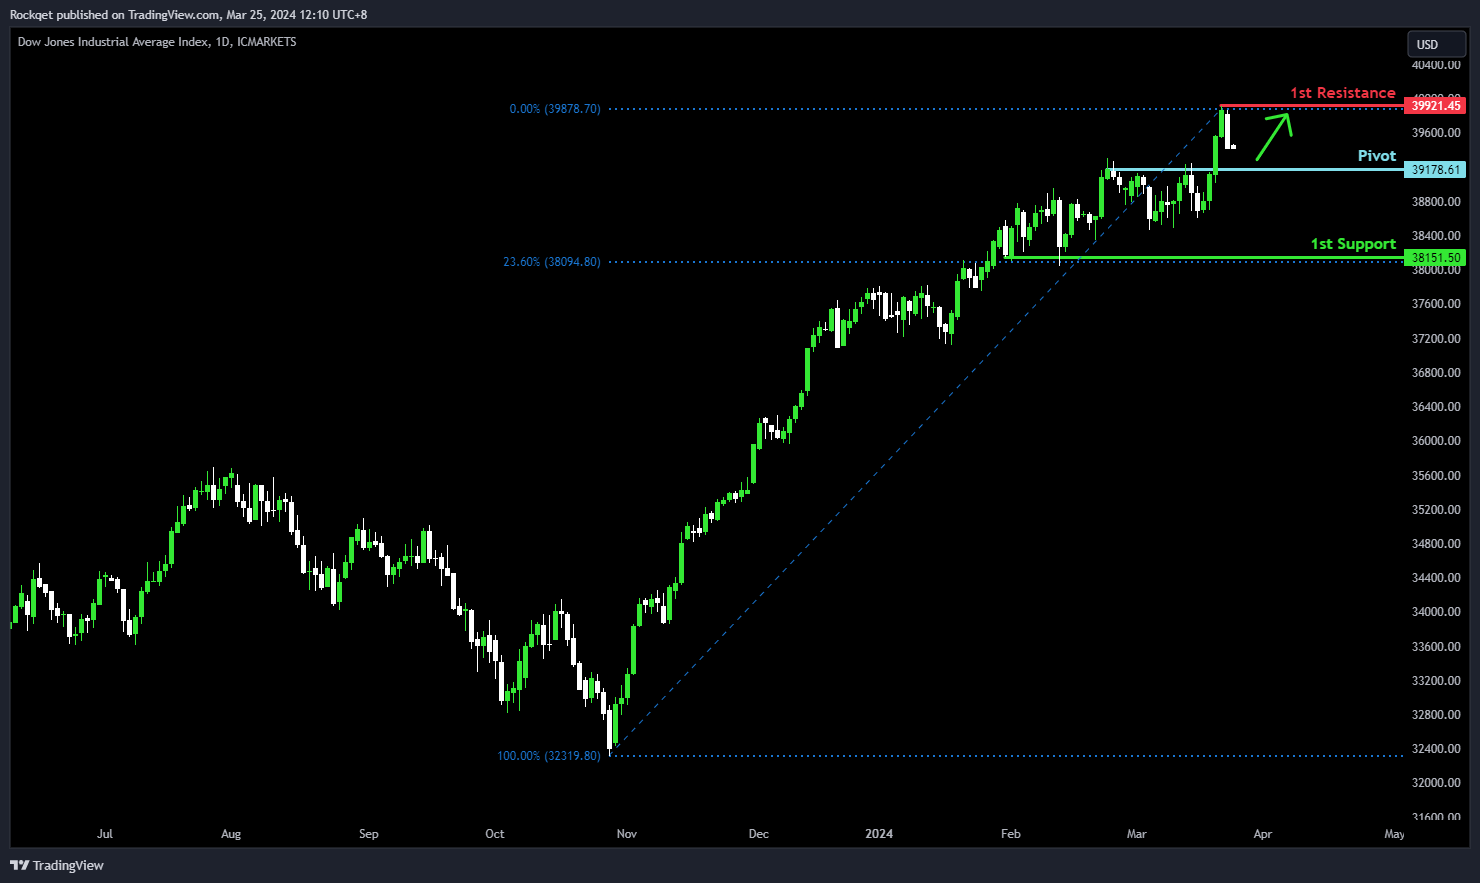
DJ30:
Potential Direction: Weak Bearish
Overall momentum of the chart: Bullish
Price could potentially make a bullish reaction off the pivot and rise towards the 1st resistance
Pivot: 39,178.61
Supporting reasons: This level acts as a pullback support which suggests it could be a turning point for the price, potentially initiating a bullish bounce if the level holds as support.
1st Support: 38,151.50
Supporting reasons: This level acts a pullback support, aligning close to a 23.60% Fibonacci retracement, indicating a level where previously buying interest was significant enough to halt declines and initiate recoveries.
1st Resistance: 39,921.45
Supporting reasons: This level is identified as a pullback resistance that is marked by the all-time high, making it a critical threshold for bullish momentum to overcome. Resistance at this level could cap upside movements, making it a pivotal point for traders monitoring the potential for a bearish reversal.
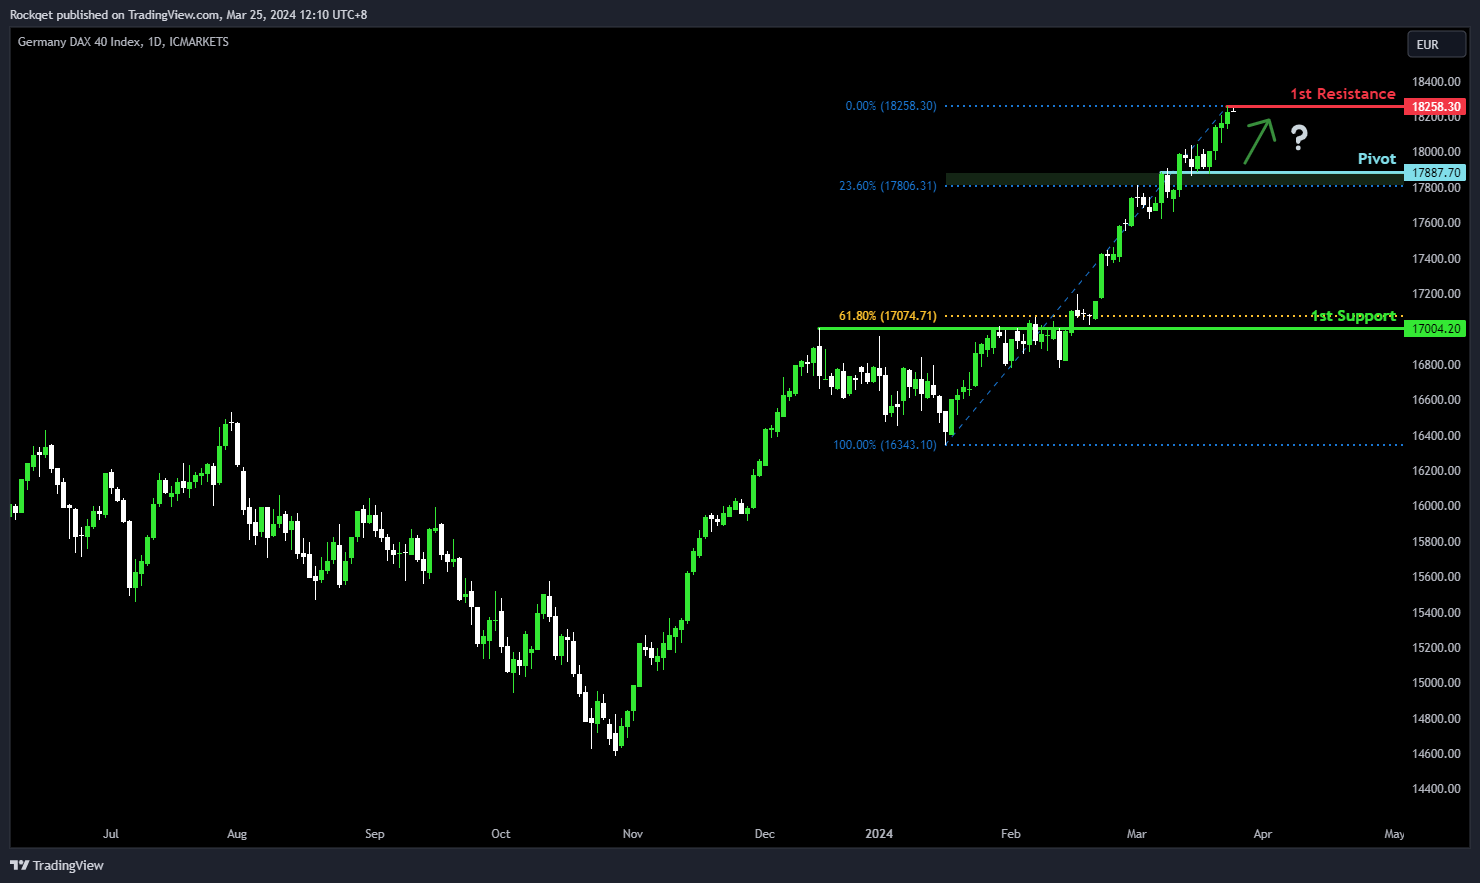
GER40:
Potential Direction: Weak Bearish
Overall momentum of the chart: Bullish
Price could potentially make a bullish reaction off the pivot and rise towards the 1st resistance
Pivot: 17,887.70
Supporting reasons: This level acts as an overlap support, aligning close to a 23.60% Fibonacci retracement, suggesting it could be a turning point for the price, potentially initiating a bullish bounce if the level holds as support.
1st Support: 17,004.20
Supporting reasons: This level acts as an overlap support, aligning close to a 61.80% Fibonacci retracement, indicating a level where previously buying interest was significant enough to halt declines and initiate recoveries.
1st Resistance: 18,258.30
Supporting reasons: This level is identified as a pullback resistance that is marked by the all-time high, making it a critical threshold for bullish momentum to overcome. Resistance at this level could cap upside movements, making it a pivotal point for traders monitoring the potential for a bearish reversal.
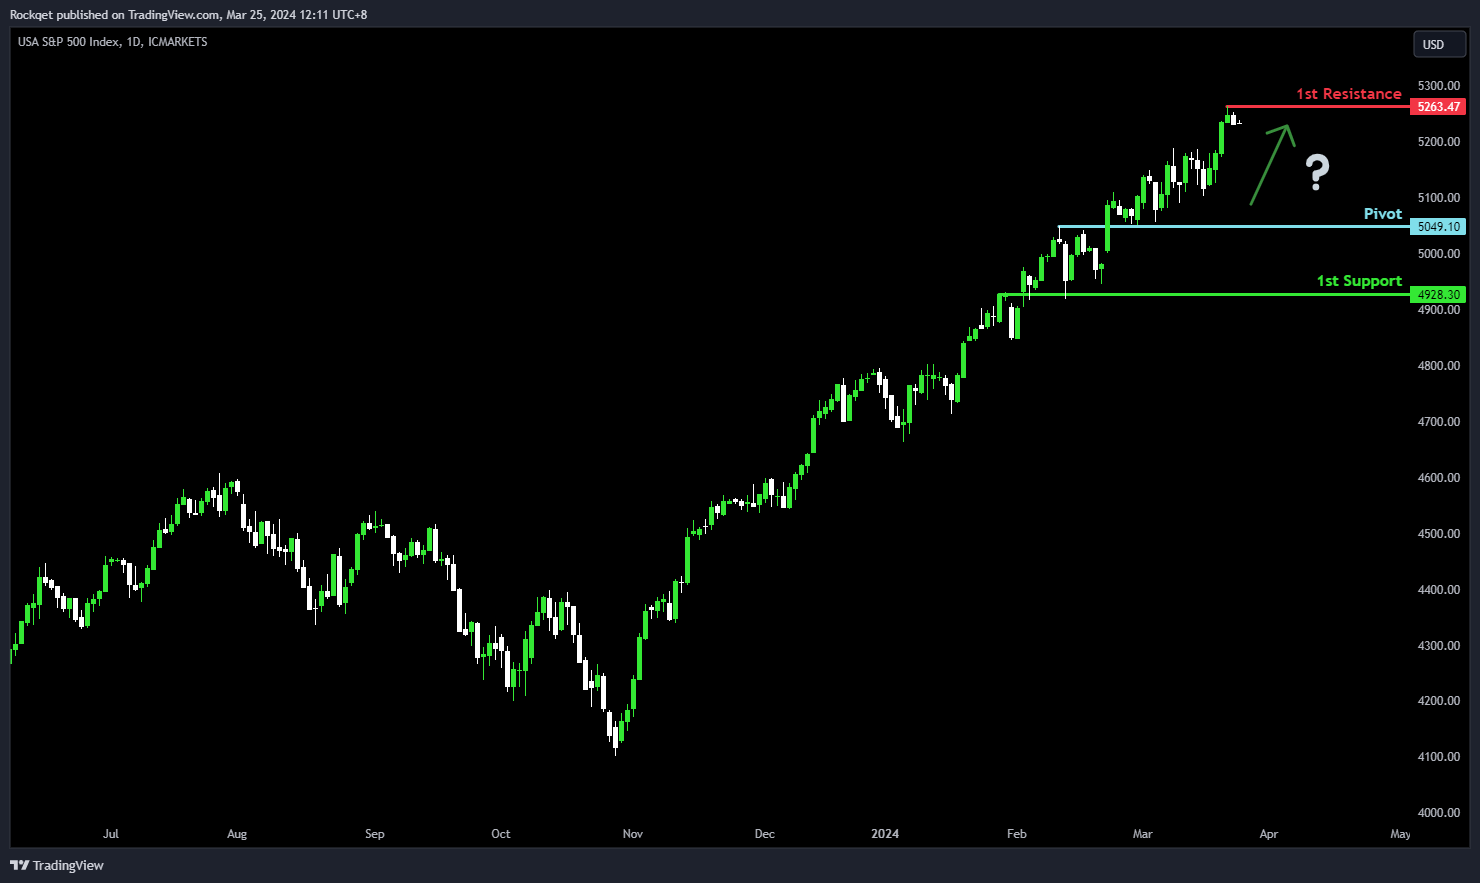
US500:
Potential Direction: Weak Bearish
Overall momentum of the chart: Bullish
Price could potentially make a bullish reaction off the pivot and rise towards the 1st resistance
Pivot: 5,049.10
Supporting reasons: This level acts as an overlap support which suggests it could be a turning point for the price, potentially initiating a bullish bounce if the level holds as support.
1st Support: 4,928.30
Supporting reasons: This level acts as an overlap support, indicating a level where previously buying interest was significant enough to halt declines and initiate recoveries.
1st Resistance: 5,263.47
Supporting reasons: This level is identified as a pullback resistance that is marked by the all-time high, making it a critical threshold for bullish momentum to overcome. Resistance at this level could cap upside movements, making it a pivotal point for traders monitoring the potential for a bearish reversal.
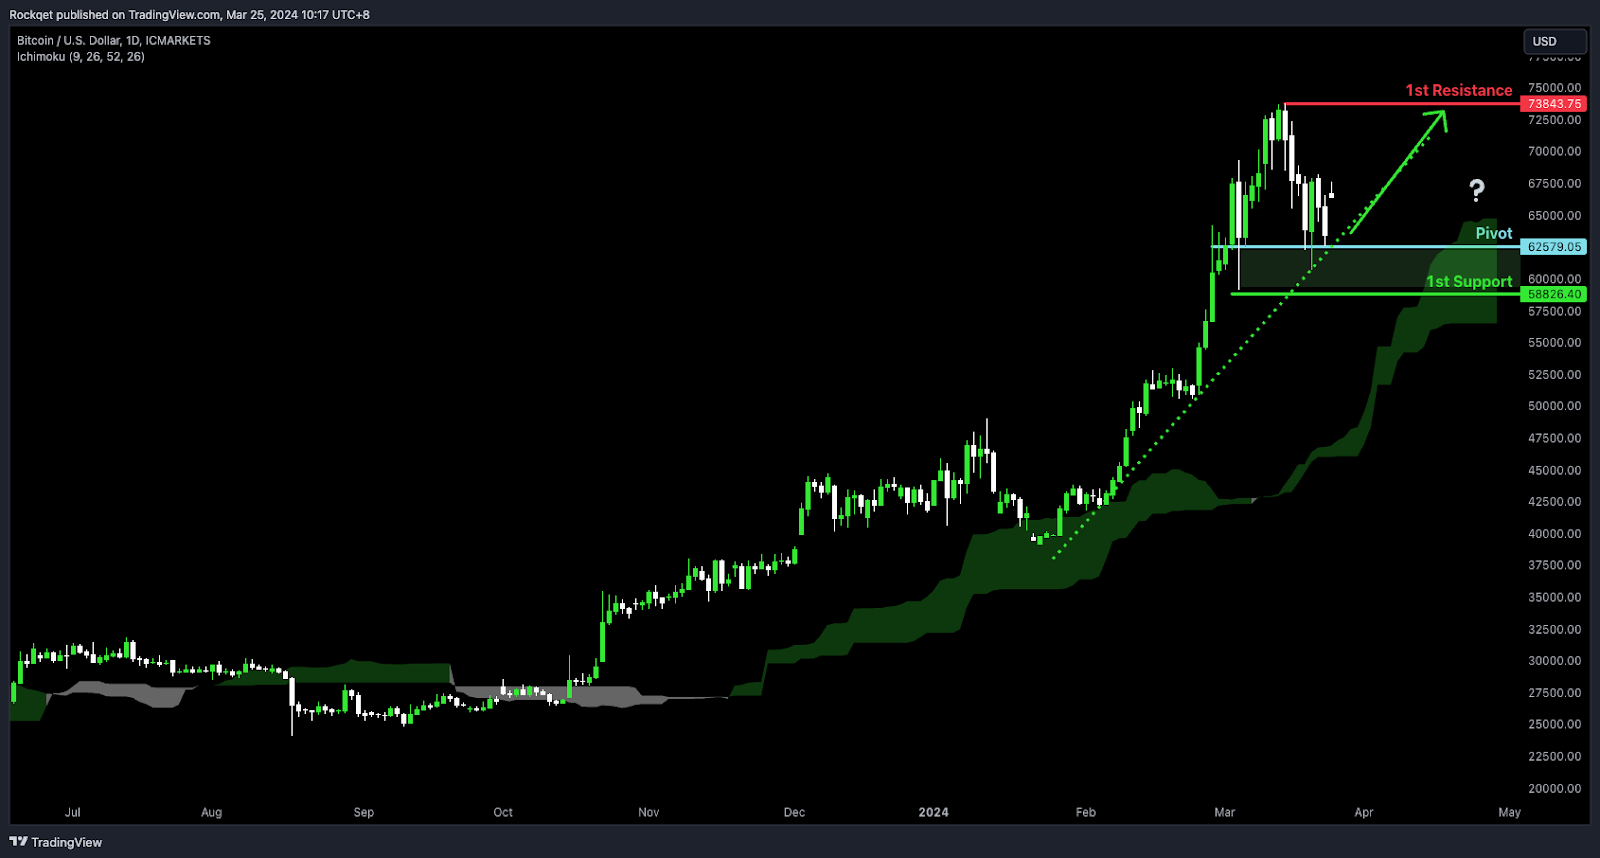
BTC/USD:
Potential Direction: Weak Bearish
Overall momentum of the chart: Bullish
Price could potentially make a bullish reaction off the pivot and rise towards the 1st resistance
Pivot: 62,579.05
Supporting reasons: This level acts as an overlap support, with price trading above a strong ascending support line along with a strong bullish Ichimoku cloud support, which suggests it could be a turning point for the price, potentially initiating a bullish bounce if the level holds as support.
1st Support: 58,826.40
Supporting reasons: This level acts as a pullback support, indicating a level where previously buying interest was significant enough to halt declines and initiate recoveries.
1st Resistance: 73,843.75
Supporting reasons: This level is identified as a pullback resistance that is marked by the all-time high, making it a critical threshold for bullish momentum to overcome. Resistance at this level could cap upside movements, making it a pivotal point for traders monitoring the potential for a bearish reversal.
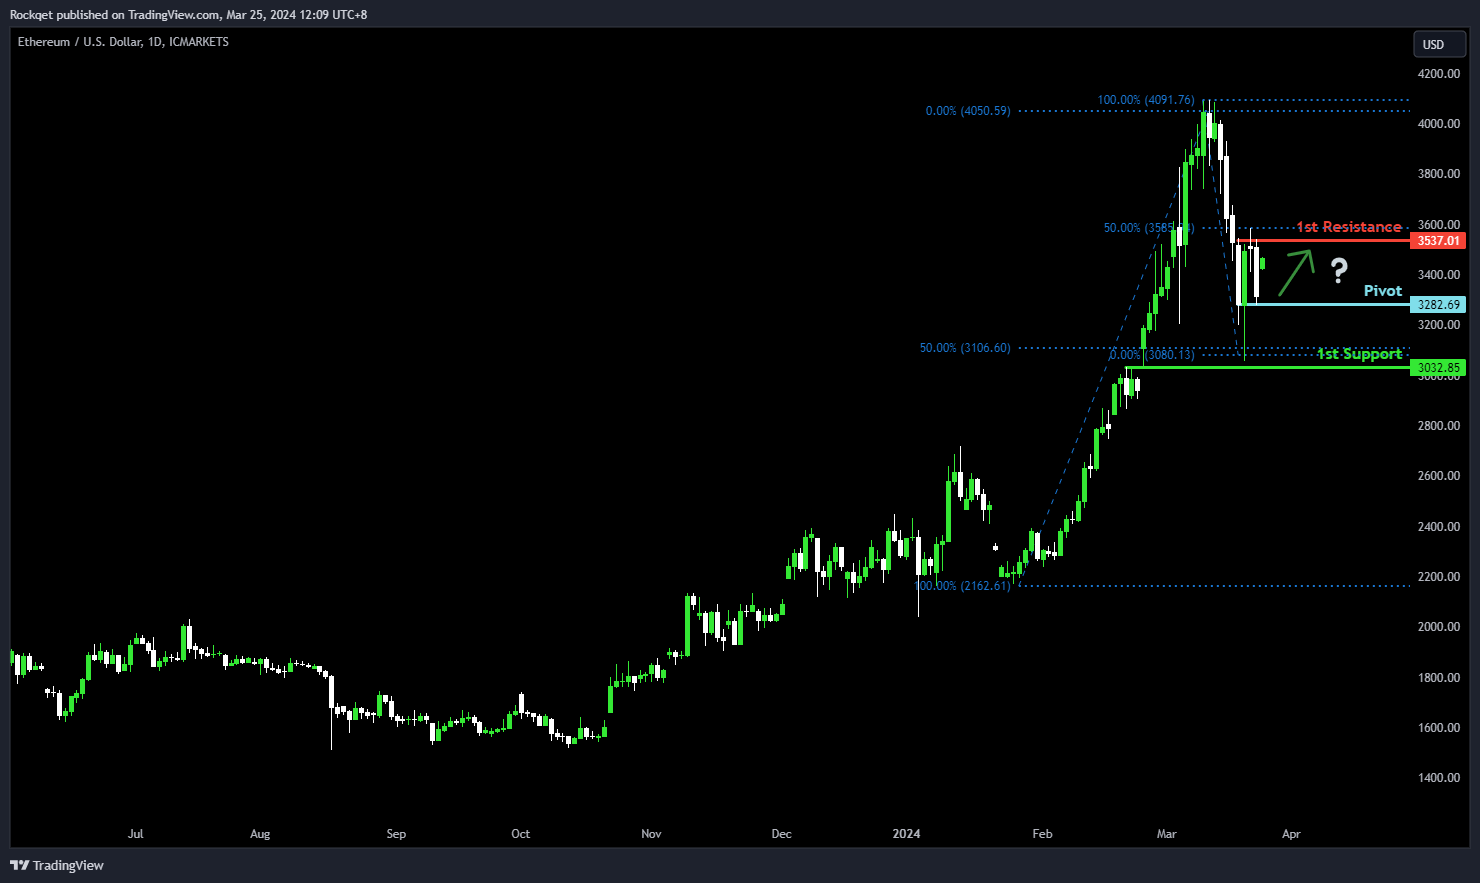
ETH/USD:
Potential Direction: Neutral
Overall momentum of the chart: Bearish
Price could potentially make a bullish reaction off the pivot and rise towards the 1st resistance
Pivot: 3,282.69
Supporting reasons: This level acts as a pullback support which suggests it could be a turning point for the price, potentially initiating a bullish bounce if the level holds as support.
1st Support: 3,032.85
Supporting reasons: This level acts as an overlap support, aligning close to a 50.00% Fibonacci retracement, indicating a level where previously buying interest was significant enough to halt declines and initiate recoveries.
1st Resistance: 3,537.01
Supporting reasons: This level is identified as a pullback resistance, aligning close to a 50.00% Fibonacci retracement, marking it as a critical threshold for bullish momentum to overcome. Resistance at this level could cap upside movements, making it a pivotal point for traders monitoring the potential for a bearish reversal.
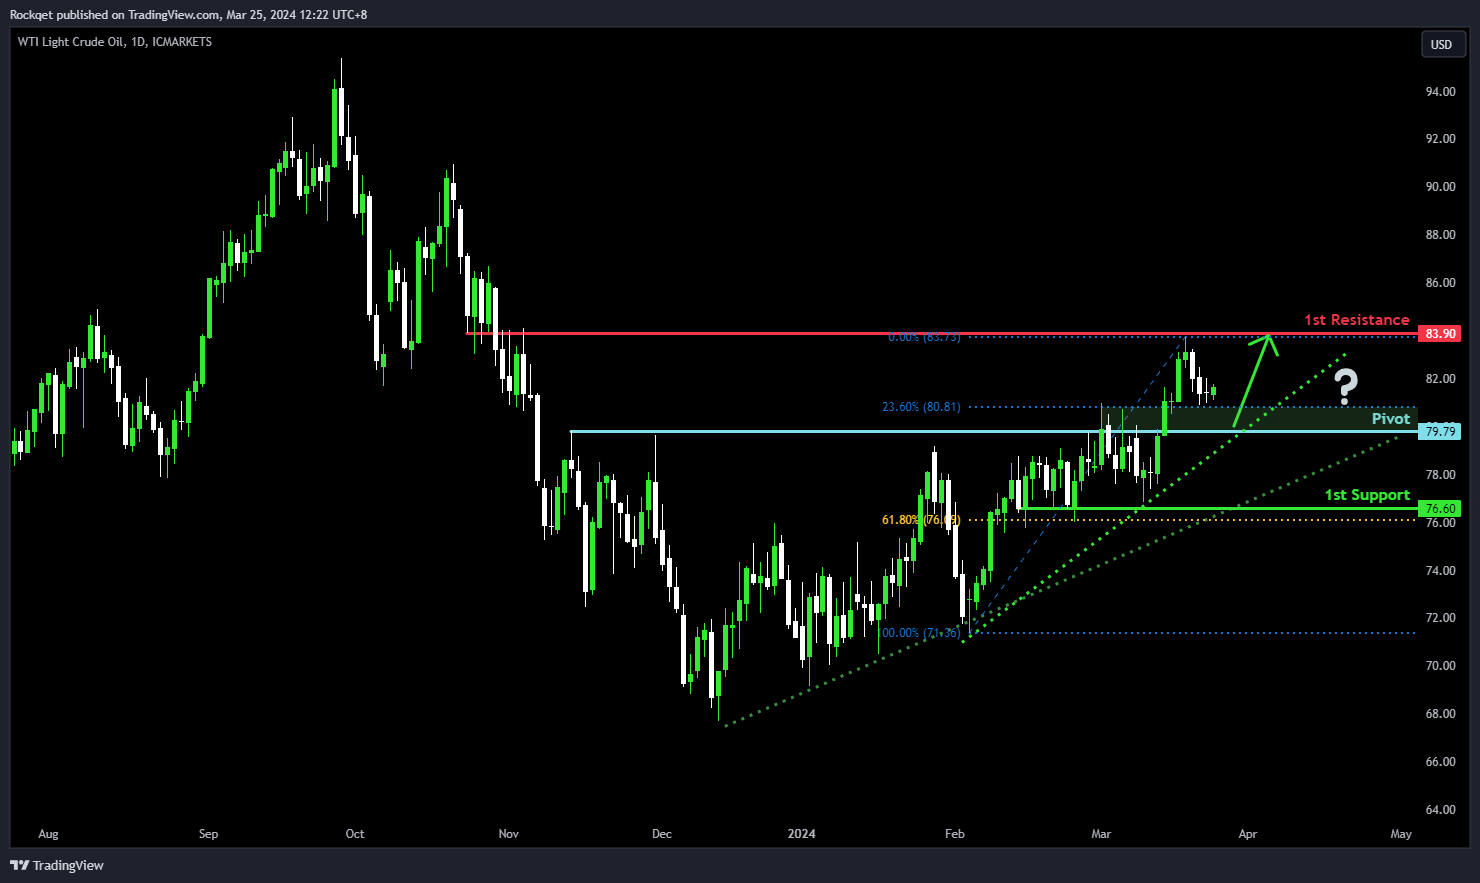
WTI/USD:
Potential Direction: Weak Bearish
Overall momentum of the chart: Bullish
Price could potentially make a bullish reaction off the pivot and rise towards the 1st resistance
Pivot: 79.79
Supporting reasons: This level acts as a pullback support, aligning close to a 23.60% Fibonacci retracement. The convergence of these technical factors suggests it could be a turning point for the price, potentially initiating a bullish bounce if the level holds as support.
1st Support: 76.60
Supporting reasons: This level acts a pullback support, aligning with a 61.80% Fibonacci retracement, indicates a level where previously buying interest was significant enough to halt declines and initiate recoveries.
1st Resistance: 83.90
Supporting reasons: This level is identified as an overlap resistance, marking it as a critical threshold for bullish momentum to overcome. Resistance at this level could cap upside movements, making it a pivotal point for traders monitoring the potential for a bearish reversal.
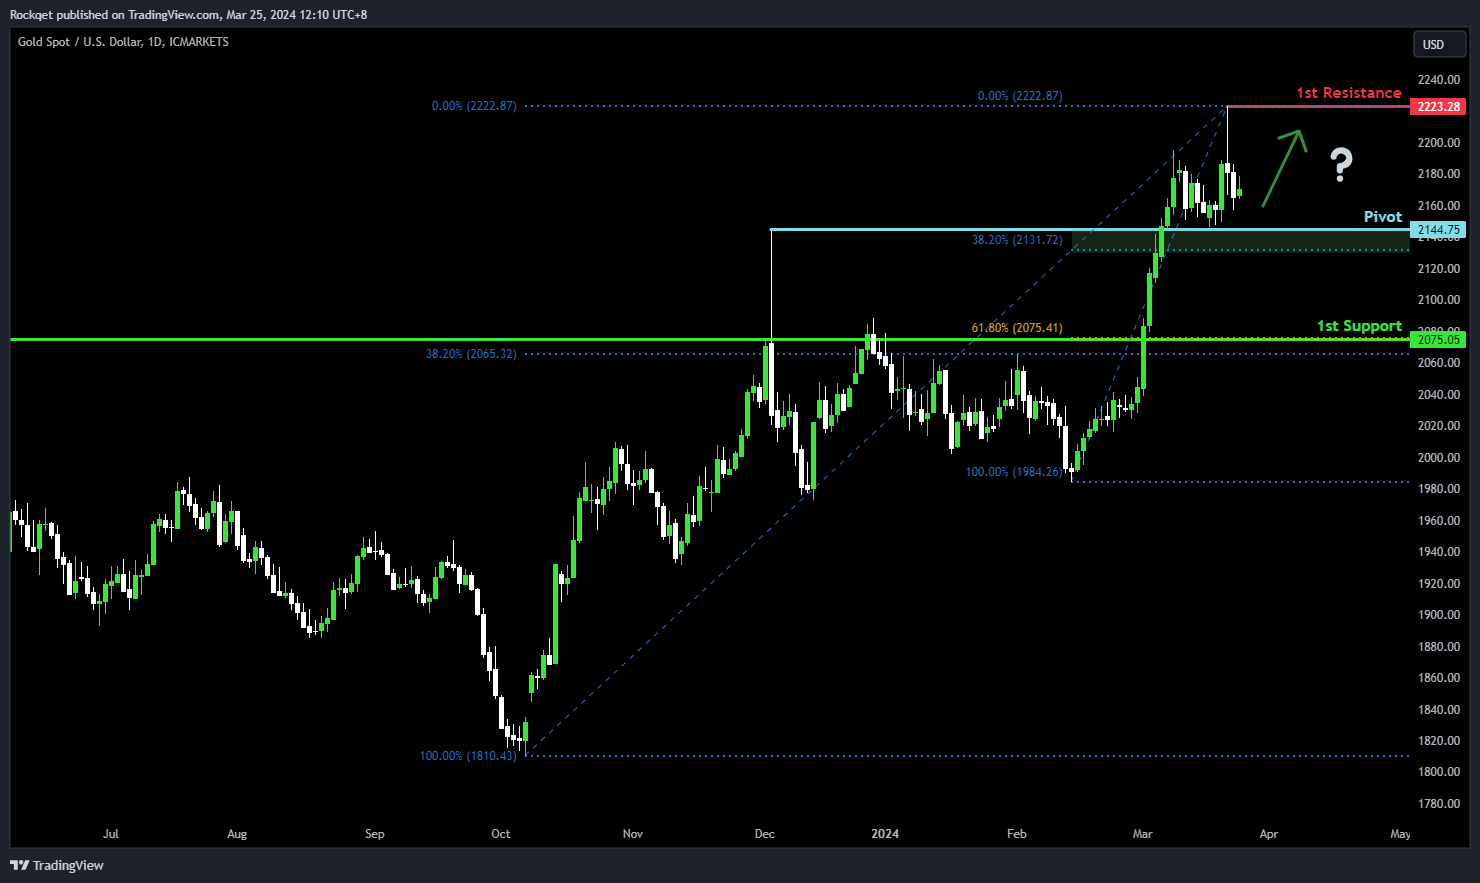
XAU/USD (GOLD):
Potential Direction: Weak Bearish
Overall momentum of the chart: Bullish
Price could potentially make a bullish reaction off the pivot and rise towards the 1st resistance
Pivot: 2,144.75
Supporting reasons: This level acts as an overlap support, aligning close to a 38.20% Fibonacci retracement. The convergence of these technical factors suggests it could be a turning point for the price, potentially initiating a bullish bounce if the level holds as support.
1st Support: 2,075.05
Supporting reasons: This level acts a pullback support, aligning with a confluence of Fibonacci levels i.e. the 38.20% and 61.80% retracements, indicates a level where previously buying interest was significant enough to halt declines and initiate recoveries.
1st Resistance: 2,223.28
Supporting reasons: This level is significant due to its all-time high, marking it as a critical threshold for bullish momentum to overcome. Resistance at this level could cap upside movements, making it a pivotal point for traders monitoring the potential for a bearish reversal.
The accuracy, completeness and timeliness of the information contained on this site cannot be guaranteed. IC Markets does not warranty, guarantee or make any representations, or assume any liability regarding financial results based on the use of the information in the site.
News, views, opinions, recommendations and other information obtained from sources outside of www.icmarkets.com, used in this site are believed to be reliable, but we cannot guarantee their accuracy or completeness. All such information is subject to change at any time without notice. IC Markets assumes no responsibility for the content of any linked site.
The fact that such links may exist does not indicate approval or endorsement of any material contained on any linked site. IC Markets is not liable for any harm caused by the transmission, through accessing the services or information on this site, of a computer virus, or other computer code or programming device that might be used to access, delete, damage, disable, disrupt or otherwise impede in any manner, the operation of the site or of any user’s software, hardware, data or property.


