
Key risk events today:
Japanese banks closed in observance of the Emperor’s Birthday; German IFO Business Climate; MPC Member Haldane Speaks.
(Previous analysis as well as outside sources – italics).
EUR/USD:
Weekly gain/loss: +0.10%
Weekly close: 1.0847
Weekly perspective:
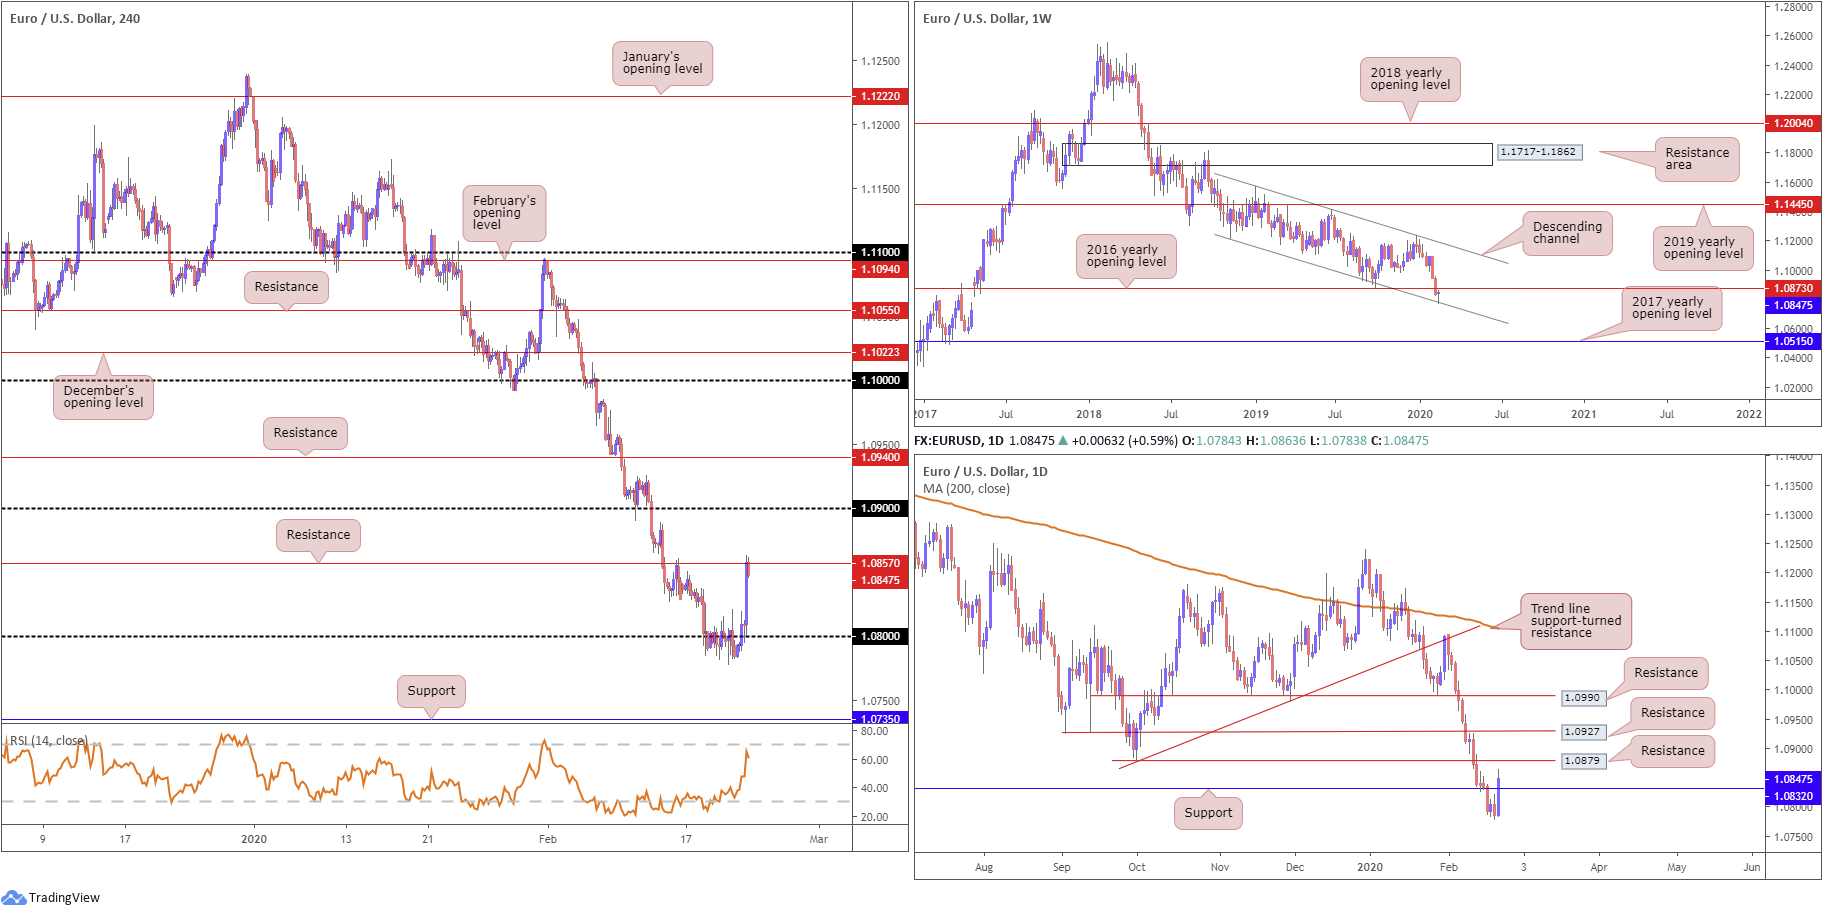
After toppling the 2016 yearly opening level at 1.0873, channel support, taken from the low 1.1109, welcomed a test last week and held price higher. Producing a hammer candlestick formation (a bullish signal at troughs), the unit now faces 1.0873 as potential resistance this week. A move above here could see an approach to channel resistance, extended from the high 1.1569, over the coming weeks.
In terms of the primary trend, price has traded south since topping in early 2018, at 1.2555.
Daily perspective:
The response from weekly channel support generated hearty upside Friday, reclaiming daily resistance at 1.0832 (now a serving support) and closing a touch off daily highs. The next area of resistance in view this week can be found at 1.0879, the October 1st low, with a break highlighting resistance at 1.0927 and then around 1.0990.
H4 perspective:
A combination of upbeat Eurozone flash manufacturing PMIs and a disappointing flash manufacturing PMI reading out of the US provided fresh impetus to the EUR/USD Friday. Travelling from lows around 1.0783 to a high at 1.0863, Europe’s shared currency added more than 0.60% against the buck.
For traders who read Friday’s technical briefing you may recall the following (italics):
A dip through 1.08, triggering sell-stop liquidity, to the aforementioned channel support on the weekly timeframe is certainly a scenario worth keeping an eye out for. A test at the weekly channel support followed up with a close above 1.08 would, for most price-action based traders, be considered a reliable countertrend signal, with daily resistance at 1.0832 positioned as the initial upside target.
While it may be tempting to sell on the back of yesterday’s daily bearish outside candle, the threat of weekly buyers defending the current channel support is likely too much for sellers to take on, despite the pair’s strong underlying offer right now.
Not only did H4 offer an entry long on the breakout candle’s close above 1.08, a retest at 1.08 formed by way of a hammer candlestick pattern, offering an additional entry long before price advanced to H4 resistance at 1.0857 and held into the close. It might also interest some traders to note the relative strength index (RSI) is seen fast approaching overbought territory.
Areas of consideration:
Well done to any readers long north of 1.08. Reducing risk to breakeven is certainly a consideration given H4 resistance at 1.0857. The next upside target in this market is seen around weekly resistance at 1.0873, followed by daily resistance at 1.0879 and then the 1.09 handle on the H4.
In light of the above analysis, all eyes are likely on weekly resistance this week at 1.0873. A push through here signals further upside may be on the horizon, while a rejection suggests a resurgence in selling back towards the 1.08 neighbourhood.
GBP/USD:
Weekly gain/loss: -0.72%
Weekly close: 1.2954
Weekly perspective:
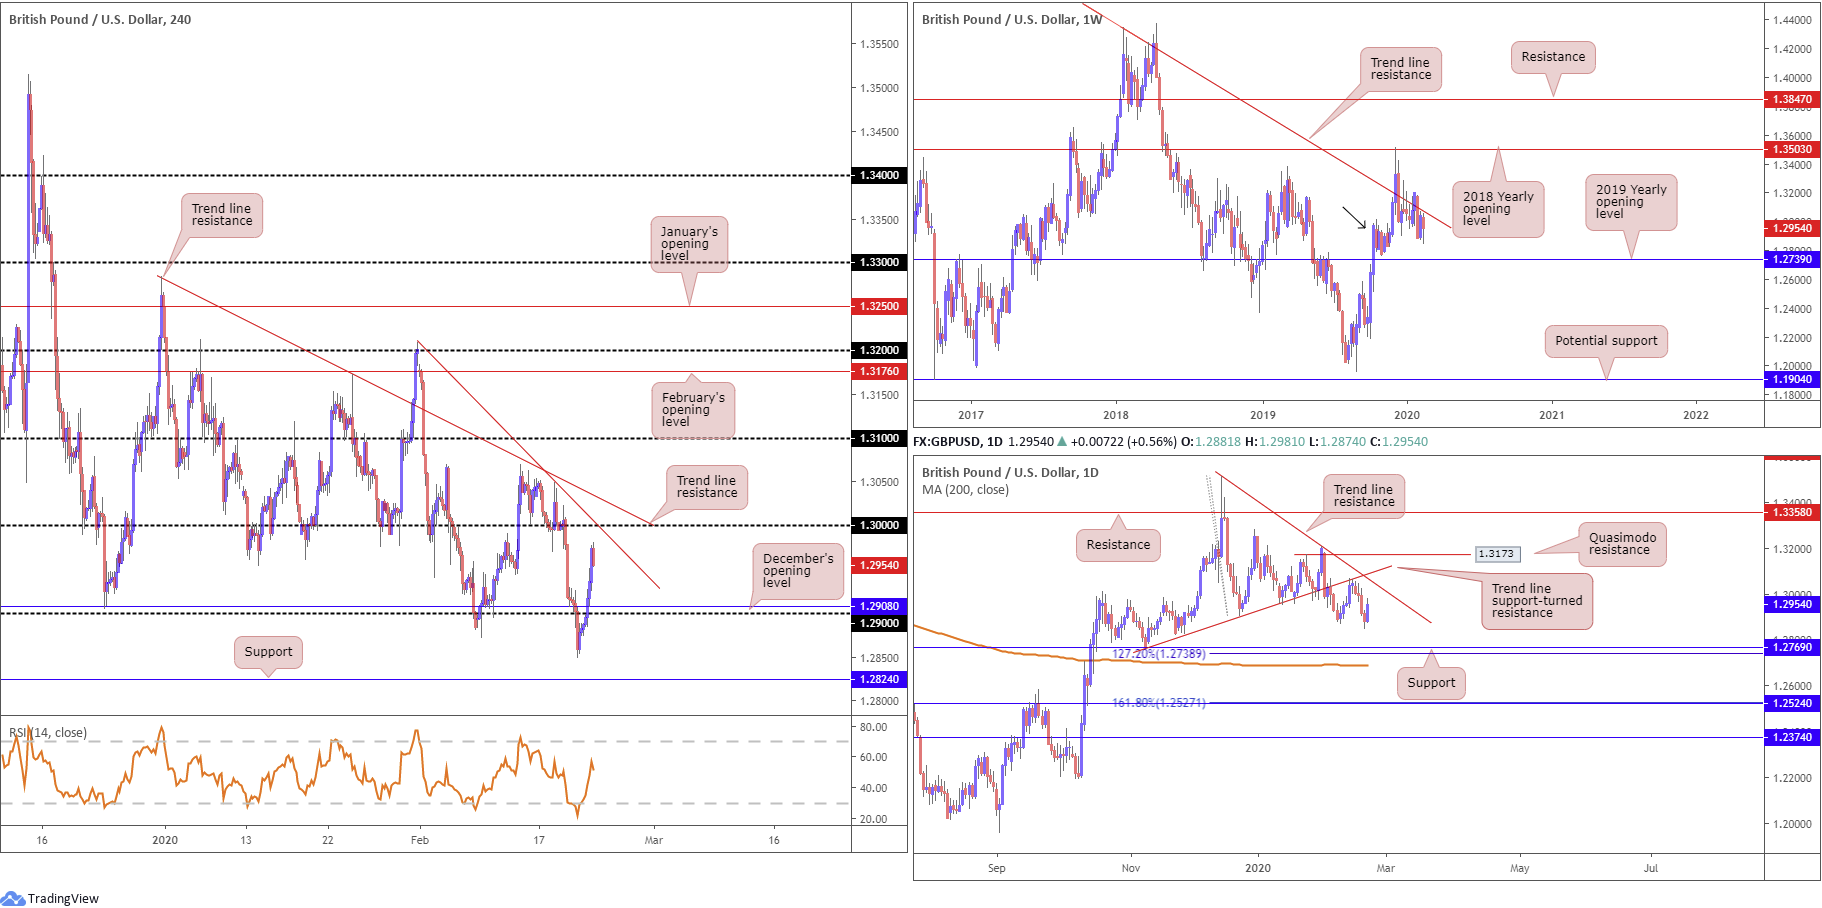
Weekly price is seen languishing beneath long-standing trend line resistance, pencilled in from the high 1.5930, though demand around the 1.2939 region is also still in motion (black arrow). Continued downside may imply a break of the said demand, tripping sell stops and testing the 2019 yearly opening level at 1.2739. A break higher, on the other hand, could see the 2018 yearly opening level enter the fight at 1.3503.
Daily perspective:
After engulfing the 1.2872 10th February low Thursday, price action staged a stronger-than-expected recovery Friday and shuffled the candles to within striking distance of trend line resistance, taken from the high 1.3514, and a familiar trend line support-turned resistance, etched from the low 1.2768.
A rotation to the downside this week, nevertheless, has support fixed at 1.2769, a 127.2% Fibonacci extension at 1.2738 and the 200-day SMA (1.2688). Note the said SMA has been flattening since mid-October 2019.
H4 perspective:
Sterling retained a strong underlying bid following a better-than-expected flash manufacturing PMI reading out of the UK Friday, led by disappointing flash manufacturing PMI data from the US. Chart studies had price eclipse the 1.29 handle, along with December’s opening level at 1.2908, topping within touching distance of the key figure 1.30 at the tail end of the session. Traders may also wish to acknowledge the round number dovetails closely with trend line resistance, drawn from the high 1.3209, shadowed closely by another layer of trend line resistance from 1.3284.
Areas of consideration:
The 1.30 region is an area worthy of the watchlist this week, knowing it boasts additional resistance from two H4 trend line formations.
Daily trend line resistance is not likely to enter view until around the 1.3033 region, therefore, traders are urged to pencil in the possibility of a fakeout above the round number 1.30. Consequently, between 1.3040ish and 1.30 is an area chart studies suggest active selling may be seen this week. Conservative traders, of course, may feel the area requires additional confirmation. While trader dependent, this could be something as simple as a bearish candlestick pattern to a complex harmonic formation on the lower timeframes.
AUD/USD:
Weekly gain/loss: -1.30%
Weekly close: 0.6626
Weekly perspective:
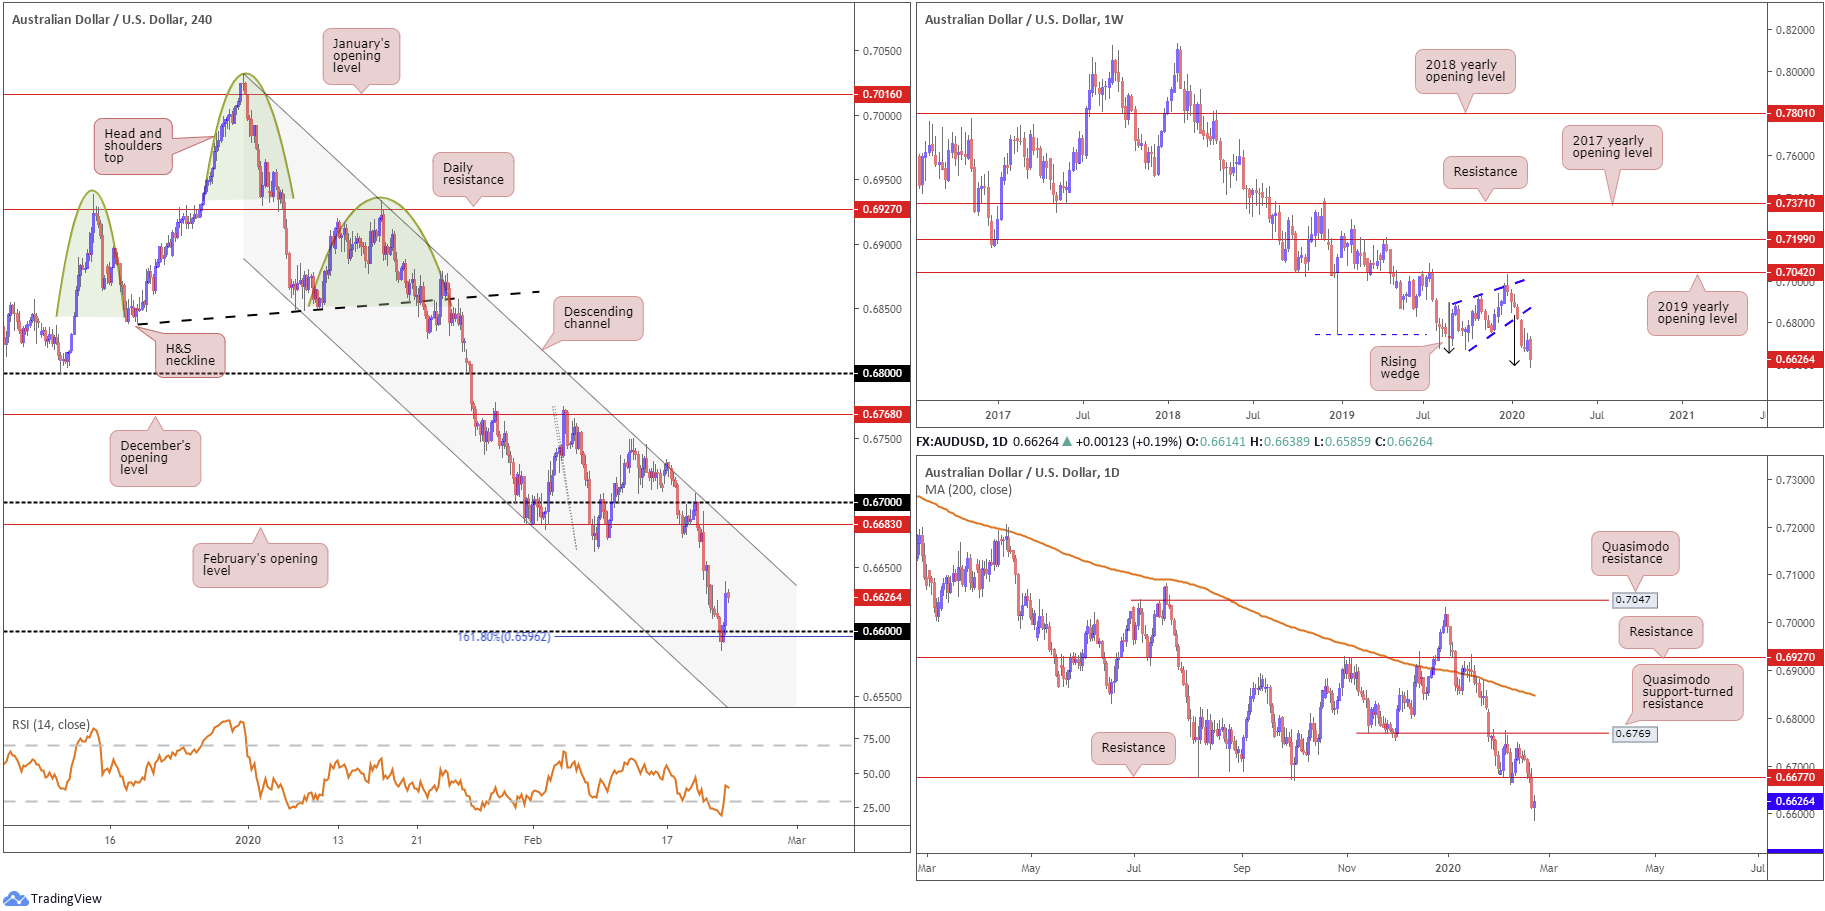
Longer-term movement on the weekly timeframe shook hands with a rising wedge take-profit target at 0.6599 (black arrows – calculated by taking the height of the base and adding it to the breakout point) in the later stages of last week, clocking multi-year lows and generating a mild end-of-week correction. This pattern took five months to complete; well done to any readers who took part.
Continued downside on this scale has support at 0.6359 (not visible on the screen) to target.
Daily perspective:
The key observation on the daily timeframe last week was the taking of support coming in at 0.6677, now a serving resistance level. The next support target beyond 0.6677, in the event of further selling this week, falls in around 0.6508 (not visible on the screen).
H4 perspective:
Early hours London witnessed the Australian dollar dip to lows at 0.6585 against the US dollar, likely tripping sell-stop liquidity, largely from breakout sell orders. Reinforced by a 161.8% Fibonacci extension at 0.6596 and the relative strength index (RSI) elbowing its way deeper into oversold ground, the US session observed a revival north of the 0.66 level, lifted on the back of disappointing flash PMI data out of the US.
For traders who read Friday’s analysis you may recall the following (italics):
Key focus this morning is the 0.66 handle and its aligning 161.8% Fibonacci extension at 0.6596, as well as the weekly rising wedge take-profit target at 0.6599.
Although entering long from 0.66 is considered a countertrend trade, the level, owing to its surrounding confluence, likely contains enough juice to prompt at least intraday short covering. Conservative traders who wish to add a little more confirmation to the mix may consider waiting for additional candlestick confirmation before pulling the trigger. This not only identifies buyer intent; it provides entry and risk levels to work with.
Although the action failed to produce much in the way of a bullish candlestick signal, this was a reasonably high-probability move which boasted higher-timeframe confluence, therefore well done to any readers who managed to jump aboard the run higher.
Areas of consideration:
Increased buying could develop this week, having seen limited resistance until reaching the daily level at 0.6677 and H4 studies pointing to channel resistance, taken from the high 0.7031, February’s opening level at 0.6683 and the round number 0.67.
On account of the above, reducing risk to breakeven, for those long this market, may be an option, targeting the above said structures in bold.
Intraday traders on the lower timeframes may seek long opportunities off local structure this week, though target the higher-timeframe resistances.
USD/JPY:
Weekly gain/loss: +1.60%
Weekly close: 111.52
Weekly perspective:
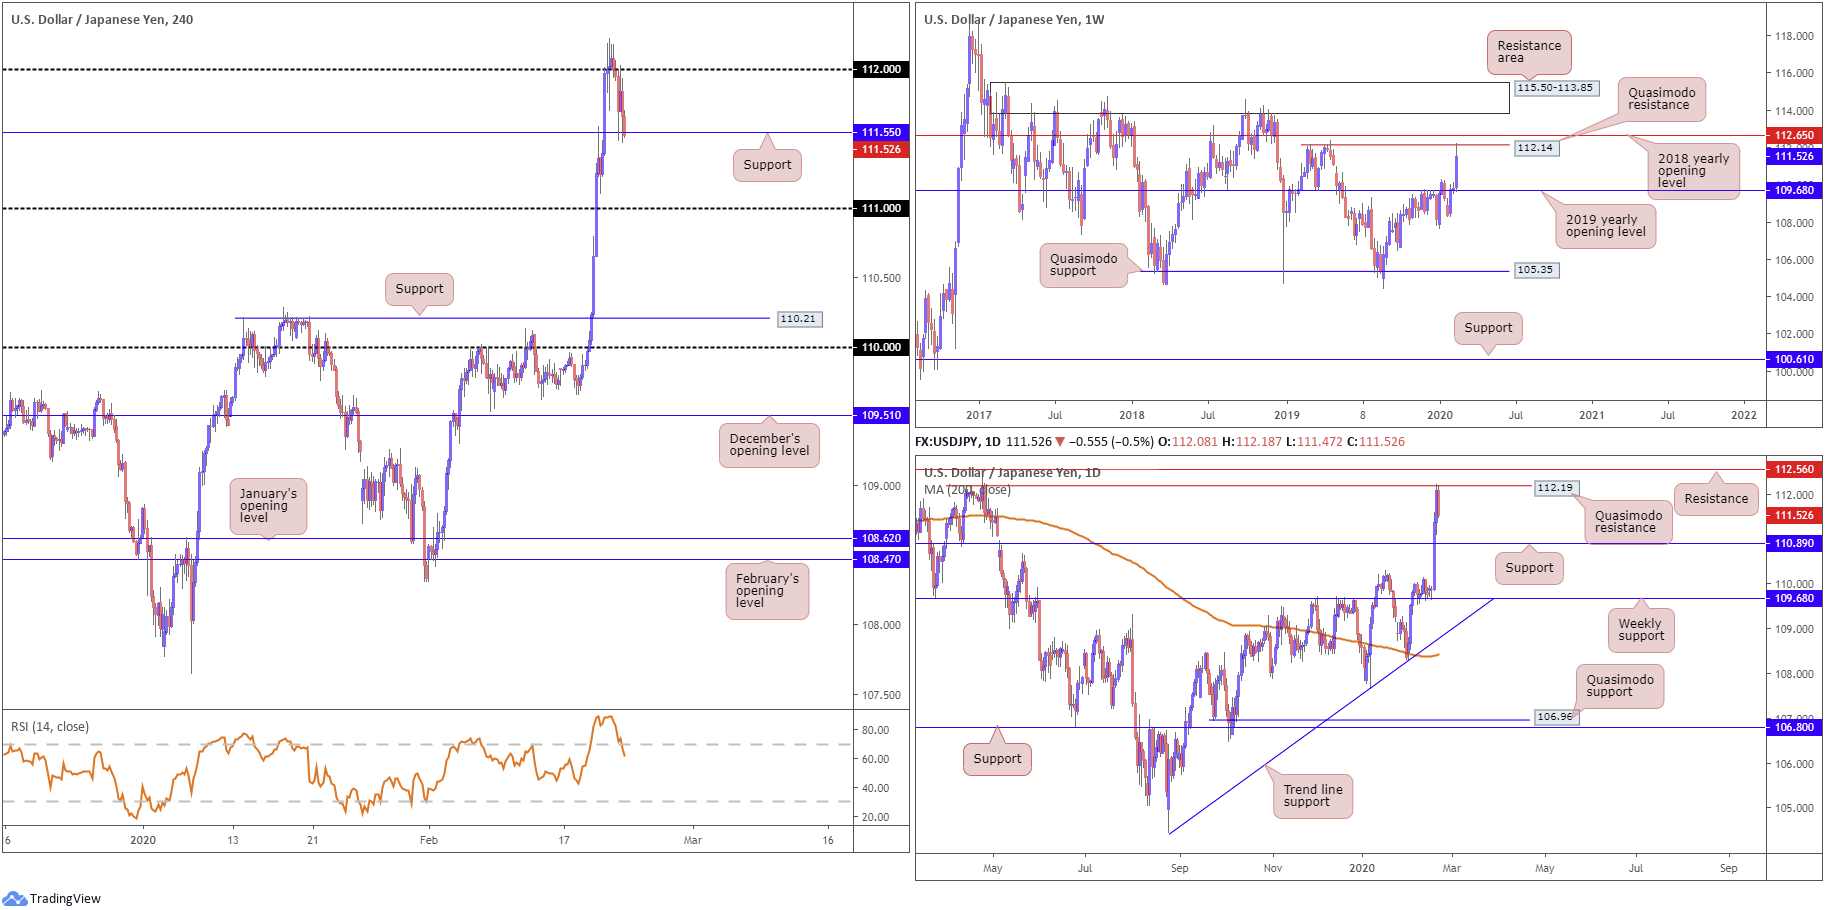
Exhibiting a strong display of financial muscle last week, USD/JPY buyers delivered a near-full-bodied bullish candle north of the 2019 yearly opening level at 109.68. The move wrapped up crossing swords with Quasimodo resistance at 112.14, sited just south of the 2018 yearly opening level at 112.65.
Another area of interest on this scale can be seen at a resistance area drawn from 115.50-113.85.
Daily perspective:
In similar fashion to weekly structure, the daily timeframe has price fading Quasimodo resistance at 112.19, located a few points beneath resistance at 112.56. Follow-through selling from this region could see support at 110.89 re-enter the play this week, with a break exposing weekly support (the 2019 yearly opening level) at 109.68.
H4 perspective:
Sliding US Treasury yields, as well as worse-than-expected flash PMI data out of the US, undermined the USD Friday. With a clear risk-off mood, demand for the safe-haven Japanese yen gathered traction, forcing USD/JPY south of 112 to support plotted at 111.55. Also worth noting is the relative strength index (RSI) exited overbought terrain, facing the possibility of a move to 50.00.
Traders who read Friday’s technical report may recall the following (italics):
As much as H4 price is attempting to hold north of 112 right now, breakout buyers may be entering long into a strong wave of higher-timeframe selling here. The daily timeframe has eyeballs on Quasimodo resistance at 112.19. Converging closely with the said Quasimodo is another layer of Quasimodo resistance on the weekly timeframe at 112.14, seen circling a few points below the 2018 yearly opening level plotted at 112.65.
Between 112.65 and 112.14 is a region technical research anticipates selling activity. With upside incredibly robust, though, traders are urged not to take any chances. It is recommended to wait and see if the H4 candles can win back 112 and close lower before considering bearish scenarios.
A close south of 112 would likely be enough to encourage a run to H4 support 111.55, the 111 handle and daily support priced in at 110.89. Conservative traders will likely want to see a retest at the underside of 112 before committing (entry and risk can then be calculated based on the rejecting candlestick’s structure).
Areas of consideration:
Well done to any readers who took advantage of bearish themes beneath 112 on Friday. H4 support at 111.55, as you can see, entered the fold, with the possibility of a run forming to 111 this week, and daily support priced in at 110.89.
A decisive H4 close below 111.55, preferably followed up with a retest as resistance (entry and risk levels can be calculated on the back of the rejecting candle’s framework), could provide traders a second opportunity at shorting this market today/early week.
USD/CAD:
Weekly gain/loss: -0.20%
Weekly close: 1.3221
Weekly perspective:
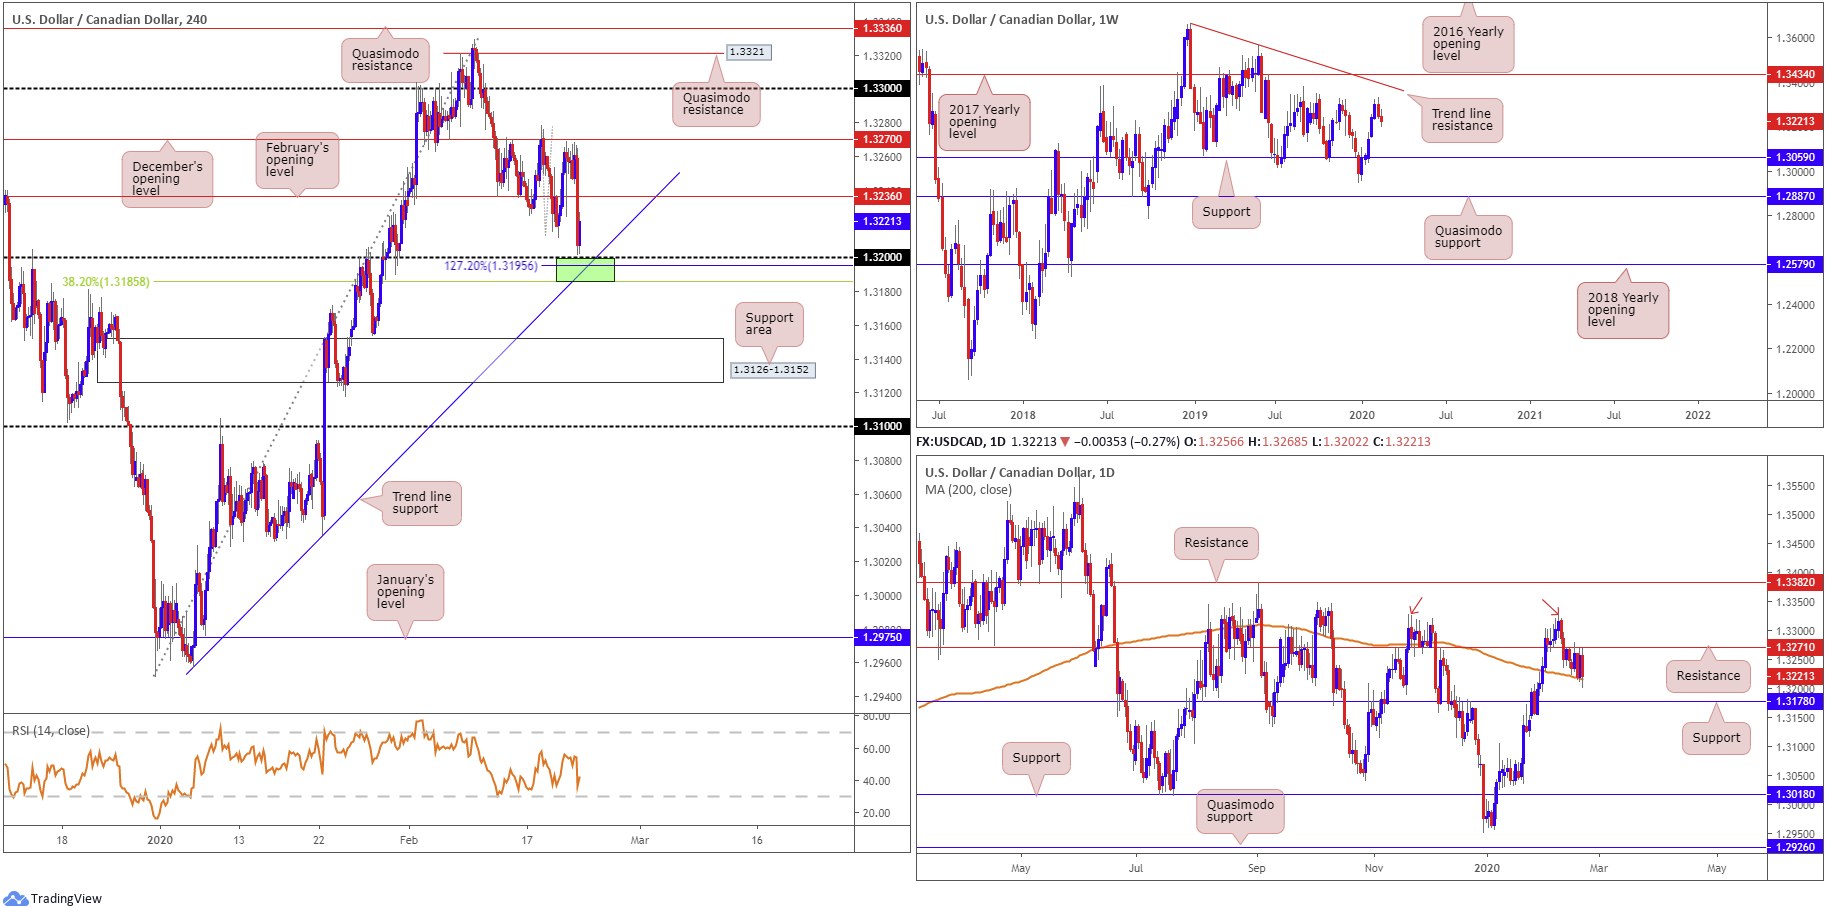
Price halted just south of tops around 1.3340 in recent weeks, with the unit modestly extending losses to lows of 1.3202 last week. WTI, on the weekly timeframe, also recently whipsawed through the $50.55/bbl August 7th low and has since chalked up a reasonably modest recovery, with long-term resistance not expected until around $60.97/bbl.
Additional resistance on USD/CAD resides at a trend line formation (1.3661) and the 2017 yearly opening level at 1.3434. Support can be found around the 1.3059 neighbourhood.
Daily perspective:
Price action on the daily timeframe has buyers and sellers battling for position between resistance at 1.3271 and the 200-day SMA (orange – 1.3216). A break to the upside has tops around 1.3329 to target (red arrows) and resistance pencilled in at 1.3382, while moves lower unlocks the trapdoor to a well-rounded support from 1.3178.
H4 perspective:
The US dollar index curved south Friday, topping just ahead of the 100.00 handle. This, coupled with a modest rebound in WTI off session lows at $52.57/bbl, guided USD/CAD through February’s opening level at 1.3236 towards 1.32, though mildly pared losses a few points north of the figure into the close.
Technically, not only do we have 1.32 stationed nearby as potential support this week, we also have trend line support, from the low 1.2957, a 38.2% Fibonacci retracement value at 1.3185 as well as a 127.2% Fibonacci extension at 1.3195. Yet, a move through the said structures has a support area at 1.3126-1.3152 in view.
Areas of consideration:
The area (green) between the round number 1.32, the H4 trend line support, the 38.2% Fibonacci support at 1.3185 and 127.2% Fibonacci extension at 1.3195 is a worthy contender for potential long opportunities this week, initially targeting February’s opening level at 1.3236. Note we also have the 200-day SMA converging closely with 1.32 at the moment, currently circling 1.3216. In addition, a few points south of the said H4 zone we also have daily support mentioned above at 1.3178.
In the event weekly selling overthrows 1.3178/1.32 this week, the H4 support area at 1.3126-1.3152 may offer some respite, though a fakeout through to 1.31 could also be on the cards.
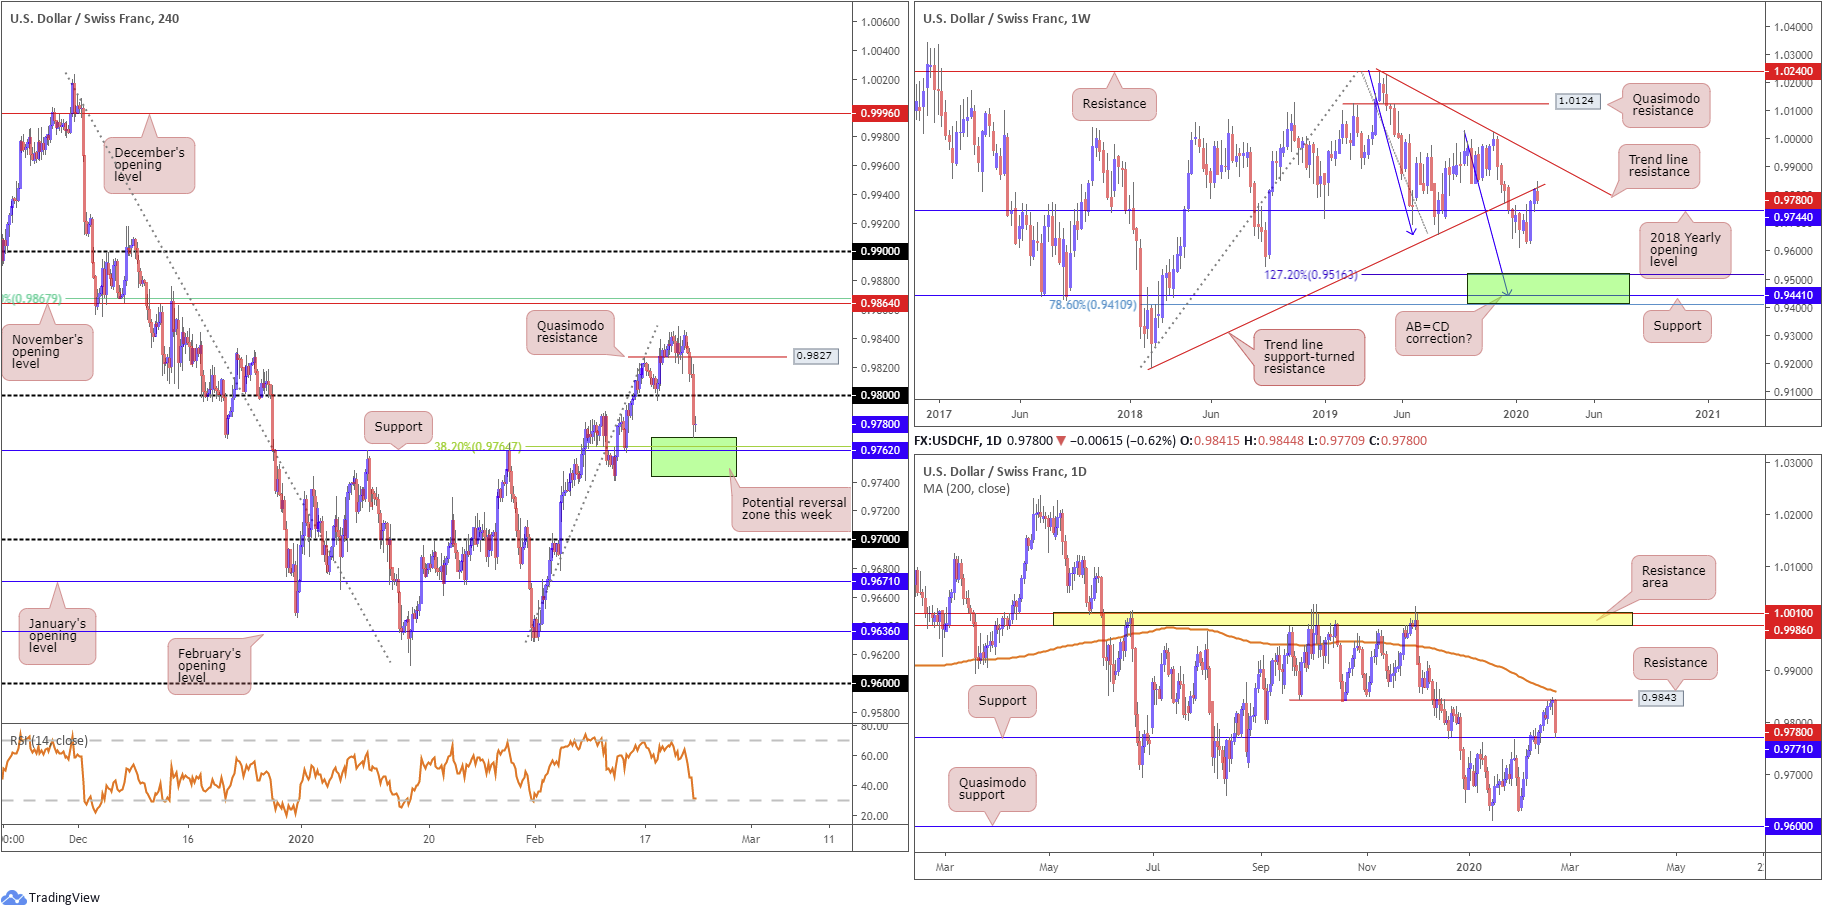
USD/CHF:
Weekly gain/loss: -0.39%
Weekly close: 0.9780
Weekly perspective:
After a stronger-than-expected recovery that brushed aside the 2018 yearly opening level at 0.9744, price eventually connected with trend line support-turned resistance, drawn from the low 0.9187. Snapping a two-week winning streak and erasing most of the prior week’s gains, the pair rejected the said trend line and now has eyes on a retest at 0.9744 this week.
Trend line resistance, etched from the high 1.0236, is in sight, in the event we turn higher, while beyond 0.9744, the 0.9613 January 13th low is seen, followed by 0.9410/0.9516 (green) – comprised of a 78.6% Fibonacci retracement at 0.9410, support at 0.9441 and a 127.2% AB=CD bullish correction (black arrows]) at 0.9516.
Daily perspective:
Resistance at 0.9843 greeted price on Wednesday, a level placed just ahead of the 200-day SMA (orange – 0.9860), and sent the pair to support priced in at 0.9771 by the week’s end. Note this level held price into the close. A violation of the said level this week lands price within close proximity of the weekly support highlighted above at 0.9744, the 2018 yearly opening level.
H4 perspective:
Less-than-stellar US flash manufacturing PMIs triggered broad USD selling Friday, carrying the USD/CHF through 0.98 to lows of 0.9770 and hurling the relative strength index (RSI) into oversold status.
The green area, formed by weekly support at 0.9744 and daily support at 0.9771, is an area buyers could occupy this week. Additional support is seen around 0.9762 on the H4 scale, as well as a 38.2% Fibonacci retracement at 0.9764.
Areas of consideration:
Keeping things simple this week, the 0.9744/0.9771 H4 area represents a potential reversal zone. Price, however, could drive deeper into the aforementioned area before turning higher, in which the RSI will likely offer hidden bullish divergence. An ideal scenario is for H4 price to test the lower region of the zone and form a bullish candlestick pattern. Entering on the back of this formation provides entry and risk levels to work with, targeting 0.98 as the initial take-profit zone, followed by H4 Quasimodo resistance at 0.9827 and then daily resistance at 0.9843.
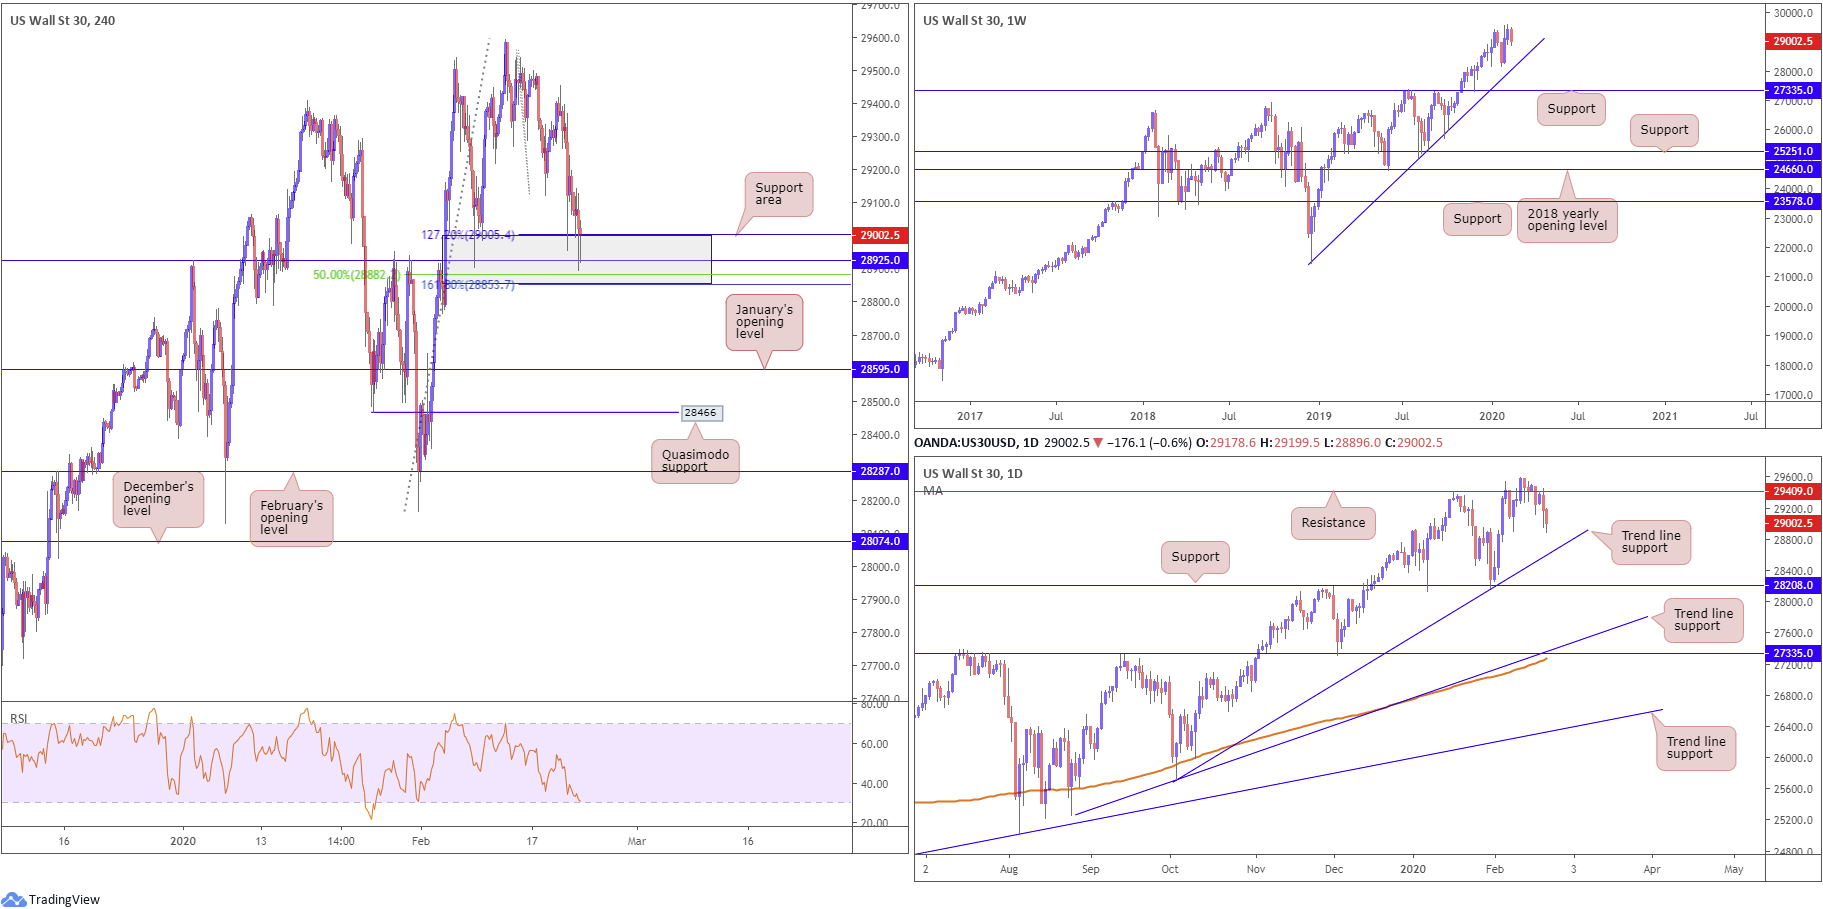
Dow Jones Industrial Average:
Weekly gain/loss: -1.43%
Weekly close: 29002
Weekly perspective:
The weekly candles remain in a healthy position north of trend line support, taken from the low 21452, despite last week’s pullback retreating more than 400 points. Outside of the aforementioned trend line, support rests at 27335.
Daily perspective:
Closer analysis of price on the daily timeframe reveals the index failed to glean much support off 29409, giving way earlier in the week. A retest at the underside of the base occurred Thursday, generating reasonably modest downside, which was repeated on Friday to lows of 28896.
Should sellers continue to strengthen their grip, trend line support, extended from the low 25710, may enter the fight this week, with a break possibly clearing the pathway to support coming in at 28208.
H4 perspective:
Major US benchmarks finished lower Friday, snapping a two-week winning streak, amid increased concerns regarding the spread of China’s coronavirus. The Dow Jones Industrial Average lost 227.57 points, or 0.78%; the S&P 500 declined 35.48 points, or 1.05% and the tech-heavy Nasdaq 100 ended lower by 181.14 points, or 1.88%.
As evident from the H4 timeframe, the index concluded the week testing the lower boundary of a particularly appealing support zone between 28853/29005 (grey – comprised of a 161.8%/127.2% combination, a support level at 28925 and a 50.0% retracement at 28882), confirmed by the relative strength index approaching oversold status.
Should we drive through this area this week, though, January’s opening level at 28595 is in the offing which happens to merge closely with the current daily trend line support.
Areas of consideration:
28853/29005 is in focus for possible bullish themes today/early week, targeting daily resistance at 29409. Continued selling, however, shifts the focus to intraday selling opportunities to January’s opening level at 28595. Knowing 28595 boasts a close connection to daily trend line support, this could also be considered a potential reversal zone this week.
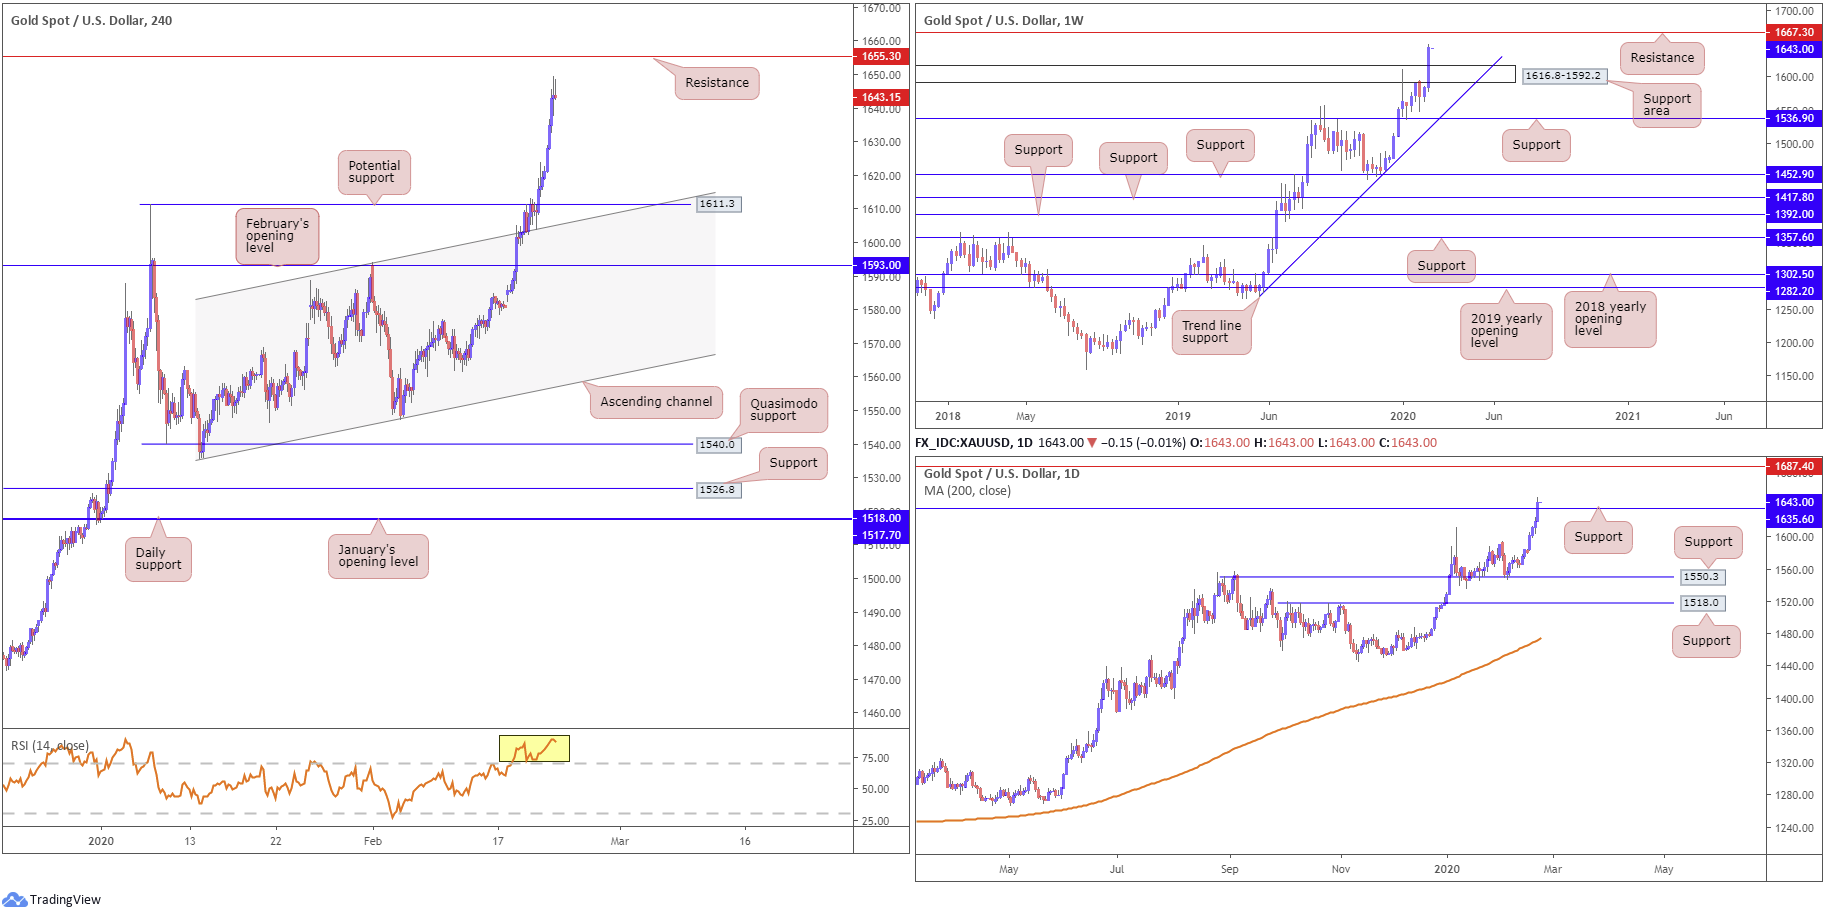
XAU/USD (GOLD):
Weekly gain/loss: +3.76%
Weekly close: 1643.1
Weekly perspective:
XAU/USD buyers went on the offensive last week, holding onto the bulk of its gains and testing levels not seen since February 2013. Although capping upside since the beginning of the year, supply at 1616.8-1592.2 gave way last week (now representing a support area), perhaps unlocking upside to resistance fixed from 1667.3 this week.
Before reaching 1667.3, traders are urged to pencil in the possibility of a retest forming at 1616.8-1592.2, which could ultimately provide a base for longs.
Daily perspective:
Closer analysis of price action on the daily timeframe saw bullion conquer resistance at 1635.6 Friday, potentially setting the stage for an approach to resistance at 1687.4 this week. Note this resistance level is set a touch higher than the weekly level at 1667.3.
In similar fashion to weekly structure, traders are also urged to pencil in the possibility of a retest forming at 1635.6, consequently providing a potential base for longs.
H4 perspective:
Friday’s risk-off tone, along with the US dollar index snapping a three-day winning streak south of 100.00 and US Treasury yields softening, helped the safe-haven metal preserve its upside presence and reach multi-year highs at 1649.2.
Technically, the week ended in the shape of a shooting star candlestick pattern, considered a bearish signal at peaks, ahead of resistance priced from January 2013 at 1655.3. In terms of support on this scale, the closest base falls in at the 1611.3 January 7th high that merges closely with channel resistance-turned support, taken from the high 1593.9. Traders may also find use in noting the relative strength index (RSI) trades deep within overbought ground, currently registering an 87.71 reading (yellow).
Areas of consideration:
This is clearly a buyers’ market right now, particularly after dethroning weekly supply mentioned above at 1616.8-1592.2. For that reason, the following supports are in the spotlight for possible reversals this week: the weekly support area at 1616.8-1592.2, the daily support level at 1635.6 and H4 support at 1611.3. Note the H4 barrier is plotted within the upper limit of the current weekly support area.
Whether additional confirmation, such as candlestick patterns, is needed before pulling the trigger off either of the aforementioned supports is, of course, trader dependent. Ideally, though, traders will want a support to be tested prior to weekly resistance entering the fold at 1667.3.
The accuracy, completeness and timeliness of the information contained on this site cannot be guaranteed. IC Markets does not warranty, guarantee or make any representations, or assume any liability regarding financial results based on the use of the information in the site.
News, views, opinions, recommendations and other information obtained from sources outside of www.icmarkets.com.au, used in this site are believed to be reliable, but we cannot guarantee their accuracy or completeness. All such information is subject to change at any time without notice. IC Markets assumes no responsibility for the content of any linked site.
The fact that such links may exist does not indicate approval or endorsement of any material contained on any linked site. IC Markets is not liable for any harm caused by the transmission, through accessing the services or information on this site, of a computer virus, or other computer code or programming device that might be used to access, delete, damage, disable, disrupt or otherwise impede in any manner, the operation of the site or of any user’s software, hardware, data or property.


