
Key risk events today:
Limited.
(Previous analysis as well as outside sources – italics).
EUR/USD:
Weekly gain/loss: -0.39%
Weekly close: 1.1793
Weekly perspective:
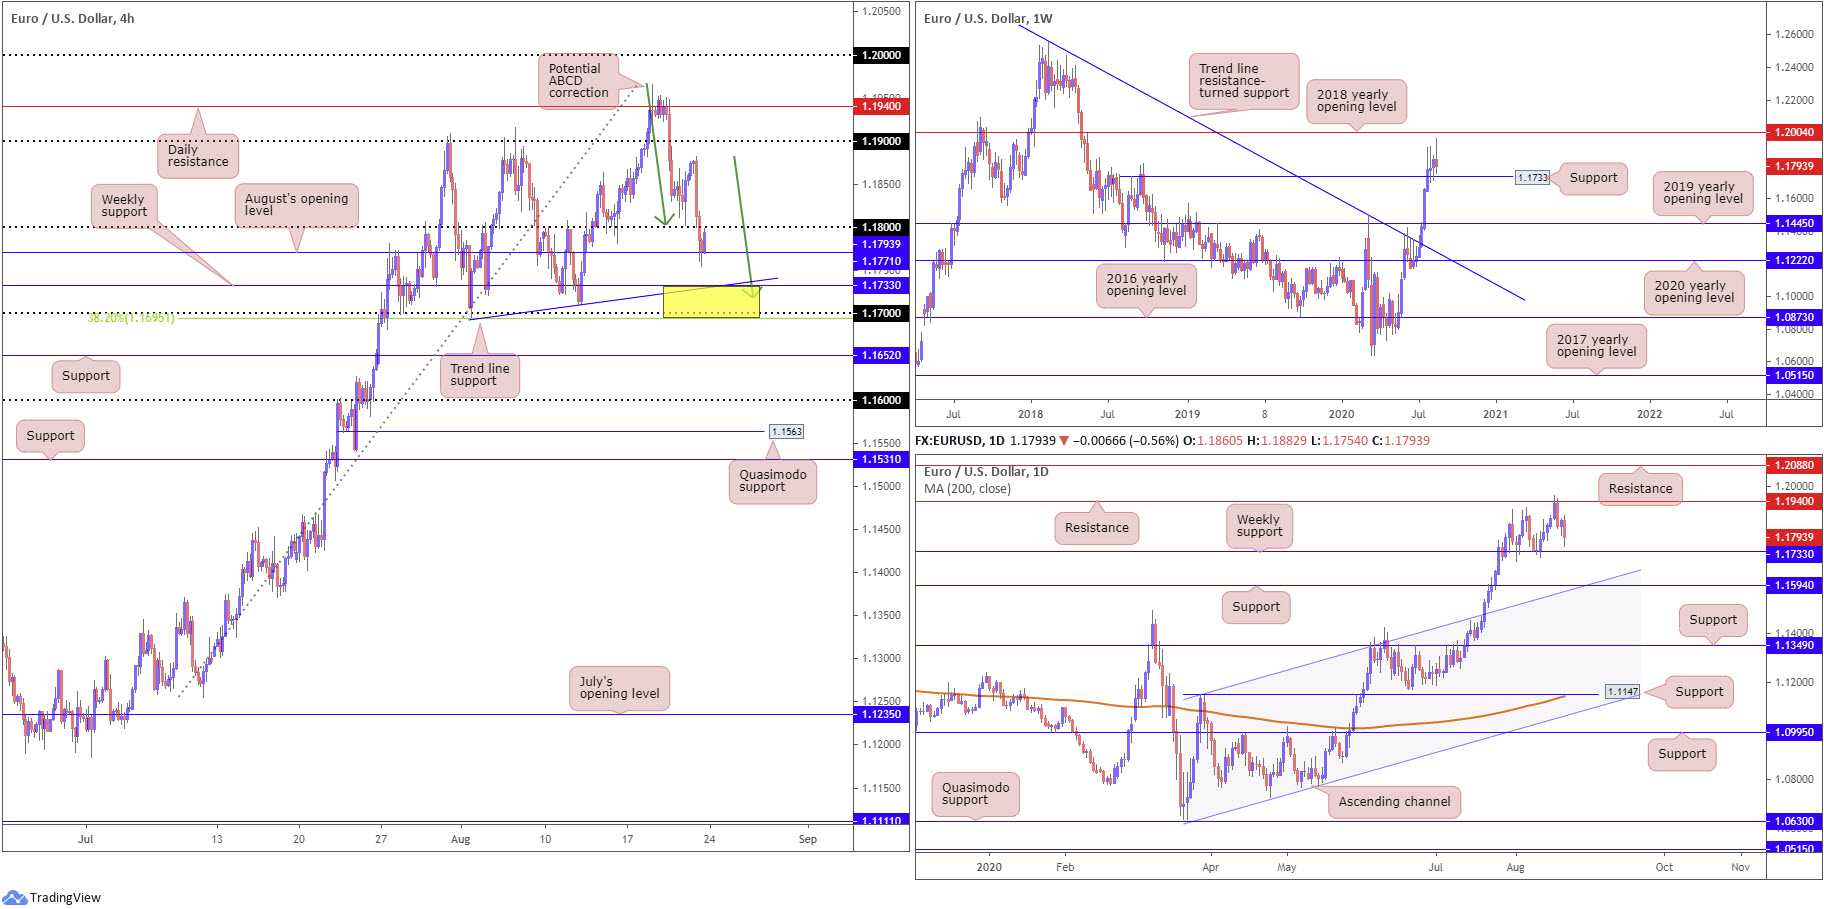
Having the US dollar index mildly snap an eight-week bearish phase, EUR/USD curled south of the 2018 yearly opening level at 1.2004 last week, also modestly snapping an eight-week bullish phase.
Support at 1.1733, a prior Quasimodo resistance level, therefore, is now back on the radar this week, which may be of interest to buyers, considering the recent break of trendline resistance (July 13), extended from the high 1.2555. A 1.1733 breach, on the other hand, unlocks a possible bearish theme towards the 2019 yearly opening level at 1.1445.
Daily perspective:
Resistance at 1.1940 was brought to attention during mid-week trade, putting an end to a six-day bullish phase. Deprived of notable support, in spite of a brief pause Thursday, Friday headed lower and concluded the week within striking distance of weekly support mentioned above at 1.1733.
Breaking 1.1733 on the daily timeframe may witness sellers strengthen their grip this week and approach support coming in at 1.1594, a level fusing with channel resistance-turned support, taken from the high 1.1147.
H4 perspective:
Overall downbeat Eurozone PMIs and additional USD recovery gains Friday led EUR/USD south of 1.18 to test the spirit of August’s opening level at 1.1771. While a 1.18 retest is on the cards, traders are urged to pencil in the possibility of further dips to weekly support highlighted above at 1.1733.
Based on the H4 timeframe, there are a number of technical elements that support the current weekly level, such as trend line support, extended from the low 1.1695, a possible ABCD correction (green arrows) at 1.1716, the round number 1.17 and a 38.2% Fibonacci retracement ratio plotted at 1.1695.
Areas of consideration:
While August’s opening level at 1.1771 on the H4 could send candles back above 1.18 this week, the more prominent area of support rests between the 1.1695/1.1733 region (yellow). Not only does the zone gift appealing confluence (see above), the current trend in this market has faced north since March.
GBP/USD:
Weekly gain/loss: +0.05%
Weekly close: 1.3085
Weekly perspective:
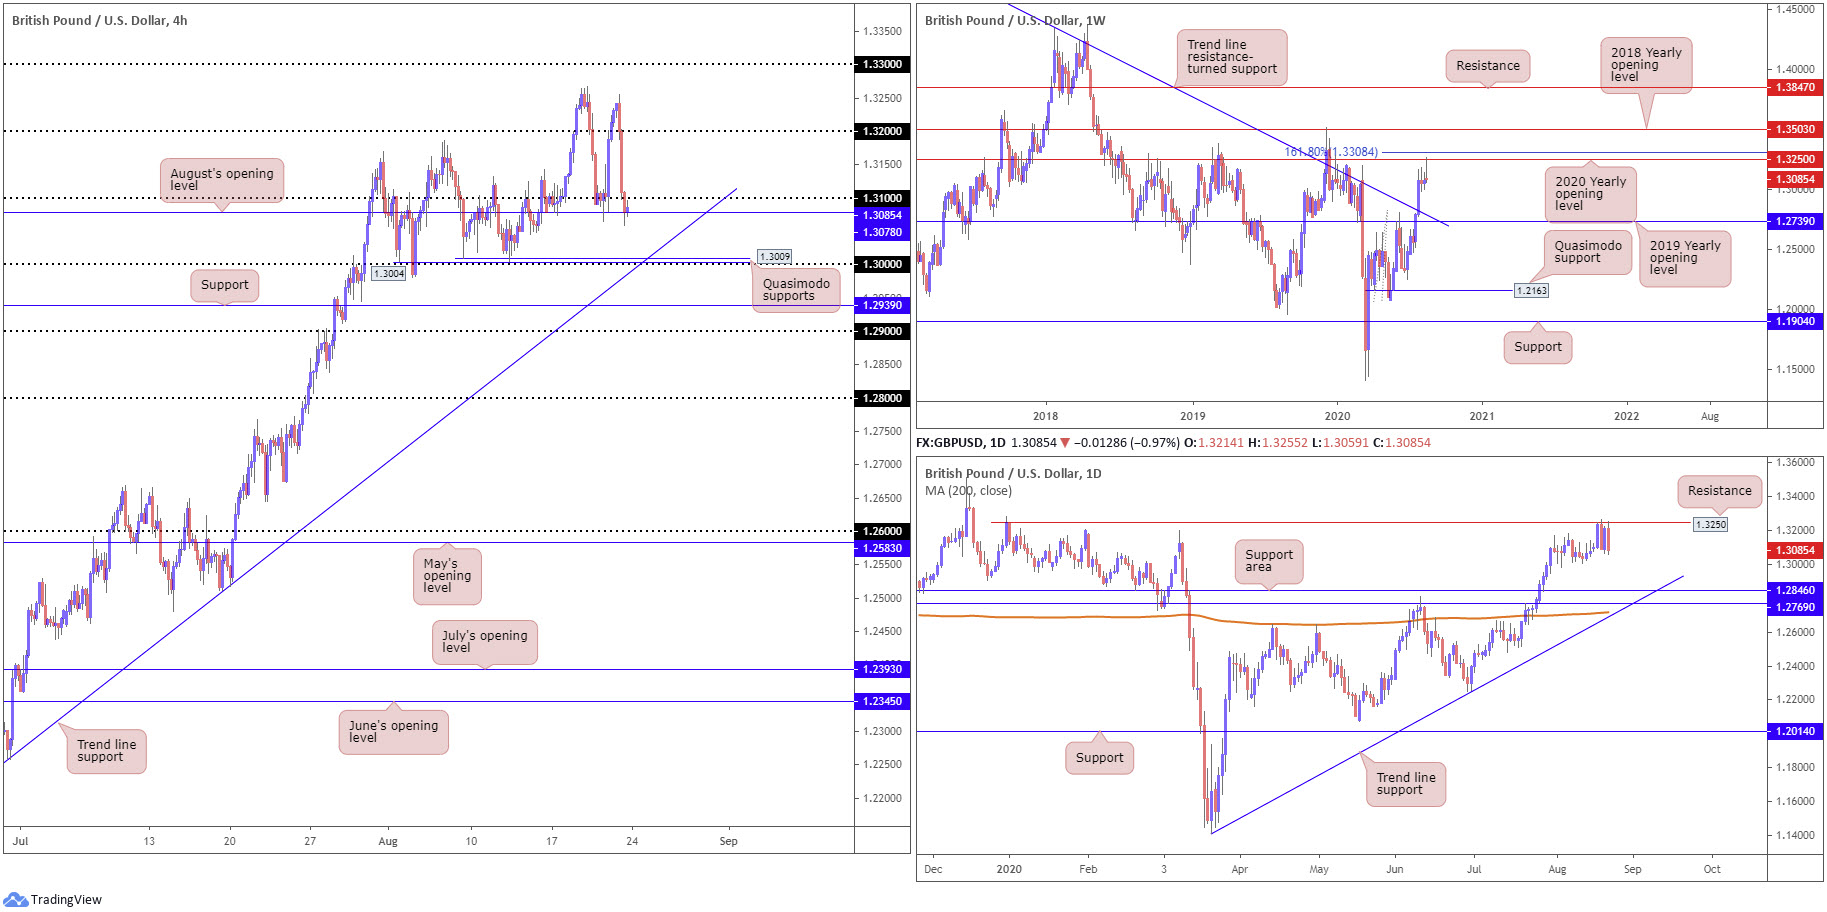
Buyers, as can be seen from the weekly timeframe, lost their flavour last week after shaking hands with the 2020 yearly opening level at 1.3250, a level sited just under a 161.8% Fibonacci extension point at 1.3308. This follows a July 27 trend line resistance (1.5930) break.
Candlestick enthusiasts will also note the week ended in the shape of a gravestone doji candlestick formation, considered a bearish signal at peaks. Retreating further this week hands over the 2019 yearly opening level at 1.2739 as a possible downside target, which happens to fuse closely with the recently penetrated trendline resistance.
Daily perspective:
Daily resistance at 1.3250 was also thrown into the mix mid-week, a barrier sharing the same space with resistance on the weekly timeframe, the 2020 yearly opening level.
Should sellers continue defending current resistance, this week’s spotlight shines towards a daily support area between 1.2769/1.2846, closely shadowed by trend line support, taken from the low 1.1409, and a 200-day SMA (orange – 1.2717). A break higher, however, has the 161.8% Fibonacci extension point at 1.3308 on the weekly timeframe to contend with.
H4 perspective:
Sterling, as you can see, sharply pared earlier gains on Friday (once again trapping breakout buyers north of 1.32), in spite of upbeat retail sales and PMI data. The USD recovery, along with a post-Brexit trade deal no closer to being signed, directed candle action through 1.31 to August’s opening level at 1.3078.
Sidestepping August’s level this week brings light to the key figure 1.30, reinforced by two Quasimodo supports at 1.3004 and 1.3009, as well as trend line support, taken from the low 1.2251.
Areas of consideration:
According to the weekly timeframe, bearish scenarios sub 1.3078 on the H4 may be an avenue traders explore this week, based on weekly price fading the 2020 yearly opening level at 1.3250, shaped by way of a bearish candlestick signal.
Although weekly and daily price show room to stretch beyond 1.30 this week, the psychological level could also invite at least a recovery bid, in view of its local confluence.
AUD/USD:
Weekly gain/loss: -0.16%
Weekly close: 0.7158
Weekly perspective:
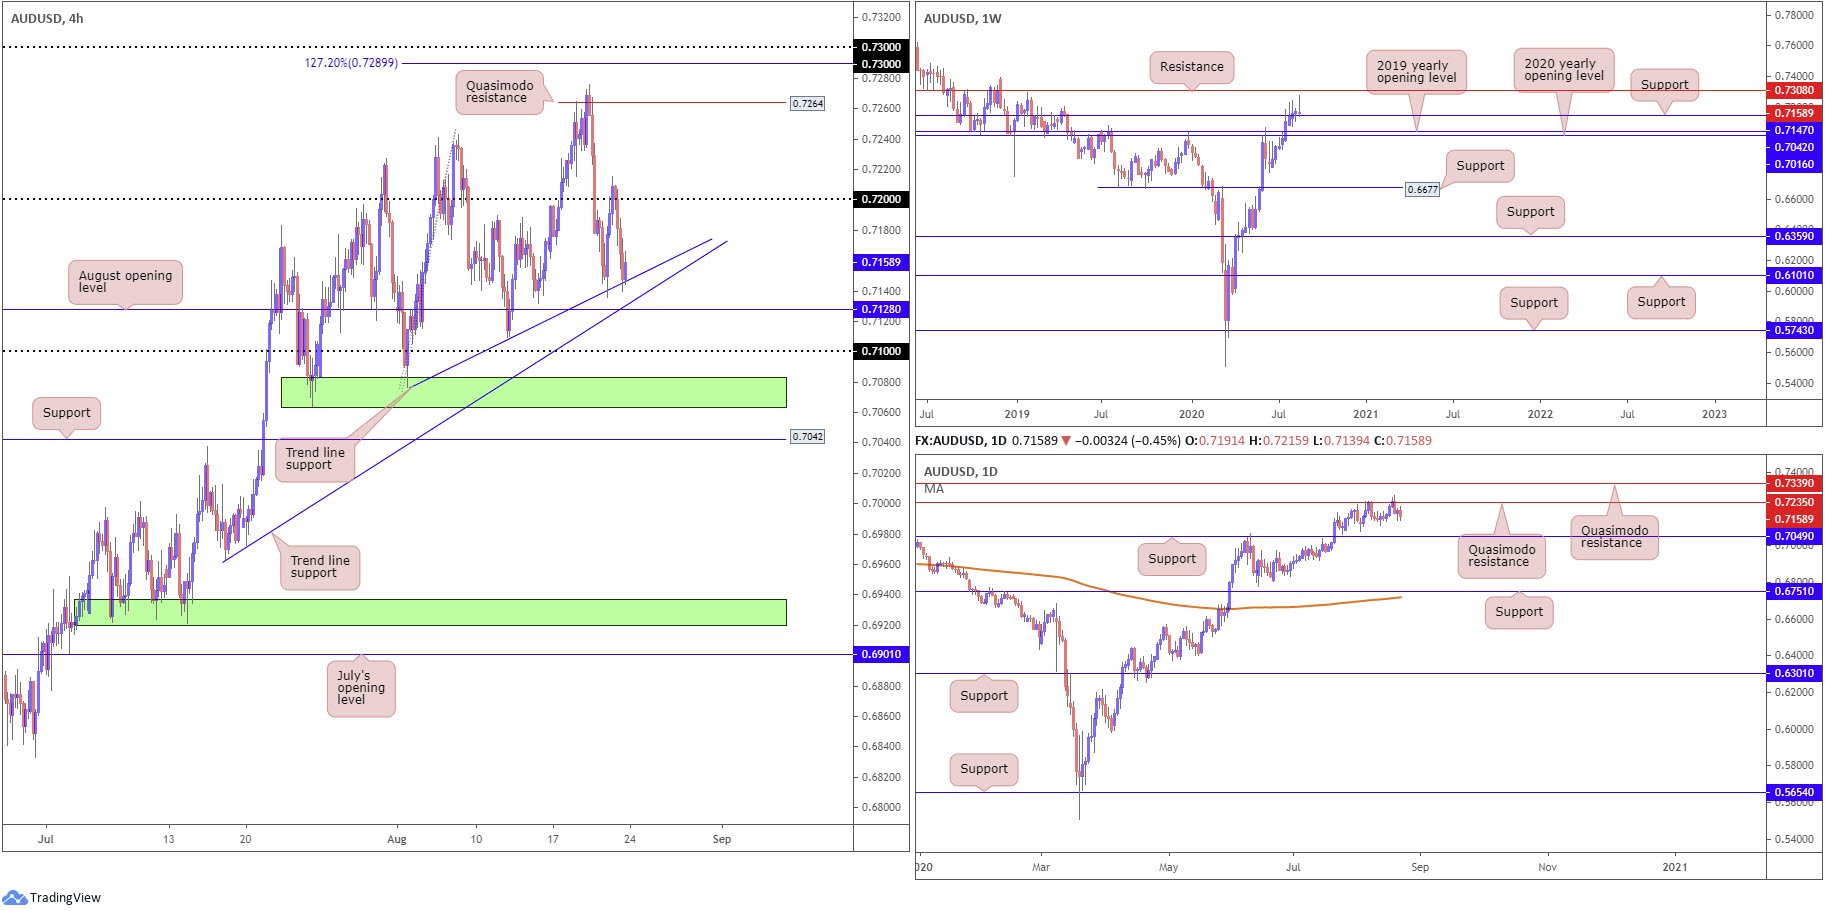
Trading concluded considerably off best levels last week, producing a deep candle wick ahead of resistance coming in at 0.7308.
Support at 0.7147 remains in play, despite the week’s dip. Swallowing the latter this week, nevertheless, draws attention back to the 2020 and 2019 yearly opening levels at 0.7016 and 0.7147, respectively.
Daily perspective:
Although the trend in this market faces a northerly trajectory, Quasimodo resistance at 0.7235 has proven a tough nut to crack since August, with support not expected to make an appearance until 0.7049.
Through the lens of a simple technical trader, though, we can see that each time price rebounds from the Quasimodo formation, sellers have been unable to register fresh lows. This indicates buyers may have the upper hand, forcing a possible 0.7235 break this week.
H4 perspective:
Leaving behind the 0.72 handle, albeit following a fakeout to peaks at 0.7215, AUD/USD cruised lower Friday and reconnected with trend line support, taken from the low 0.7076. Traders will acknowledge additional trend line support exists close by, from the low 0.6963, alongside August’s opening level at 0.7128.
Lower on the curve, the 0.71 handle is also visible, followed by an area of support (green) at 0.7063/0.7083. Above 0.72, however, daily Quasimodo resistance at 0.7235 is an option, followed by H4 Quasimodo resistance at 0.7264.
Areas of consideration:
Weekly support at 0.7147 is likely on the watchlist this week, converging with H4 trend line supports and nearby support, in the shape of August’s opening level (bold).
As a result, although a dip to 0.7128 (maybe even the 0.71 handle at a stretch) may emerge early week, a bid back up to at least 0.72 could be in store.
USD/JPY:
Weekly gain/loss: -0.73%
Weekly close: 105.75
Weekly perspective:
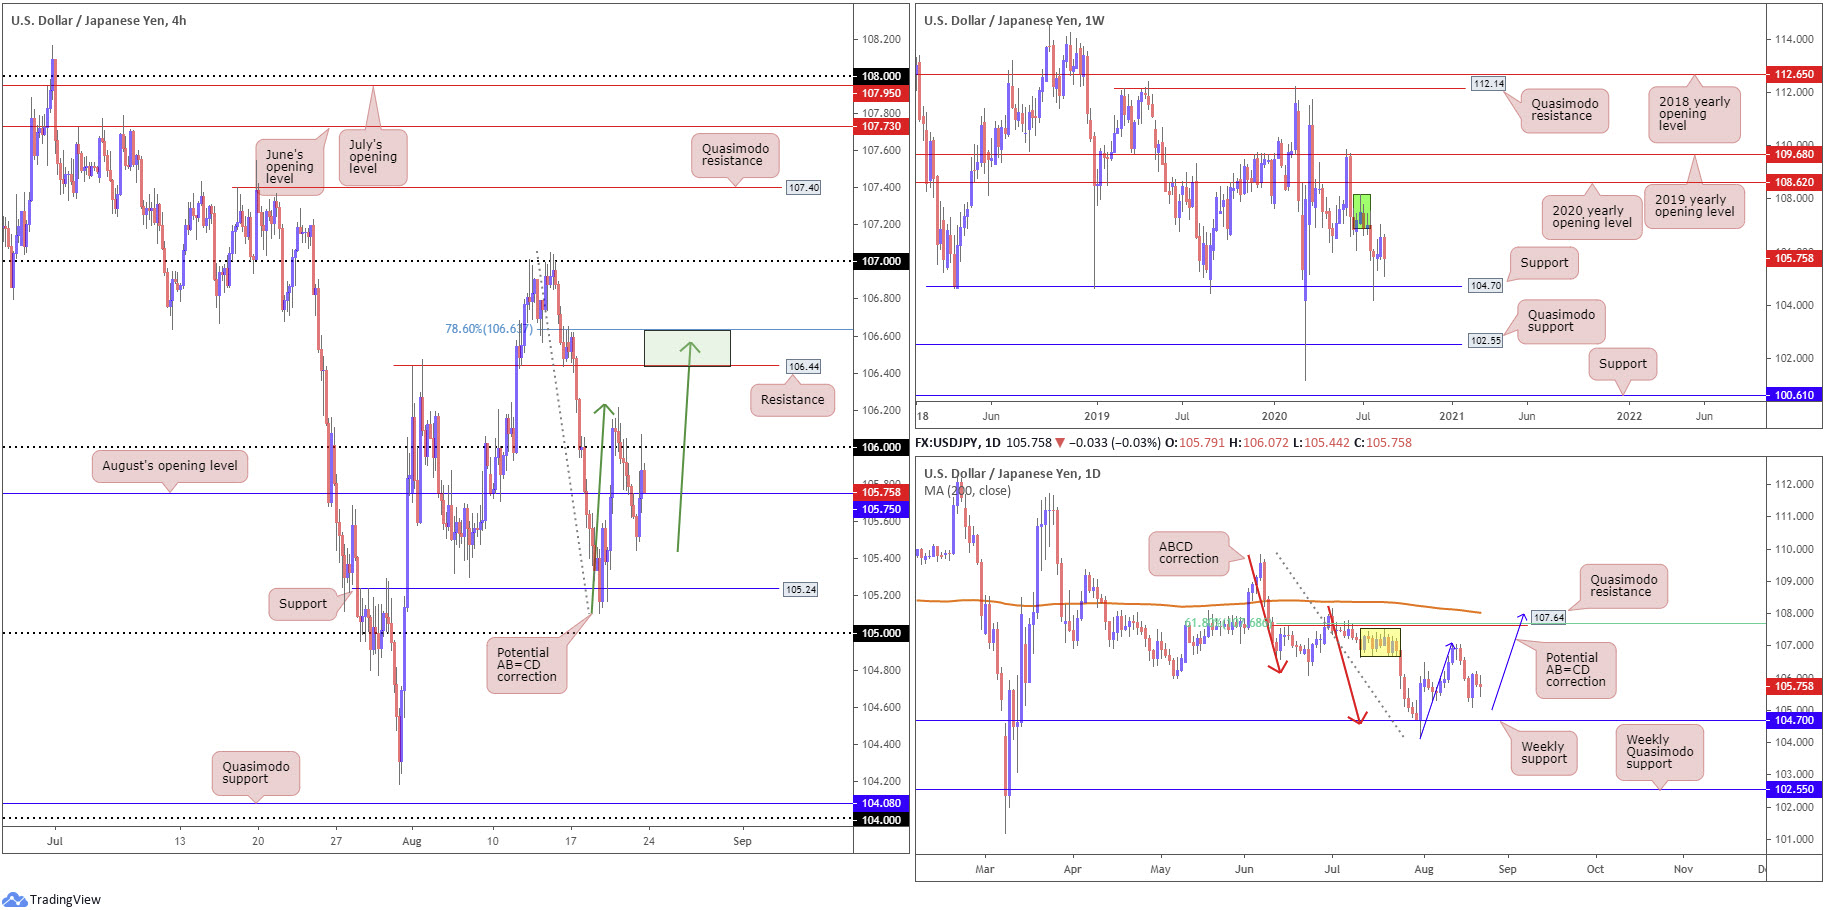
Supply at 108.16-106.88 (green) has so far proven a difficult hurdle to overcome, generating a sizeable downside move last week to lows at 105.10.
Neighbouring structures to keep a tab on this week fall in at support drawn from 104.70, the 2020 yearly opening level at 108.62 and, at a push, the 2019 yearly opening level at 109.68.
Daily perspective:
Wednesday’s rebound, as stated in recent analysis, could be the beginnings of a D-leg to a possible AB=CD bearish correction (blue arrows) at 108.00, while a dip may draw in weekly support mentioned above at 104.70.
Serving nearby the AB=CD structure, traders will also find Quasimodo resistance positioned nearby at 107.64, along with a 61.8% Fibonacci retracement ratio at 107.68 and the 200-day SMA (orange – 108.02).
H4 perspective:
Bolstered by a broad USD advance (the DXY reclaimed 93.00 to the upside), USD/JPY recouped earlier losses Friday, overthrowing August’s opening level at 105.75 and challenging 106.
Gaining a foothold above 106 this week throws resistance at 106.44 in the mix, a level merging closely with a possible AB=CD correction (green arrows) at 106.57 and a 78.6% Fibonacci retracement ratio at 106.64.
Areas of consideration:
Holding north of August’s opening level at 105.75 and breaking 106 not only ignites intraday breakout strategies, it possibly directs attention to the resistance area on the H4 between 106.64/106.44 this week. This may contain enough vigour to swerve things back to 106.
Longer term, we’re watching for more bullish momentum to form, perhaps eventually completing the AB=CD configuration on the daily timeframe.
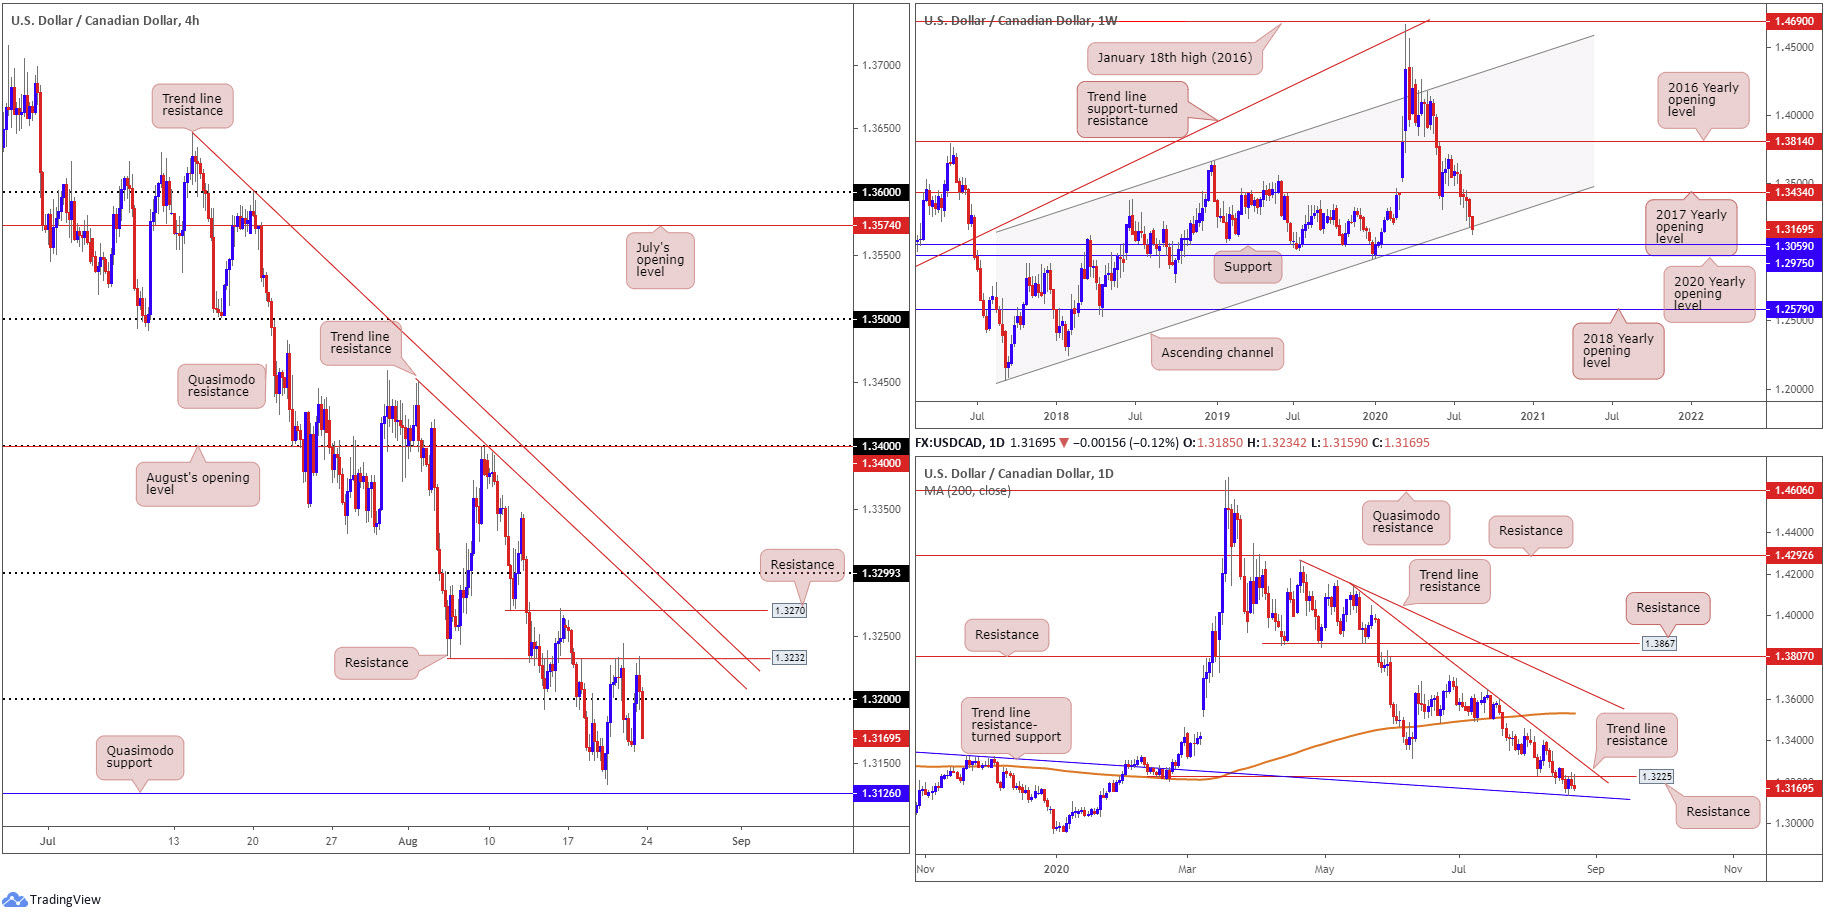
USD/CAD:
Weekly gain/loss: -0.71%
Weekly close: 1.3169
Weekly perspective:
After securing ground beneath the 2017 yearly opening level at 1.3434 at the beginning of August, sellers reached out last week and registered a sixth consecutive weekly loss.
Thanks to recent selling, long-term channel support, taken from the low 1.2061, recently made an appearance. Despite a modest breach, a recovery could spark a 1.3434 retest, while dips may bring on support at 1.3059.
Daily perspective:
Following a mid-week test at trend line resistance-turned support, extended from the high 1.3382, resistance at 1.3225, a prior Quasimodo support level, entered the show.
The above levels remain key barriers this week, potentially helping to determine direction on the weekly timeframe. For example, retaking 1.3225 resistance points to a rebound off the weekly channel support, though do bear in mind daily action must also contend with nearby trend line resistance, taken from the high 1.4140. The current daily trend line support giving up ground, nonetheless, signals weakness off weekly channel support and a possible push for weekly support at 1.3059.
H4 perspective:
Resistance at 1.3232, joined closely with daily resistance at 1.3225, has so far served intraday sellers well, capping upside since the beginning of the week, with H4 concluding Friday strongly sub 1.32.
Aside from possible support developing off Wednesday’s low at 1.3133 and Friday’s low at 1.3159, structurally we have Quasimodo support placed at 1.3126 as a downside target south of 1.32. 1.3126, interestingly, lines up with the daily trend line resistance-turned support (1.3382).
Areas of consideration:
In a nutshell, buyers and sellers are battling for position around weekly channel support – buyers have yet to make much of a show here. Daily price trades under resistance at 1.3225, facing trend line support nearby. H4 is offered south of 1.32, with potential to test Quasimodo support at 1.3126, a level converging with daily trend line support.
On account of the above, sellers beneath 1.32 must acknowledge that although they trade with the current trend and off daily resistance, they face the possibility of weekly buyers entering the fray from channel support.
Another possible scenario to watch for this week is a bounce from H4 Quasimodo support at 1.3126 should we reach this far south, given daily convergence. However, this level may require additional confirmation having seen weekly price could stretch to 1.3059.
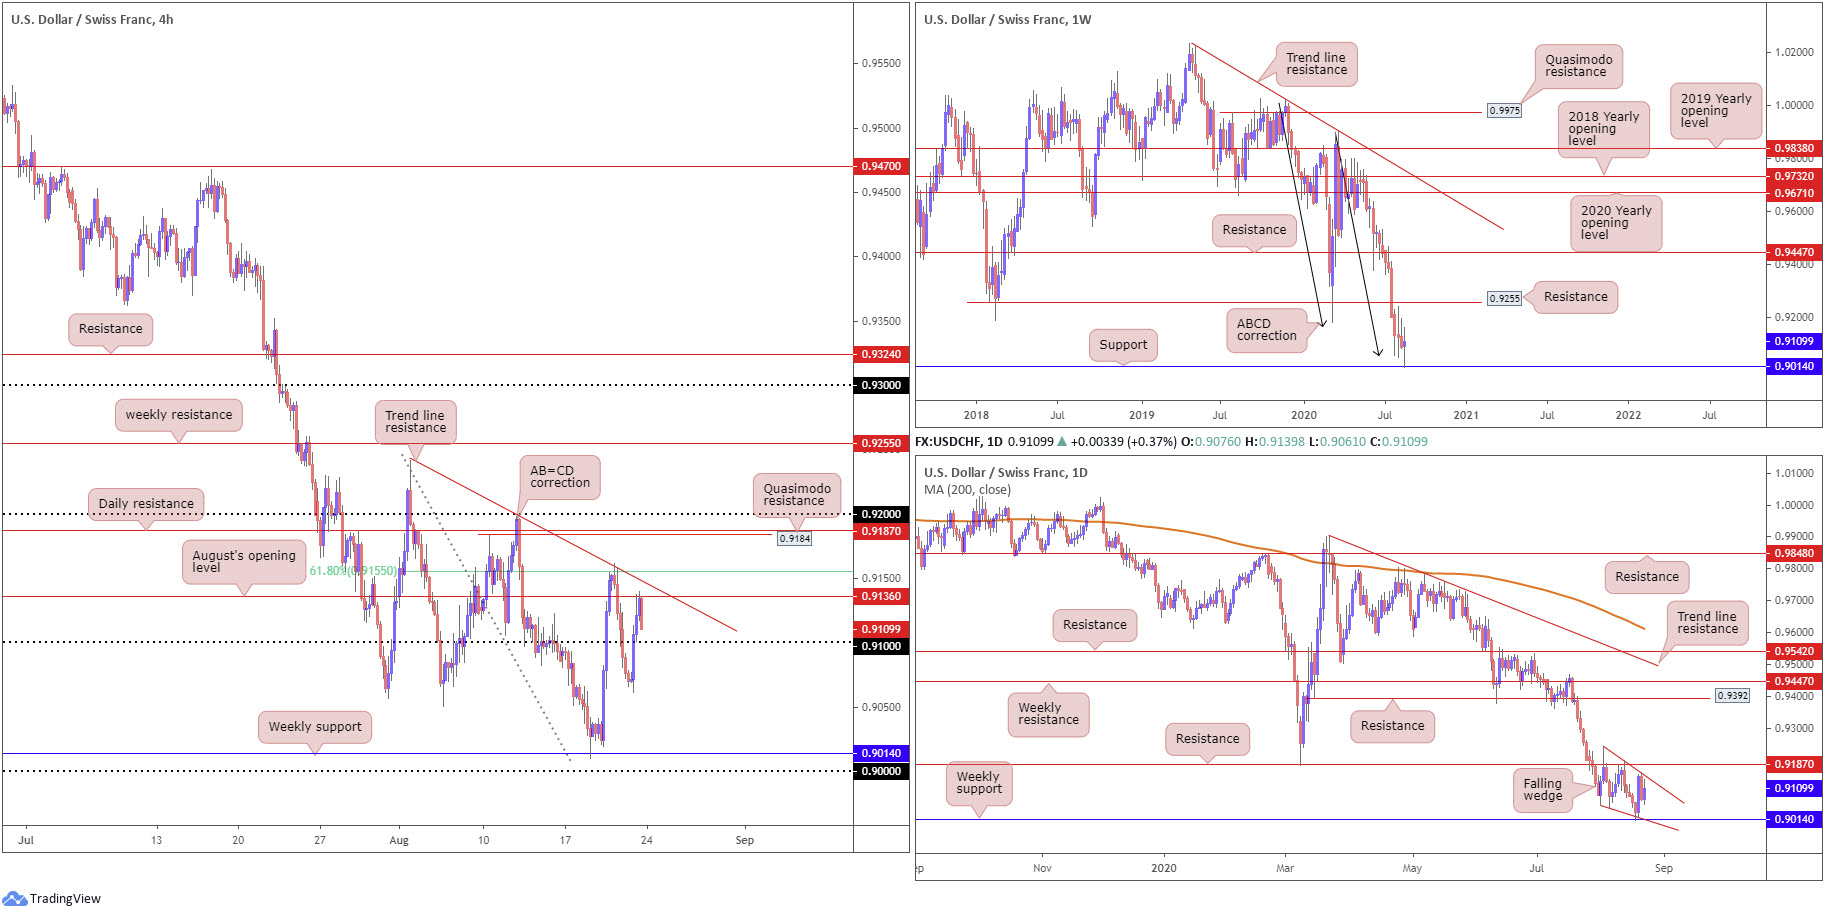
USD/CHF:
Weekly gain/loss: +0.27%
Weekly close: 0.9109
Weekly perspective:
The key observation on the weekly timeframe is price action recently knocking on the door of support at 0.9014. The moderate reaction from the base, likely gleaning additional impetus from ABCD support at 0.9051 (black arrows), snapped an eight-week bearish phase, bringing light to resistance parked at 0.9255, a prior Quasimodo support level.
Beyond current support, the next layer of support is not visible until reaching 0.8792.
Daily perspective:
Since kicking off the month of August, the candles have been establishing a falling wedge pattern, pencilled in from the high 0.9241 and a low of 0.9056. Penetrating this pattern to the upside this week, preferably also taking out resistance at 0.9187, is likely enough to persuade a reversal and attempt an approach to at least weekly resistance mentioned above at 0.9255, followed by the falling wedge take-profit target (can be measured once a breakout occurs).
H4 perspective:
A day after a 0.8% correction, USD/CHF bulls entered an offensive phase Friday and reclaimed a large portion of recent downside.
Friday surged through 0.91 and crossed swords with August’s opening level at 0.9136. Considerable resistance, as you can probably see, lies nearby, including trend line resistance, taken from the high 0.9241, a 61.8% Fibonacci retracement ratio at 0.9155, followed by Quasimodo resistance at 0.9184, a level buffered by daily resistance underscored above at 0.9187.
Areas of consideration:
The rebound from weekly support at 0.9014 is significant in this market, particularly as it’s joined with a falling wedge pattern on the daily timeframe, signalling downside momentum could be diminishing. To take advantage of higher timeframe structure, based on the H4 timeframe, a H4 close above 0.92 is needed, targeting weekly resistance at 0.9255. Therefore, this may not come to fruition this week, given the resistances seen before reaching 0.92.
A dip could also form back to weekly support at 0.9014 this week, though this time taking the key figure 0.90 on the H4 to accumulate fresh buyers. As such, breaking 0.91 to the downside on the H4 could be an early cue we’re heading for the weekly level, consequently, offering an opportunity to consider intraday bearish strategies to the 0.90 neighbourhood.
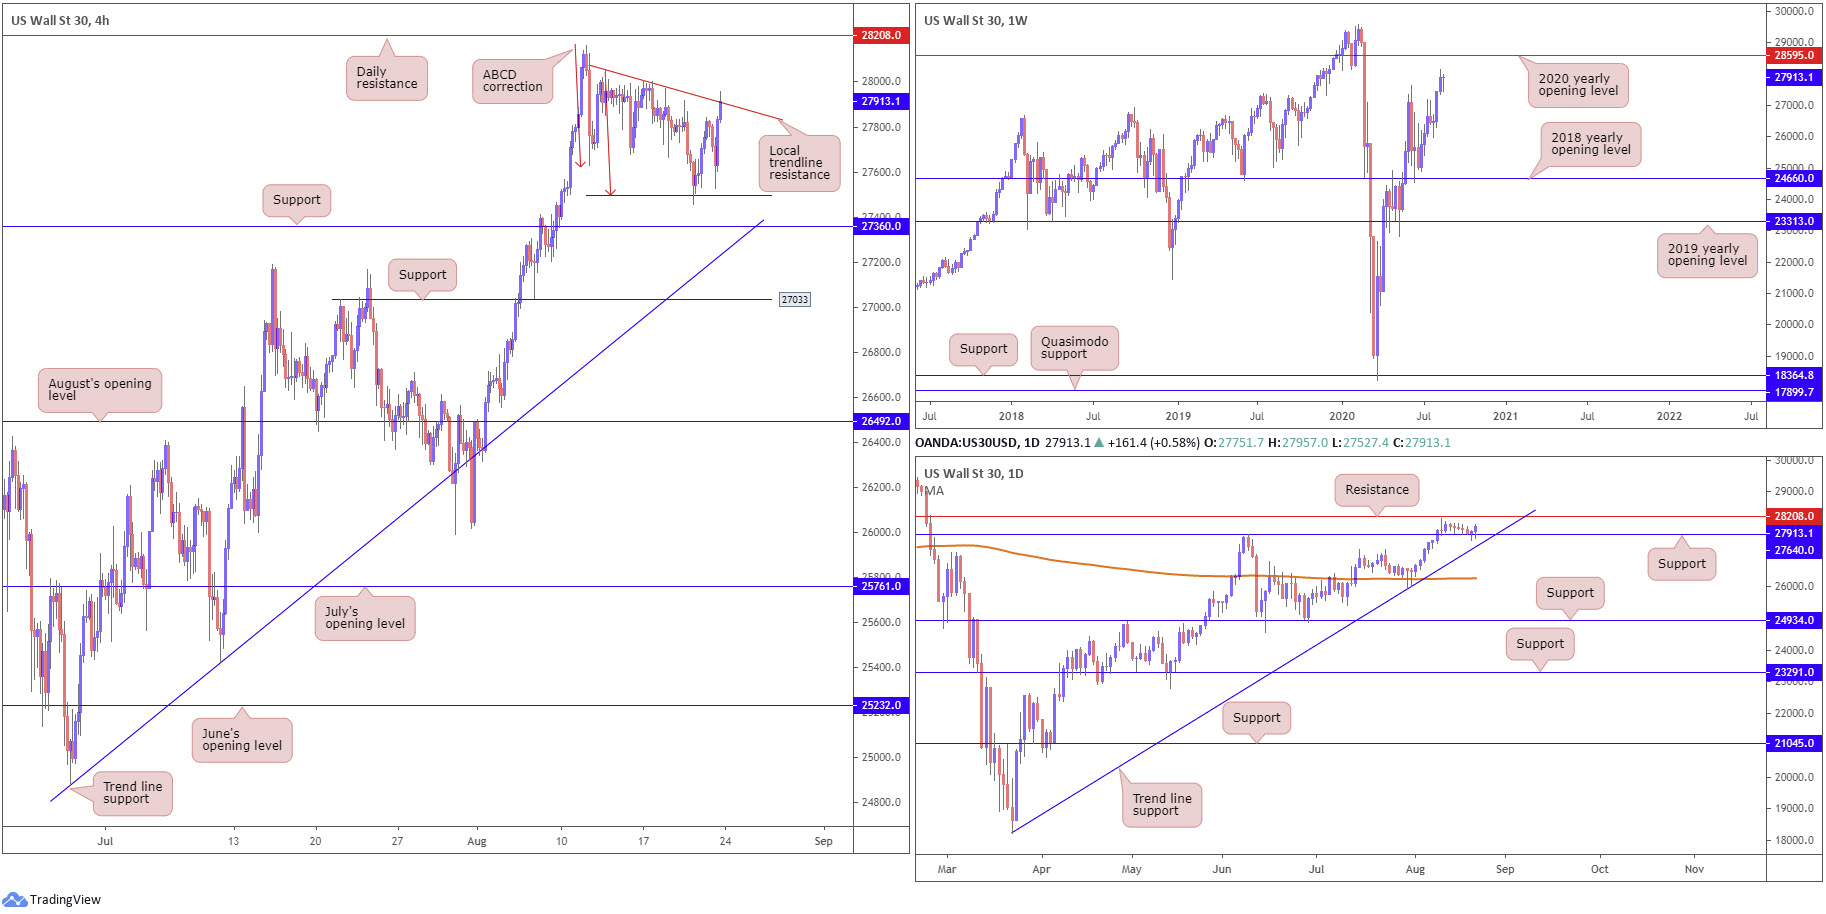
Dow Jones Industrial Average:
Weekly gain/loss: +0.10%
Weekly close: 27913
Weekly perspective:
Significantly off worst levels, the unit chalked up modest gains into the close last week, albeit lingering within the prior week’s range between 28161/27354.
In spite of the recent lacklustre performance, price is still poised to make a run for the 2020 yearly opening level at 28595.
Daily perspective:
A closer examination of price movement on the daily timeframe reveals buyers made a stand off support at 27640 into the second half of the week.
Friday’s follow-through momentum swings focus to resistance at 28208 this week, with a break revealing the weekly resistance underlined above at 28595.
H4 perspective:
US equities traded higher across the board Friday, with the Dow Jones Industrial Average gaining on the back of an advance in Apple. The Dow Jones Industrial Average rallied 190.60 points, or 0.69%; the S&P 500 advanced 11.65 points, or 0.34% and the tech-heavy Nasdaq 100 traded higher by 78.11 points, or 0.68%.
Traders witnessed a H4 ABCD bullish correction at 27495 (red arrows) contain price ahead of support at 27360 on Thursday. H4 trend line resistance, extended from the high 28051, thanks to momentum derived off the ABCD structure, entered play as we closed out Friday. A break of the current trend line may liberate buyers to daily resistance at 28208.
Areas of consideration:
With daily support at 27640 firmly in the frame, along with a H4 ABCD correction recently forming and weekly price exhibiting scope to approach the 2020 yearly opening level at 28595, a violation of current H4 trend line resistance could be seen early in the week.
The recent test of H4 trend line resistance may have buyers from the ABCD structure reduce risk to breakeven and bank partial profits, with many hoping to at least see daily resistance at 28208 this week, followed by 28595 on the weekly timeframe.
A break of the aforementioned trend line will also likely attract fresh buying.
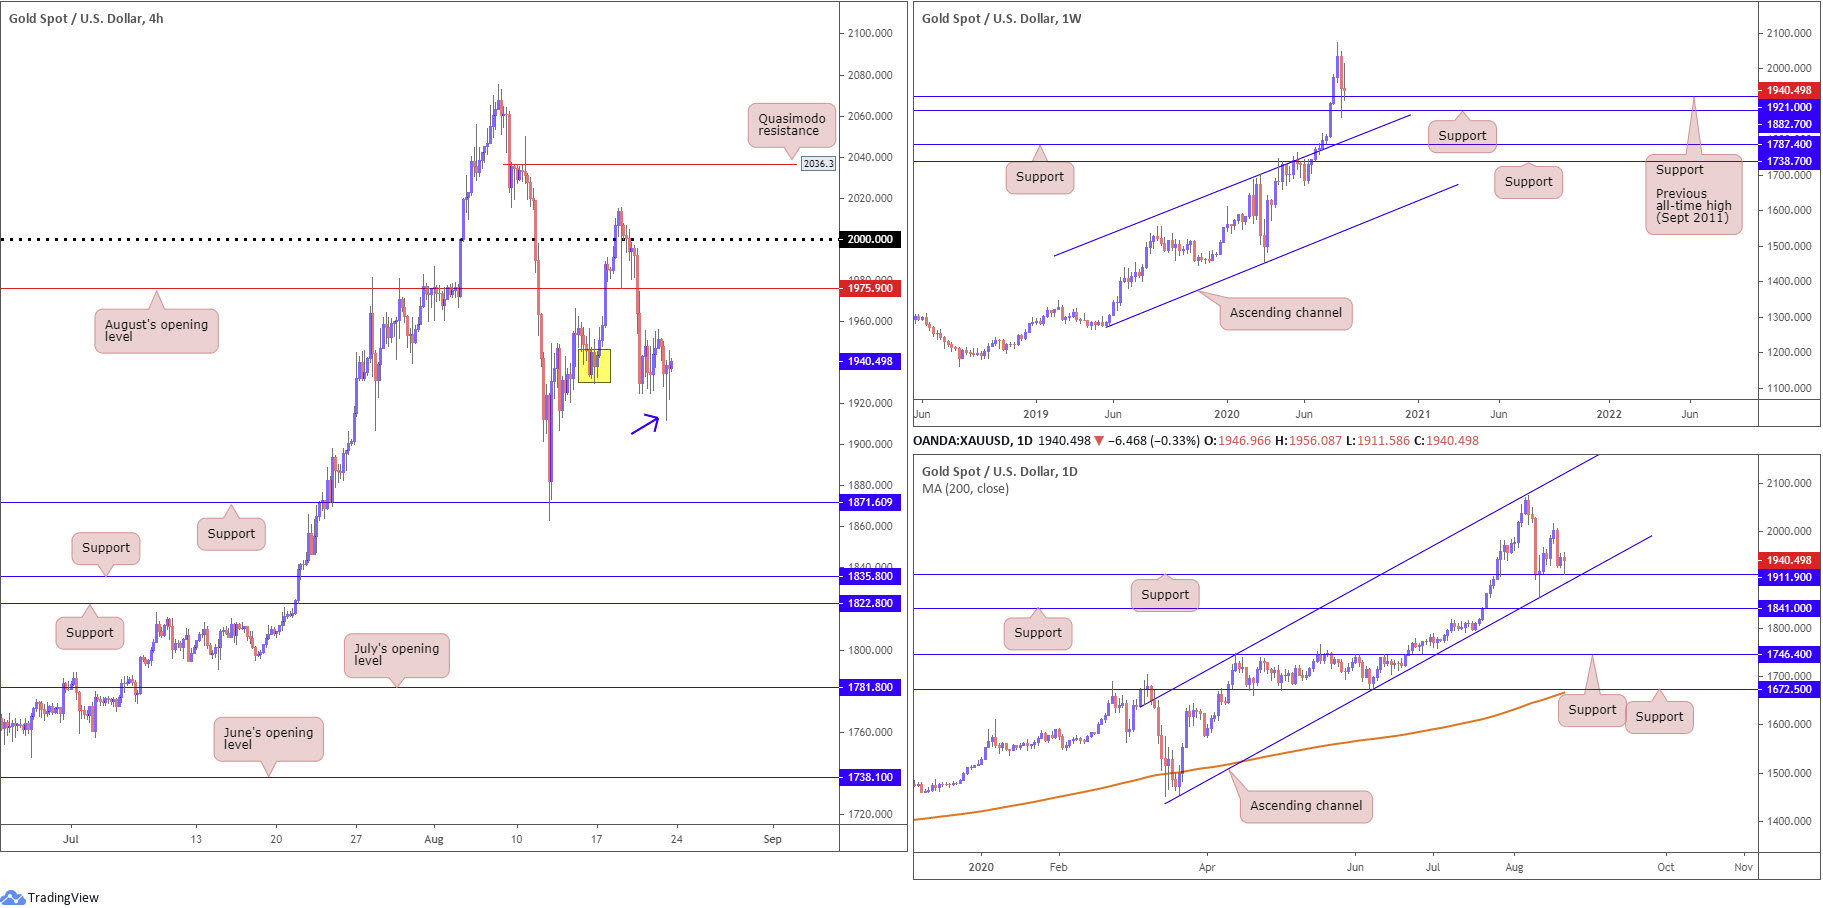
XAU/USD (GOLD):
Weekly gain/loss: -0.22%
Weekly close: $1,940.49
Weekly perspective:
Spot gold finished the week in modestly negative territory, though noticeably off prior-week lows at $1,862.89.
$1,921.00, the previous major all-time high (September 2011), along with support at $1,882.70, made an appearance in recent weeks, following a correction from all-time peaks at $2,075.28.
With the current trend trekking north since 2016, the combination of $1,882.70 and $1,921.00 may be enough to encourage dip-buying this week. Failure to hold, we could see channel resistance-turned support, etched from the high $1,703.28, enter play.
Daily perspective:
Since mid-March, daily flow has been compressing within the walls of an ascending channel configuration, taken from $1,455.32 and $1,747.72. Over the past couple of weeks, we have seen price action reconnect with channel support, together with support at $1,911.90.
Notably, Friday rebounded from $1,911.90, closing in the shape of a half-hearted hammer candle pattern. Aside from the $2,015.72 August 18 high, limited resistance is in view.
H4 perspective:
For those who read Friday’s technical briefing you may recall the following (italics):
Between $1,911.90 (daily support) and $1,921.00 (weekly level) is an area crosshairs will likely be fixed on, given H4 candles engulfed demand (yellow) at $1,930.34-$1,946.28. A notable H4 bullish candlestick forming within the aforementioned higher timeframe area may see a recovery take over and perhaps a revisit at August’s opening level from $1,975.90.
As evident from the H4 chart, a hammer candlestick signal developed Friday (blue arrow – considered a bullish signal) after testing the higher timeframe zone.
Areas of consideration:
Coming from the higher timeframe support area at $1,911.90-$1,921.00 and producing a H4 bullish candlestick signal heading into the close is likely to draw a positive tone early week, possibly returning to the underside of August’s opening level from $1,975.90 on the H4, and, quite possibly, the $2,000.00 mark.
The accuracy, completeness and timeliness of the information contained on this site cannot be guaranteed. IC Markets does not warranty, guarantee or make any representations, or assume any liability regarding financial results based on the use of the information in the site.
News, views, opinions, recommendations and other information obtained from sources outside of www.icmarkets.com.au, used in this site are believed to be reliable, but we cannot guarantee their accuracy or completeness. All such information is subject to change at any time without notice. IC Markets assumes no responsibility for the content of any linked site.
The fact that such links may exist does not indicate approval or endorsement of any material contained on any linked site. IC Markets is not liable for any harm caused by the transmission, through accessing the services or information on this site, of a computer virus, or other computer code or programming device that might be used to access, delete, damage, disable, disrupt or otherwise impede in any manner, the operation of the site or of any user’s software, hardware, data or property.


