Waiting for lower timeframe confirmation is our main tool to confirm strength within higher timeframe zones, and has really been the key to our trading success. It takes a little time to understand the subtle nuances, however, as each trade is never the same, but once you master the rhythm so to speak, you will be saved from countless unnecessary losing trades. The following is a list of what we look for:
- A break/retest of supply or demand dependent on which way you’re trading.
- A trendline break/retest.
- Buying/selling tails/wicks – essentially we look for a cluster of very obvious spikes off of lower timeframe support and resistance levels within the higher timeframe zone.
- Candlestick patterns. We tend to stick with pin bars and engulfing bars as these have proven to be the most effective.
We typically search for lower-timeframe confirmation between the M15 and H1 timeframes, since most of our higher-timeframe areas begin with the H4. Stops are usually placed 3-5 pips beyond confirming structures.
EUR/USD:
Weekly gain/loss: + 122 pips
Weekly closing price: 1.0724
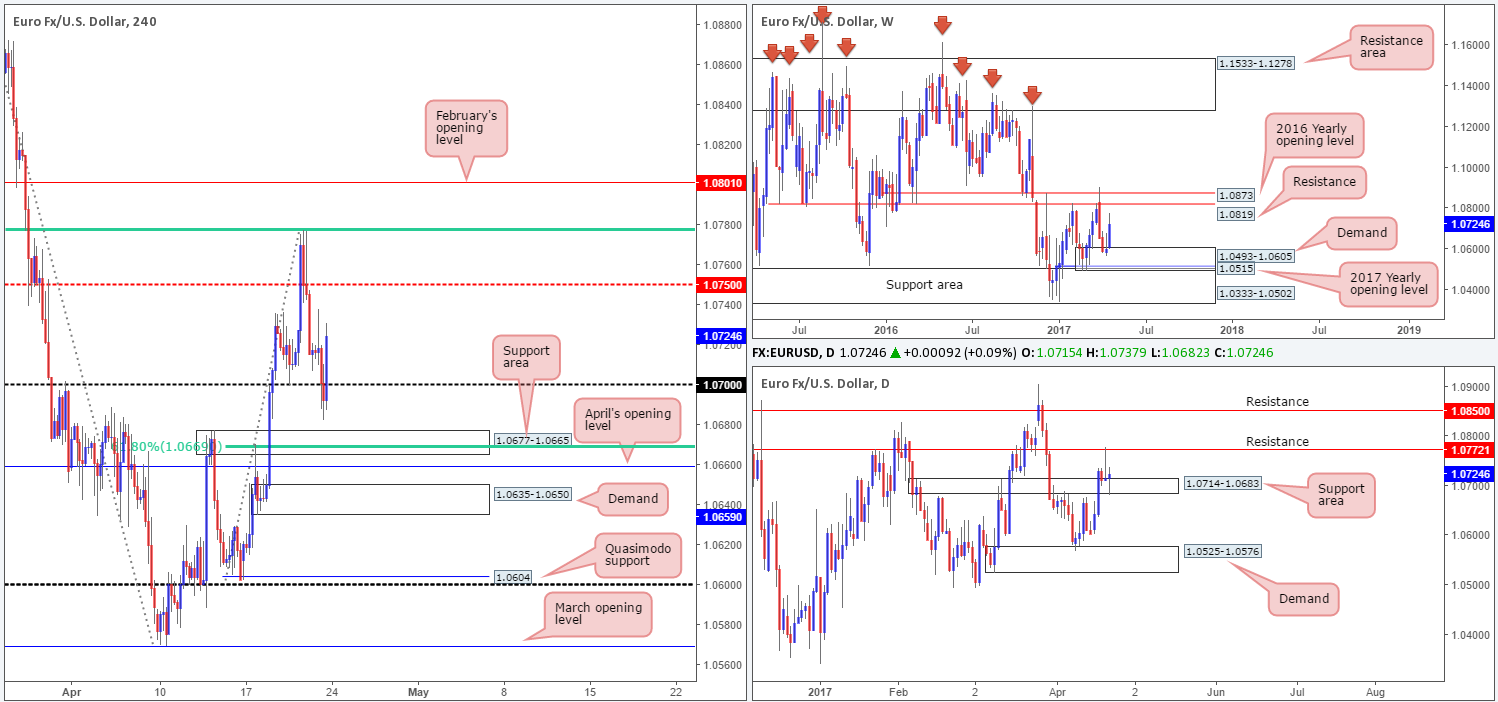
Downside momentum diminished last week as weekly buyers actively defended 1.0493-1.0605: a demand area that’s beautifully positioned around the top edge of the 2017 yearly opening level at 1.0515/support zone at 1.0333-1.0502. Looking above, the next areas to keep an eyeball on this week are resistance at 1.0819 and the 2016 yearly opening level at 1.0873.
On Thursday, we saw daily price chalk up a selling wick off the underside of resistance planted at 1.0772. Some follow-through action was generated on Friday but was not sufficient enough to overcome the nearby support area seen at 1.0714-1.0683. In the event of a break above the current resistance this week, the next upside angle comes in at 1.0850 (another resistance), whereas a violation of the current support area could find the pair looking to test demand pegged at 1.0525-1.0576.
A brief look at recent dealings on the H4 chart shows the 1.07 handle suffered a rather brutal whipsaw going into Friday’s US segment. Despite this, the major ended the day relatively unchanged, closing mid-range between the mid-level resistance at 1.0750 and 1.07.
Our suggestions: Thursday’s response to the H4 61.8% Fib resistance (upper green line) at 1.0777 (taken from the high 1.0905) is interesting, given that it’s bolstered by the noted daily resistance at 1.0772. Therefore, this region is a zone we’ll be watching today for potential shorts. Below 1.07, nevertheless, we have a H4 support area sitting at 1.0677-1.0665 that fuses with a H4 61.8% Fib support at 1.0669. Furthermore, this zone is located just below the current daily support area, so a bounce from here is a possibility. However, traders may want to take into account that April’s opening level at 1.0659 is waiting just below this, so be prepared for a possible fakeout!
The opening and early trading will, however, likely be dependent on the outcome of the French Presidential Election. Therefore, we’d advise trading cautiously, at least until the dust settles.
Data points to consider: German IFO business climate at 9am. FOMC member Kashkari speaks at 4.30 and again at 8.30pm GMT+1.
Levels to watch/live orders:
- Buys: 1.0677-1.0665 ([waiting for a reasonably sized H4 bull candle to form before pulling the trigger is advised] stop loss: ideally beyond the candle’s tail).
- Sells: 1.0777 neighborhood ([waiting for a lower-timeframe confirming signal to form is advised before pulling the trigger [see the top of this report] stop loss: dependent on where one confirms the area).
GBP/USD:
Weekly gain/loss: + 285 pips
Weekly closing price: 1.2806
The weekly trendline resistance extended from the high 1.2774 was aggressively taken out last week, thus allowing weekly price to marginally close beyond resistance at 1.2789. This could, technically speaking, imply that the buyers might look to challenge supply this week at 1.3120-1.2957.
Since Tuesday, the daily candles have been consolidating between a support established from the 6th December high 1.2774 and a 61.8% Fib resistance (green line) at 1.2859 (taken from the high 1.3445). Also noteworthy here is the nearby 161.8% Fib extension at 1.2920 drawn from the low 1.2108 (brown line).
A quick recap of Friday’s trading on the H4 chart shows that price dropped to a fresh low of 1.2756 going into the early hours of the US segment. Leaving the mid-level support 1.2750 unchallenged, the unit ended the week closing six pips above 1.28.
Based on this recent movement, the crosshairs are fixed on 1.2750 (green area) for an intraday bounce north today. Why here? Well, not only are mid-level numbers watched by the majority of the market, there’s also a H4 AB=CD 127.2% Fib extension seen nearby at 1.2736 (drawn from the high 1.29) that unites closely with a broken Quasimodo line pegged at 1.2744.
Our suggestions: Our rationale behind looking for a bounce off 1.2736/1.2750, apart from the H4 confluence, is also the fact that this zone is planted directly beneath the current daily support. Therefore, it may perhaps be a fantastic base to help facilitate a fakeout! The only grumble, of course, is that weekly sellers could still be active from resistance mentioned above at 1.2789, hence the reason for not expecting much more than an intraday bounce from this region!
Data points to consider: FOMC member Kashkari speaks at 4.30 and again at 8.30pm GMT+1.

Levels to watch/live orders:
- Buys: 1.2736/1.2750 ([dependent on the time of day, this small zone could be stable enough to consider an intraday trade long from] stop loss: at least five pips beyond the lower edge).
- Sells: Flat (stop loss: N/A).
AUD/USD:
Weekly gain/loss: – 31 pips
Weekly closing price: 0.7543
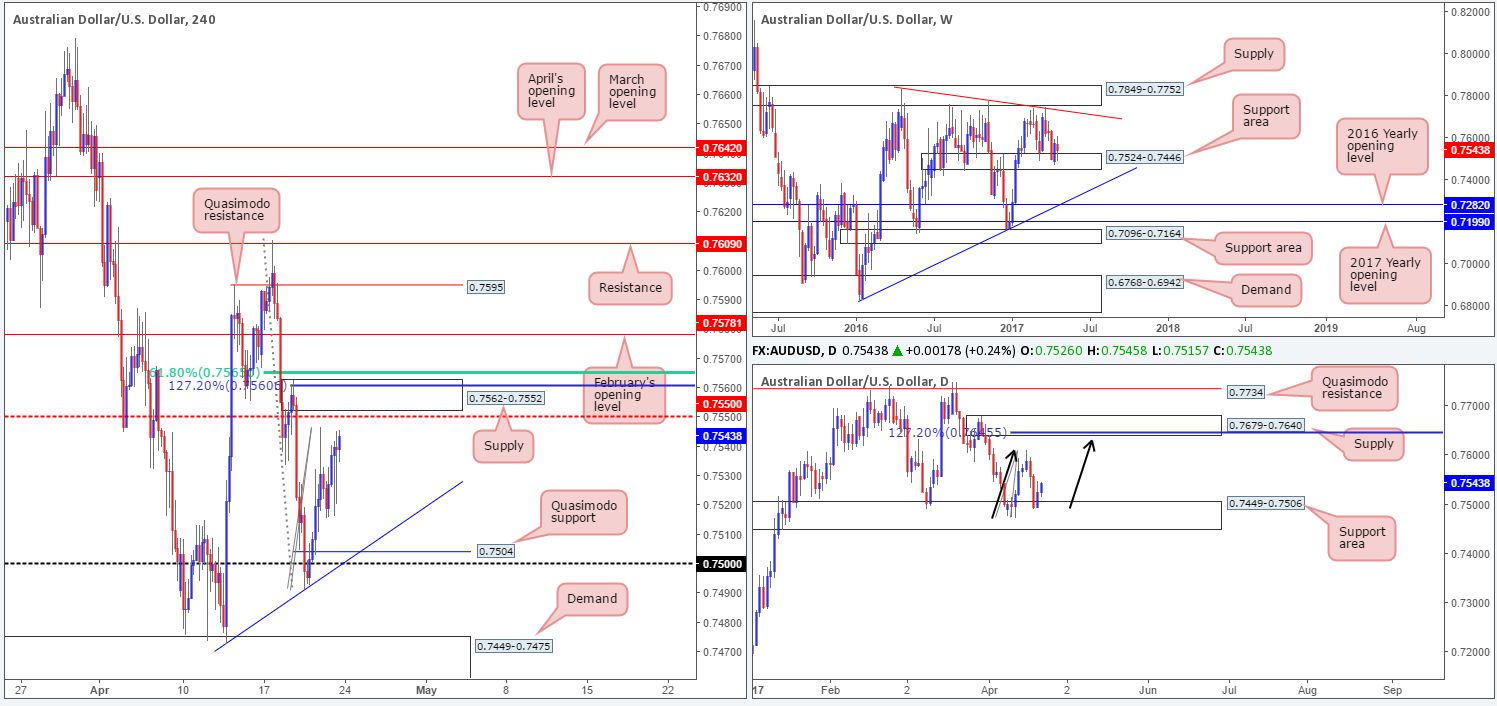
As can be seen from the weekly chart, the bulls failed to generate much follow through after the prior week’s bounce from the support area marked at 0.7524-0.7446. Should the buyers eventually regain consciousness here, however, the next upside hurdle can be seen at a trendline resistance taken from the high 0.7835, followed closely by supply at 0.7849-0.7752.
Thursday’s bounce (and Friday’s follow through) seen from the support area at 0.7449-0.7506 (housed within the above said weekly support area) is interesting. The reason? In the event that the bulls continue to bid price into positive territory from here, an AB=CD formation may complete (black arrows), which, as seen by the AB=CD 127.2% Fib ext. at 0.7645, ties in beautifully with supply at 0.7679-0.7640. For that reason, the bulls may still have a hand in this fight.
Switching gears and moving over to the H4 chart, nevertheless, our team has noted a group of potentially troublesome resistances ahead. First in line is the mid-level resistance at 0.7550, then a supply at 0.7562-0.7552, followed with an AB=CD 127.2% Fib ext. at 0.7560 chiseled from the low 0.7491, and finally a 61.8% Fib resistance at 0.7565 drawn from the high 0.7610.
Our suggestions: We’re sure you’ll agree with us that going long, despite what the higher-timeframe structures suggest, would be chancy owing to the said H4 resistances. And likewise, a short, although tempting given the confluence, would be just as much of a risk. With that in mind, we’ll remain on the sidelines for the time being and reassess structure around Tuesday’s open.
Data points to consider: FOMC member Kashkari speaks at 4.30 and again at 8.30pm GMT+1.
Levels to watch/live orders:
- Buys: Flat (stop loss: N/A).
- Sells: Flat (stop loss: N/A).
USD/JPY:
Weekly gain/loss: + 39 pips
Weekly closing price: 108.95
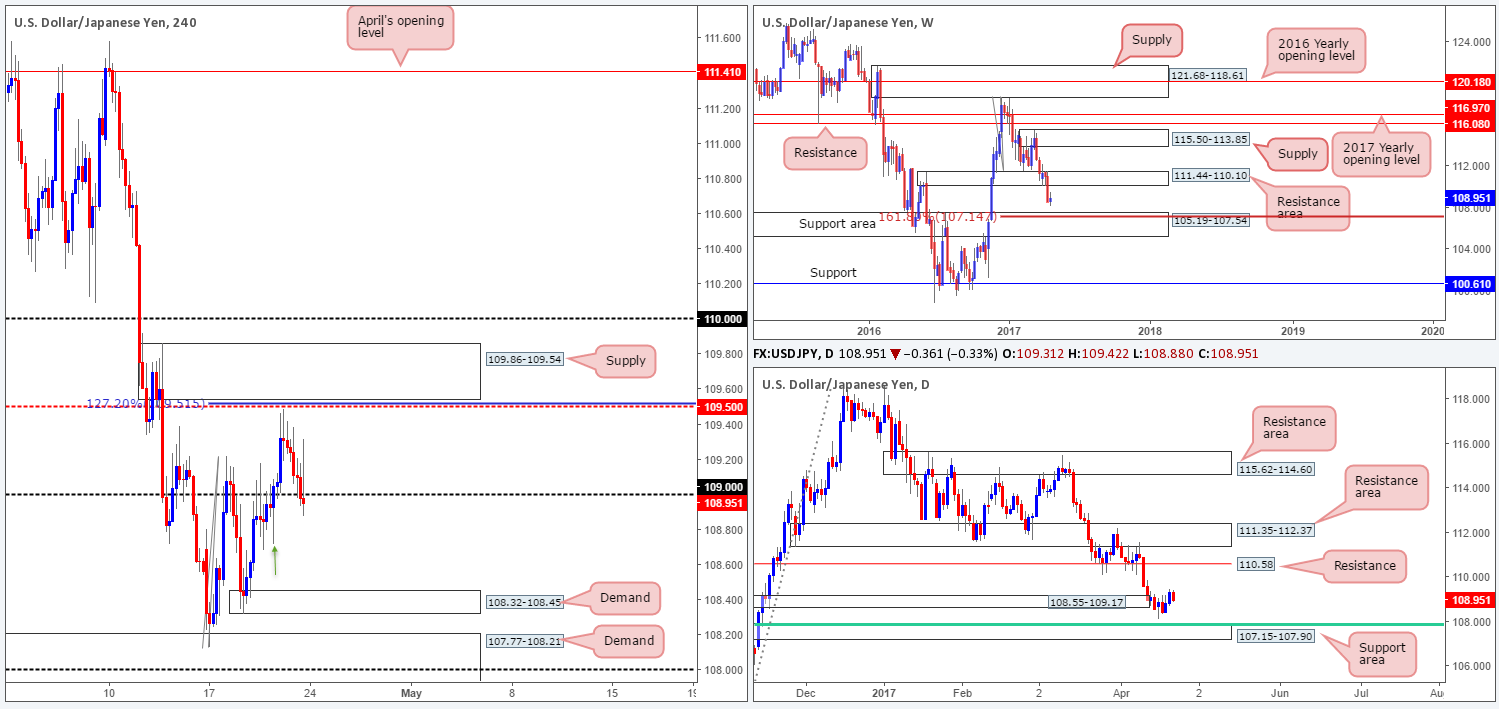
Looking at this market from the weekly scale, the pair clearly remains in bearish territory. Following the break of the support area at 111.44-110.10 two weeks back, the runway south still appears clear for the unit to test the support area coming in at 105.19-107.54 (holds an AB=CD 161.8% ext. at 107.14 taken from the high 118.66).
The story on the daily chart shows the demand at 108.55-109.17 to be pretty much dead and buried. We feel bids are incredibly fragile and will eventually lead to a test of the nearby support area at 107.15-107.90, which happens to also hold a 61.8% Fib support at 107.84 taken from the low 101.19.
Having put in a top just ahead of the mid-level resistance 109.50 on Thursday, the H4 candles continued to recede on Friday, eventually popping below the 109 handle into the close. There’s H4 demand seen to the left of current price, but it does not really emphasize strength, mainly because of the huge tail seen marked with a green arrow on the 20th April at 108.72.
Our suggestions: Trading short beyond 109 seems to be a valid call. However, we would ideally like to see the H4 candles retest 109 as resistance beforehand and follow up with a H4 bear candle (preferably a full-bodied close). If this should come to fruition, the first take-profit target can be seen around the H4 demand at 108.32-108.45, followed closely by another H4 demand at 107.77-108.21 which sits on top of the aforementioned daily support area.
Data points to consider: FOMC member Kashkari speaks at 4.30 and again at 8.30pm GMT+1.
Levels to watch/live orders:
- Buys: Flat (stop loss: N/A).
- Sells: 109 region ([waiting for a reasonably sized H4 bear candle to form before pulling the trigger is advised] stop loss: ideally beyond the candle’s wick).
USD/CAD:
Weekly gain/loss: + 170 pips
Weekly closing price: 1.3494
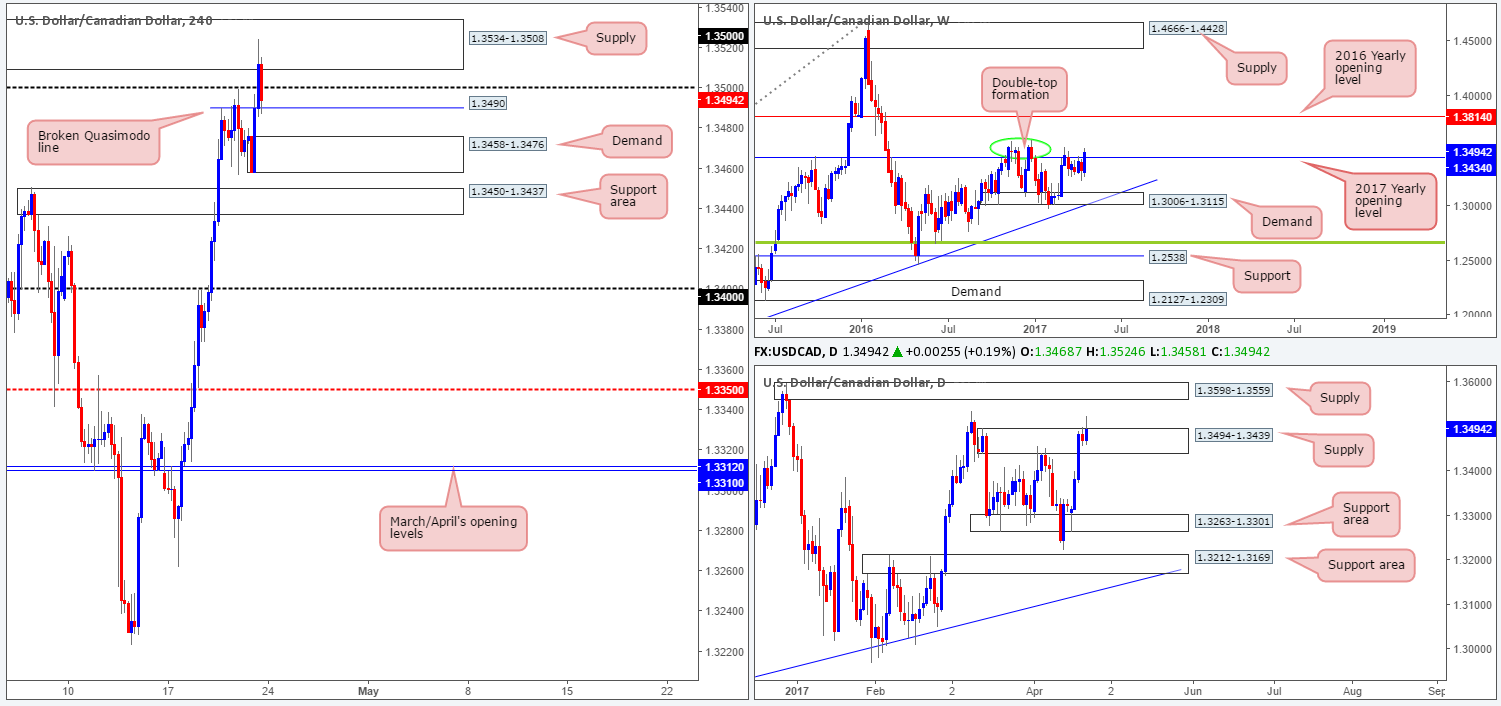
Weekly price has spent the best part of a month and a half teasing the underside of the 2017 yearly opening level at 1.3434. That was, of course, until the bulls came to life last week and closed above the monthly level. Despite the almost near-full-bodied candle, reinforcing this line is a well-defined double-top formation seen around the 1.3588 neighborhood (green circle). Therefore, the bears could still have a hand in this game yet!
Turning over a page to the daily timeframe, supply at 1.3494-1.3439 is seen hanging in there despite Friday’s spike seen through the top edge of this zone. Even if this supply does give way, there’s always a back-up supply seen just above it at 1.3598-1.3559.
The US dollar, as seen clearly on the H4 chart, made considerable ground against its Canadian counterpart on Friday following lower-than-expected inflation data. Price, however, failed to sustain gains beyond the 1.35 handle (likely due to the supply zone seen at 1.3534-1.3508) and ended the week tapping a broken Quasimodo line at 1.3490.
Our suggestions: H4 action is exceedingly restricted at the moment. Below 1.3490, there’s demand sitting at 1.3458-1.3476, shadowed closely by a support area pegged at 1.3450-1.3437. To the upside, we have the 1.35 handle and the said supply to contend with. As a result, until these structures are cleared and some space is seen, we do not see much to hang our hat on in terms of a trade setup. So, for now at least, we’ll hold fire and take a back seat.
Data points to consider: FOMC member Kashkari speaks at 4.30 and again at 8.30pm GMT+1.
Levels to watch/live orders:
- Buys: Flat (stop loss: N/A).
- Sells: Flat (stop loss: N/A).
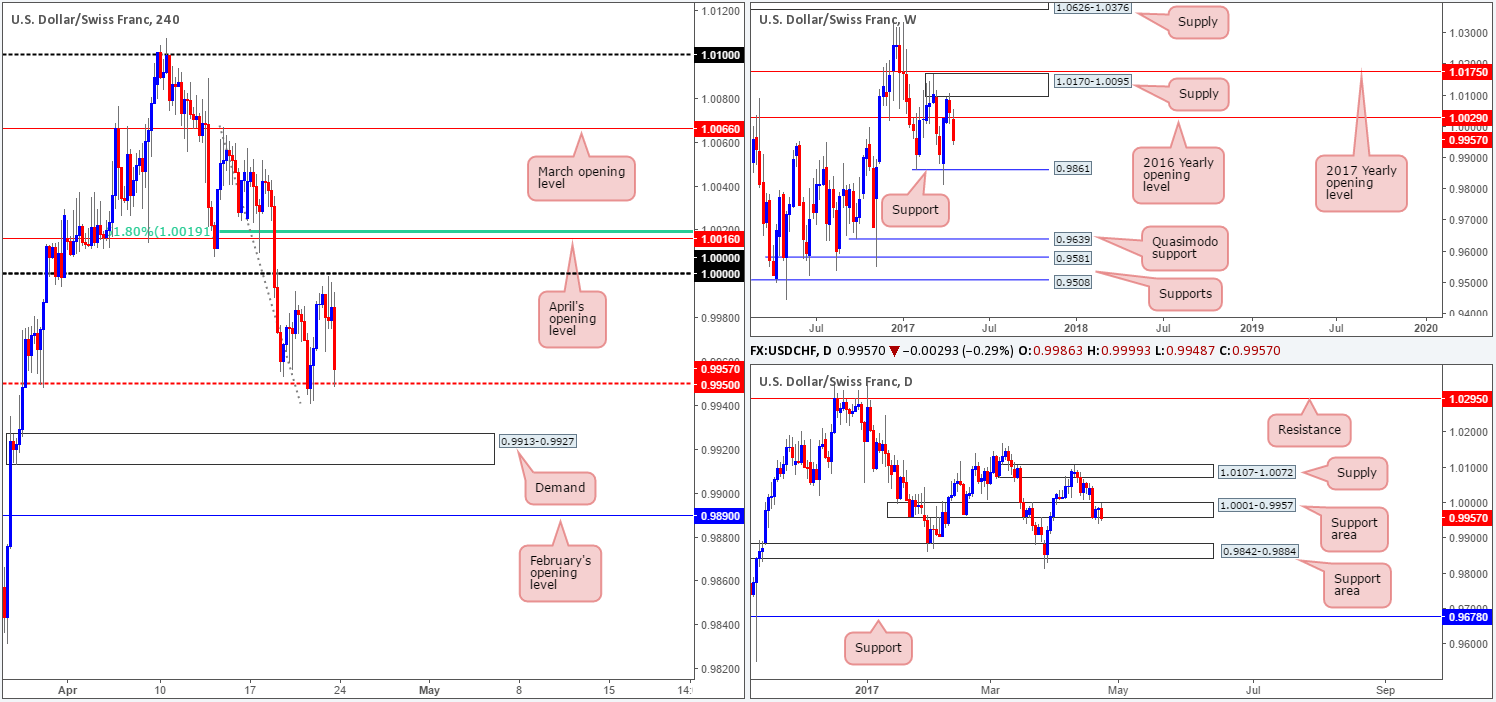
USD/CHF:
Weekly gain/loss: – 89 pips
Weekly closing price: 0.9957
The USD/CHF clocked lower prices last week following an earlier test of weekly supply seen at 1.0170-1.0095. Consequent to this, the 2016 yearly opening level at 1.0029 was cleared, leaving downside relatively open until we reach weekly support at 0.9861.
The daily support area at 1.0001-0.9957 held ground on both Wednesday and Thursday last week, but, as you can see, failed miserably on Friday. The minor close seen beyond this area, coupled with weekly flow pointing to further selling, could be enough to convince investors that bids are weakening. The next area beyond this zone falls in at 0.9842-0.9884: another support area that houses the said weekly support level within.
Looking over at Friday’s action on the H4 chart, the Swissy came within touching distance of connecting with parity (1.0000) during the London morning session. Bids eventually weakened here and saw price topple down to the mid-level support at 0.9950 into the closing bell. Although the higher timeframes indicate that the bears may be in the driving seat at the moment, selling into 0.9950 would not be something we’d advise. Under usual circumstances, we’d wait for this level to be taken out and attempt to trade the retest, but given nearby demand at 0.9913-0.9927, it’s challenging.
Our suggestions: Unless one is willing to enter long from 0.9950 against possible weekly/daily sellers, we do not see much on offer. For us personally, we’ll remain flat and reassess going into tomorrow’s open.
Data points to consider: FOMC member Kashkari speaks at 4.30 and again at 8.30pm GMT+1.
Levels to watch/live orders:
- Buys: Flat (stop loss: N/A).
- Sells: Flat (stop loss: N/A).
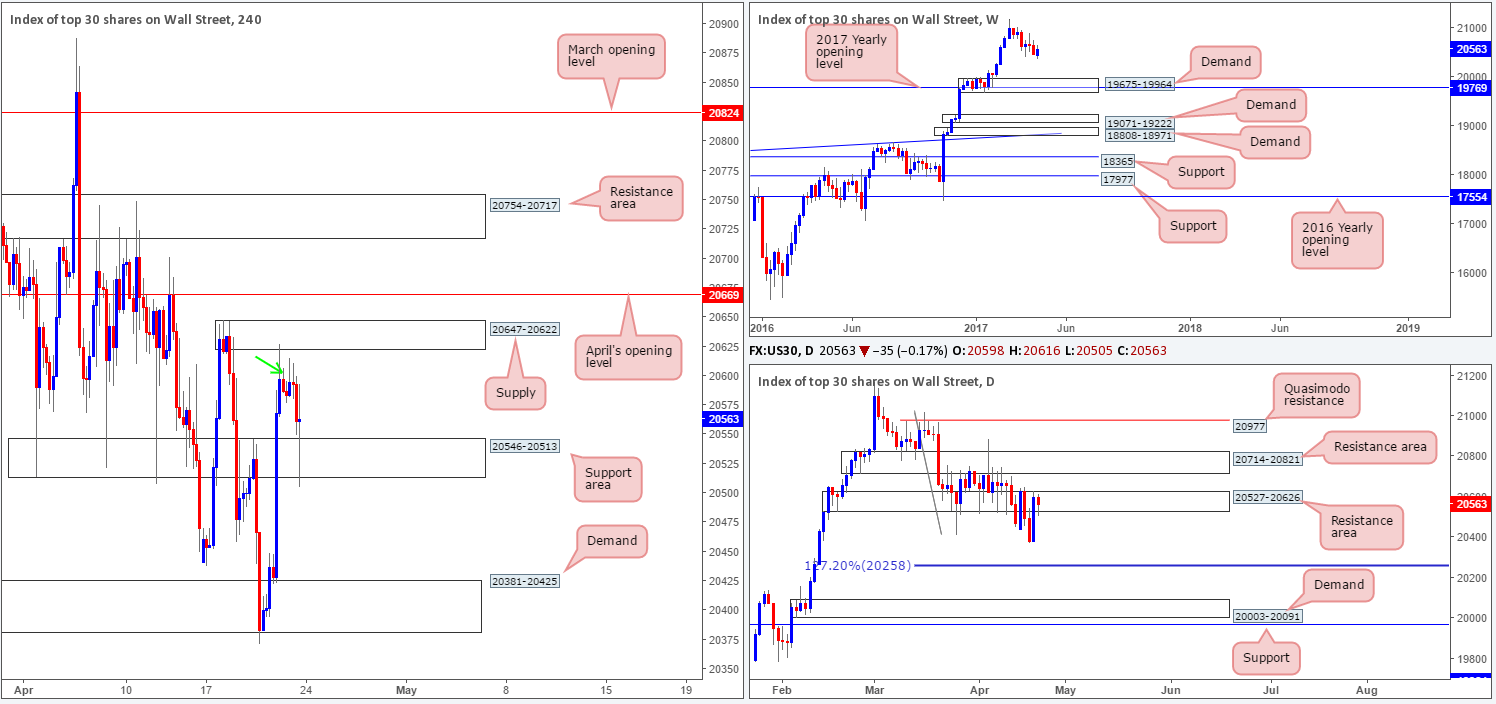
DOW 30:
Weekly gain/loss: + 93 points
Weekly closing price: 20563
(Trade update: Short taken from 20586 ended up as a breakeven trade).
As far as we can see, weekly action, despite gaining last week, still looks poised to extend the pullback seen from record highs of 21170 down to 19675-19964: a demand area that’s bolstered by the 2017 yearly opening level at 19769.
Daily movement is currently seen retesting the resistance area at 20527-20626. Should the bears manage to defend this zone, the next downside target from this angle sits at 20258: an AB=CD 127.2 Fib ext. taken from the high 21022.
H4 supply, as expected, continued to hold ground on Friday, consequently forcing price to test the lower edge of a support area seen at 20546-20513. In order for our desk to become sellers here, we’d really like to see the current support area taken out. From that point, one can either choose to enter on the break, or conservatively wait for price to retest the broken barrier as resistance. We choose the latter.
Our suggestions: As highlighted above, we’re looking for a H4 close to be seen below the current H4 support area. This, followed up with a retest and a H4 bear candle (preferably a full-bodied close), would, in our opinion, be enough to justify a short in this market, targeting the H4 demand picked at 20381-20425 as an initial take-profit target.
Data points to consider: FOMC member Kashkari speaks at 4.30 and again at 8.30pm GMT+1.
Levels to watch/live orders:
- Buys: Flat (stop loss: N/A).
- Sells: Watch for H4 price to engulf the H4 support area at 20546-20513 and then look to trade any retest seen thereafter. Following the retest, a H4 bearish candle would be ideal. Stop loss: beyond the candle’s wick).
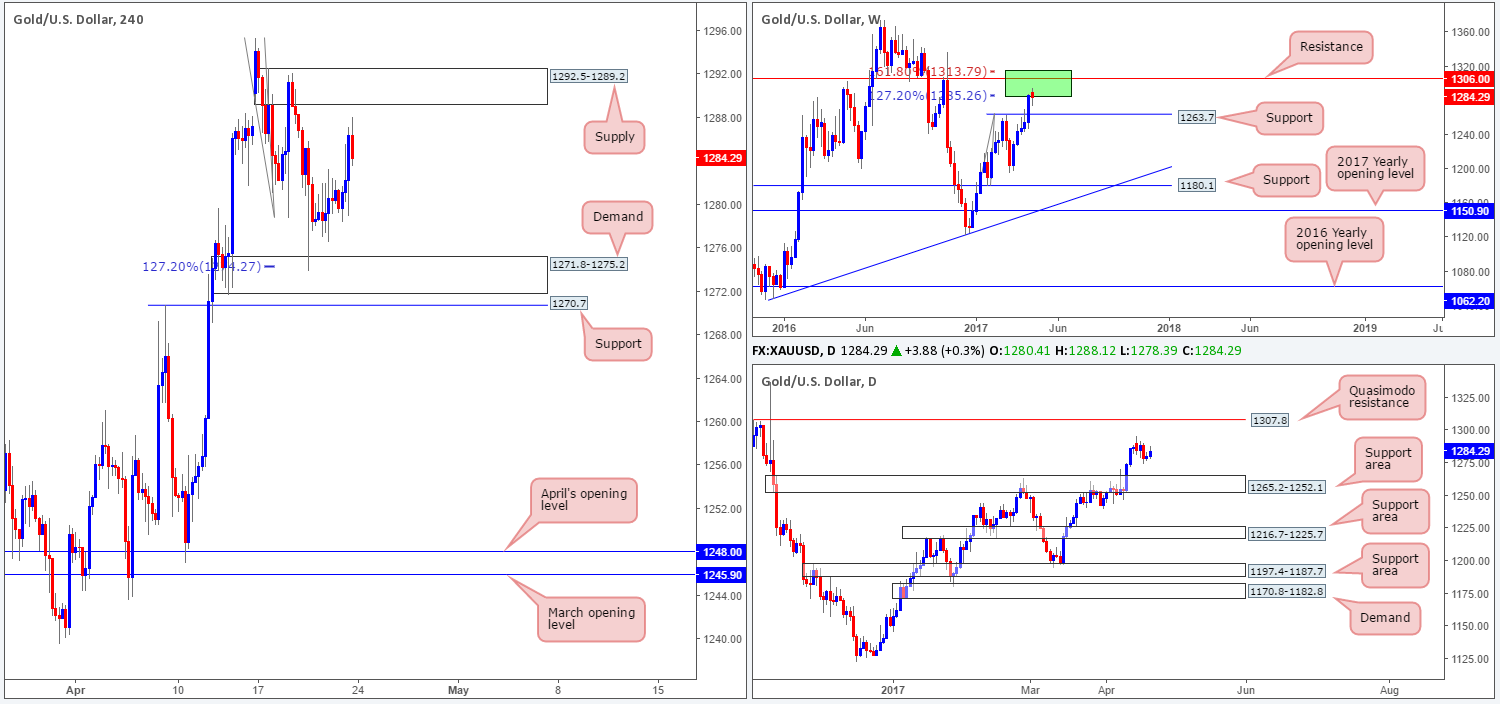
GOLD:
Weekly gain/loss: – $3
Weekly closing price: 1284.2
Breaking a five-week bullish phase, the weekly bears elbowed their way into the market last week from within the walls of two Fibonacci extensions 161.8/127.2% at 1313.7/1285.2 taken from the low 1188.1 (green zone). Although there is a possibility that price may pop north to test nearby resistance at 1306.0, we feel the support at 1263.7 is likely to be challenged sometime soon.
Filtering down to the daily chart, the candles are seen loitering mid-range between a Quasimodo resistance at 1307.8 and a support area penciled in at 1265.2-1252.1. Of particular interest here is the weekly support mentioned above is located within the upper limits of this daily zone, and the daily Quasimodo resistance is sited directly above the said weekly resistance.
Wednesday’s bounce seen from the H4 demand base at 1271.8-1275.2, more specifically the H4 AB=CD 127.2% ext. at 1274.2, saw the yellow metal gravitate to a high of 1288.1 by the week’s end. With the US dollar now seen testing a minor H4 demand (99.65-99.83 – see the US dollar index), coupled with the position of price on the weekly chart (see above), this could point to a selloff in the gold market.
Our suggestions: Should our analysis be correct and gold does indeed turn bearish, we would not be willing to sell until price shakes hands with the H4 supply seen at 1292.5-1289.2. Still, since there’s a chance that bullion could stretch north to test weekly resistance/daily Quasimodo resistance, we’d strongly recommend waiting for a H4 bear candle to form (preferably with a full-bodied close) and enter based on this momentum with stops positioned above the wick.
Levels to watch/live orders:
- Buys: Flat (stop loss: N/A).
- Sells: 1292.5-1289.2 ([waiting for a reasonably sized H4 bear candle to form before pulling the trigger is advised] stop loss: ideally beyond the candle’s wick).