
Key risk events today:
Limited.
(Previous analysis as well as outside sources – italics).
EUR/USD:
Weekly gain/loss: -3.66%
Weekly close: 1.0697
Weekly perspective:
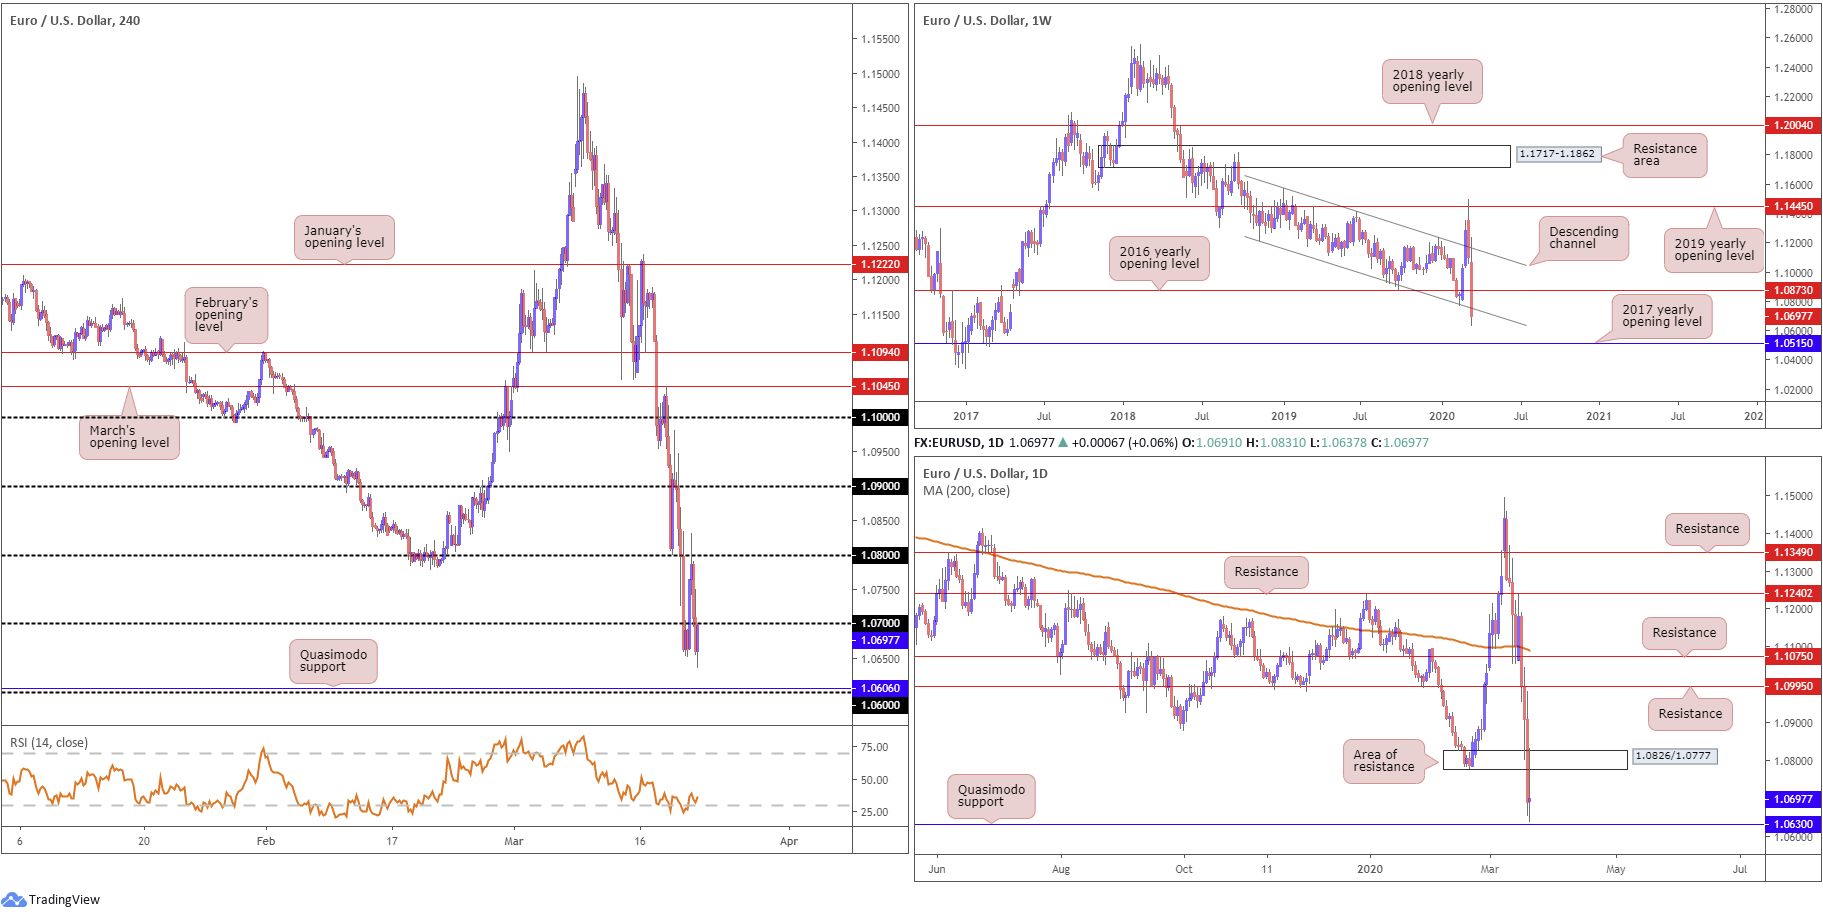
Downside risks continue to build long term in EUR/USD, absorbing bids from the 2016 yearly opening level at 1.0873 and channel support, taken from the low 1.1215.
Down more than 400 points last week, the euro was left reeling as the US dollar index clocked highs around the 103.00 handle, levels not seen since early 2017.
Further downside this week has the 2017 yearly opening level in view at 1.0515. Though before the unit reaches this far south, a retest at the underside of the broken channel support may materialise.
Daily perspective:
A closer reading of price movement on the daily timeframe shows EUR/USD closing in on Quasimodo support at 1.0630, after fading session highs around 1.0831 on Friday.
The key observation here is a break of the aforementioned Quasimodo formation may prep the ground for an approach towards the 2017 yearly opening level mentioned above on the weekly timeframe at 1.0515.
H4 perspective:
The greenback secured healthy gains into the weekly close, despite dipping from best levels a few points short of the 103.00 handle, with perceived safe-haven assets trailing amidst a scramble for USD liquidity. The Federal Reserve Board on Friday also expanded its program of support for the flow of credit to the economy by taking steps to enhance the liquidity and functioning of crucial state and municipal money markets[1].
Technically, Europe’s single currency clawed back a portion of recent losses vs. the buck early hours Friday, though failed to sustain gains north of 1.08. Renewed dollar demand observed sellers strengthen their grip, eventually overthrowing 1.07 to the downside and scoring near-three-year lows ahead of Quasimodo support at 1.0606 and the 1.06 handle. Meanwhile, technical indicators such as the relative strength index (RSI) is seen producing mild bullish divergence out of oversold territory.
Areas of consideration:
A close south of daily Quasimodo support at 1.0630 this week is tipped to provide an unfavourable wind for EUR/USD towards weekly support at 1.0515, the 2017 yearly opening level.
Before reaching 1.0630, however, a retest at the underside of 1.07 is at hand for potential moves lower today/early week. Conservative traders will want to view at least additional bearish candlestick confirmation off 1.07 before pulling the trigger, particularly with volatility being as high as it is.
GBP/USD:
Weekly gain/loss: -5.04%
Weekly close: 1.1658
Weekly perspective:
GBP markets were pummelled over the course of last week, erasing more than 600 points against a resurgent dollar, a week after a near-6% decline.
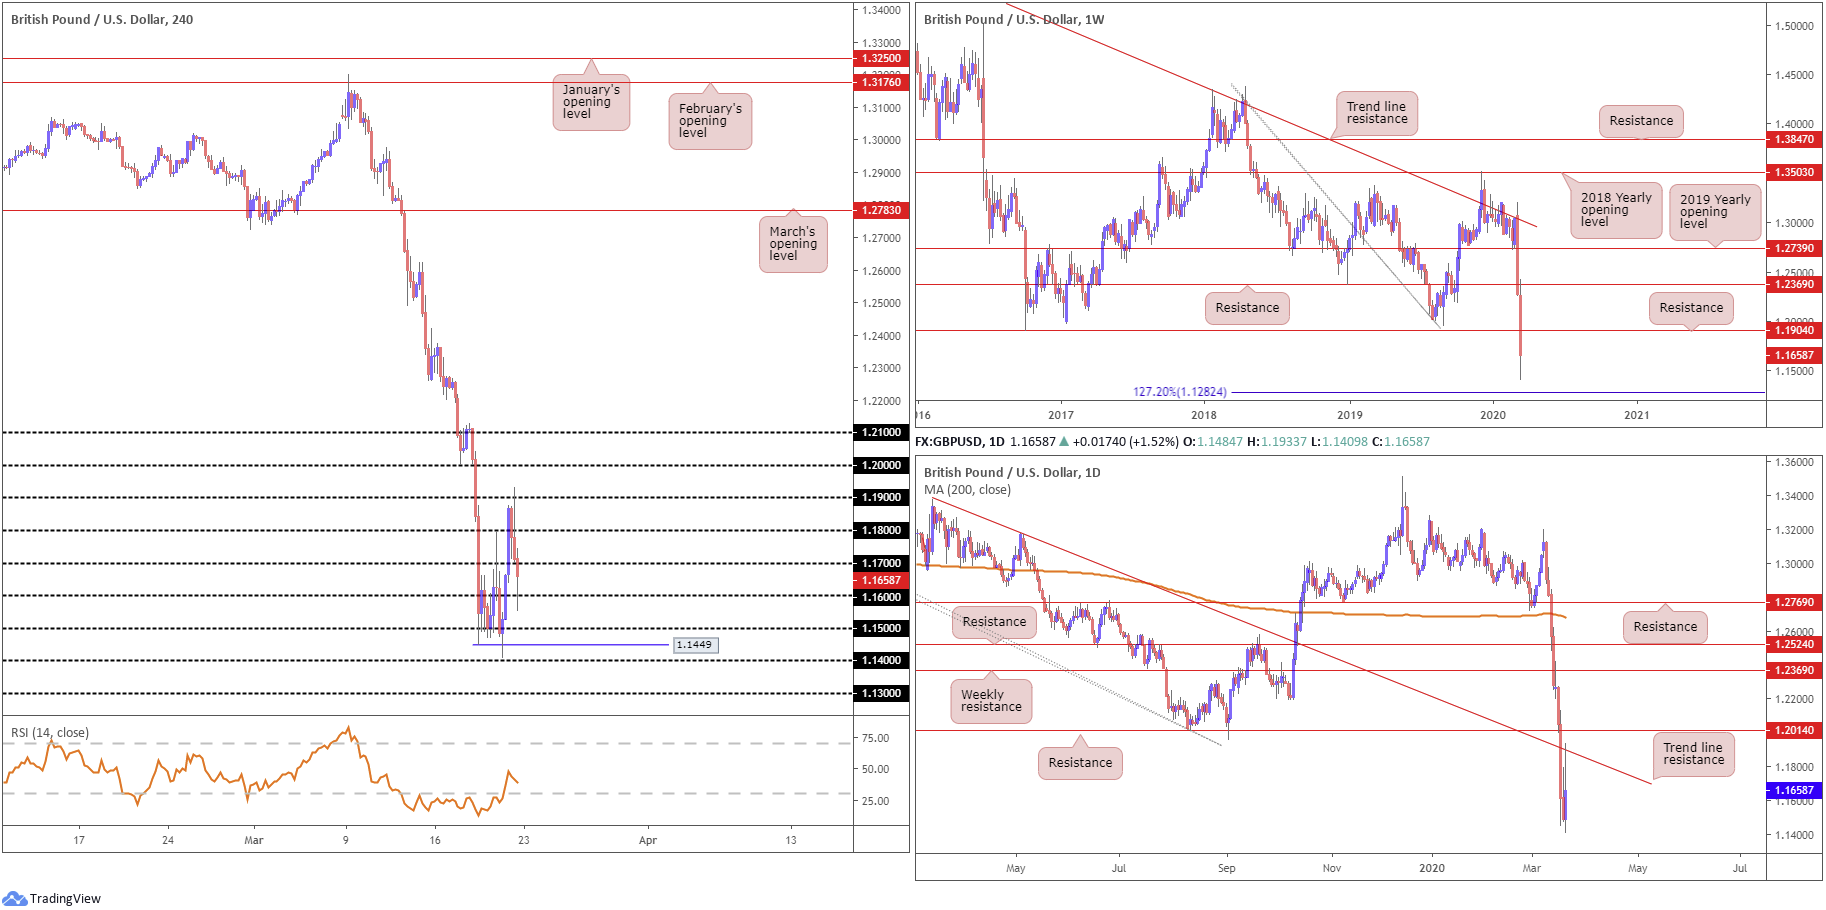
Registering lows not seen since the 1980s, long-term flow eyes the 127.2% Fibonacci extension at 1.1282 as a possible target this week. Before reaching this far south, nonetheless, traders may want to pencil in the possibility of a retest at 1.1904.
Daily perspective:
The daily timeframe houses similar support at 1.1282, the weekly 127.2% Fibonacci extension. Daily structure reveals resistance emerging off a trend line formation, taken from the high 1.3380. It should also be noted the 200-day SMA value at 1.2679 is turning lower after remaining flat since November 2019.
H4 perspective:
Little curbed the dollar’s enthusiasm over the week, despite dipping from best levels beneath 103.00 to lows at 101.09. The pound rebounded from worst levels, a touch above 1.14, and extended gains going into Europe Friday, testing waters above 1.19 before recoiling lower and closing sub 1.17. The H4 timeframe is, technically speaking, governed by psychological levels right now, aside from a newly formed Quasimodo support at 1.1449.
In recent news, the Bank of England (BoE) slashed interest rates from 0.25% to 0.1%, and unveiled an extra £200 bn to its quantitative easing (QE) program. Friday, however, had Chancellor Sunak announce a combination of measures on jobs and incomes. In the UK the government has pledged to pay 80% of wages for those who have lost their jobs to the pandemic.
Areas of consideration:
Until 1.13, or the weekly 127.2% Fibonacci extension at 1.1282, this remains a sellers’ market, according to chart studies.
H4 closing under 1.17 could spark further selling in this market, targeting moves beyond 1.16, 1.15, the H4 Quasimodo support at 1.1449 and 1.14 to 1.13. Conservative traders may opt to wait and see if a retest at 1.17 materialises before pulling the trigger; others may be satisfied with short entries on the H4 breakout candle south of 1.17.
AUD/USD:
Weekly gain/loss: -6.10%
Weekly close: 0.5806
Weekly perspective:
Persistent coronavirus headlines, coupled with muscular demand for the dollar, sparked a 370+ point down move in AUD/USD last week, a week after a near-7% decline.
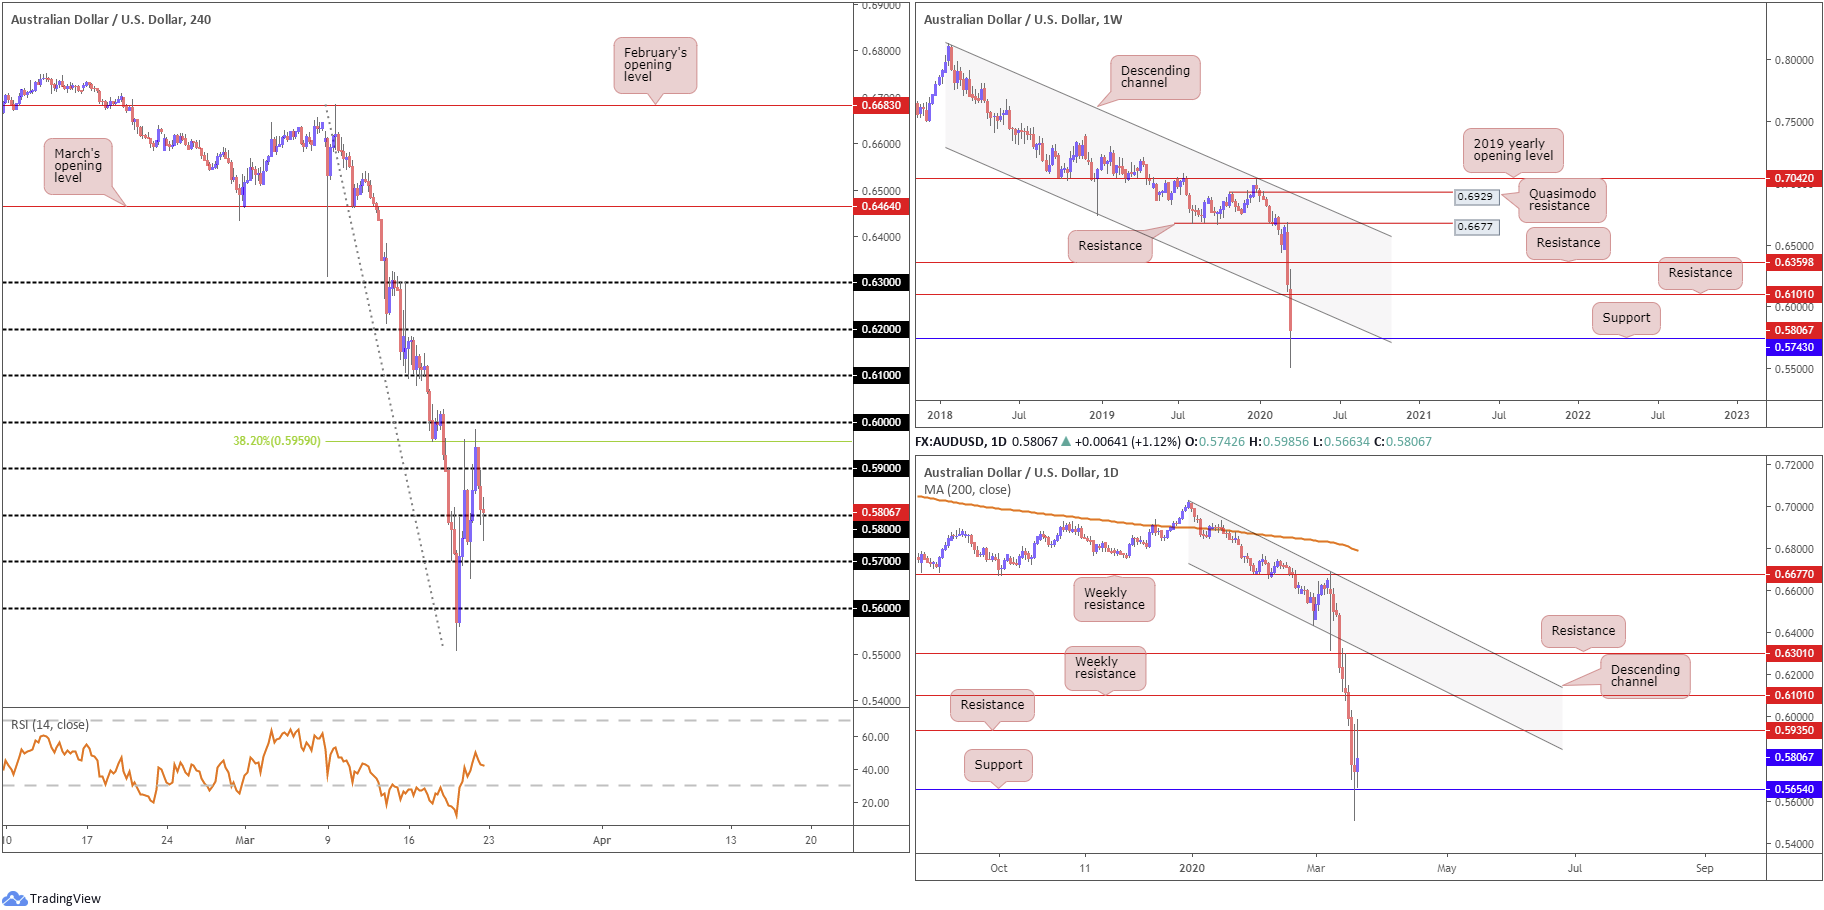
Modestly recovering from worst levels, a touch above 0.55, price managed to elbow its way marginally north of support at 0.5743 into the closing bell. To the upside, focus shifts to channel support-turned resistance, taken from the low 0.6744, and resistance plotted at 0.6101.
Daily perspective:
Meanwhile, on the daily timeframe, price action shook hands with support coming in at 0.5654, with resistance standing at 0.5935. Candlestick traders will note Thursday’s activity chalked up a long-legged doji formation and Friday printed a half-hearted shooting star pattern.
H4 perspective:
Thursday had AUD/USD embrace fresh seventeen-year lows at 1.5506, before staging a near-400-point recovery to highs at 0.5963, testing a 38.2% Fibonacci retracement at 0.5959. Friday retested the aforementioned Fibonacci base, though faded recovery peaks a few points ahead of the widely watched 0.60 figure before retaking 0.59 and testing 0.58 by the close.
The week had the Reserve Bank of Australia (RBA) cut rates by 25 bps to 0.25%, though on a positive note, Aussie unemployment fell to 5.1%. The real game-changer appeared to be the Fed extending and expanding swap lines to the likes of the RBA and RBNZ.
Areas of consideration:
While technical levels are still being respected, volatility in the FX space is immense and may continue for the foreseeable future.
Despite the relative strength index (RSI) recovering from oversold territory on the H4, the value failed to sustain gains above 50.00.
Failure to hold off 0.58 on the H4 could lead to moves towards weekly support at 0.5743, with a break eyeing 0.57, while beneath we’re exposed to daily support at 0.5654. Short sales between these levels are an option, in line with the primary trend; this may, however, involve drilling down to the lower timeframes and trading local structure in order to generate satisfactory risk/reward.
USD/JPY:
Weekly gain/loss: +2.59%
Weekly close: 110.75
Weekly perspective:
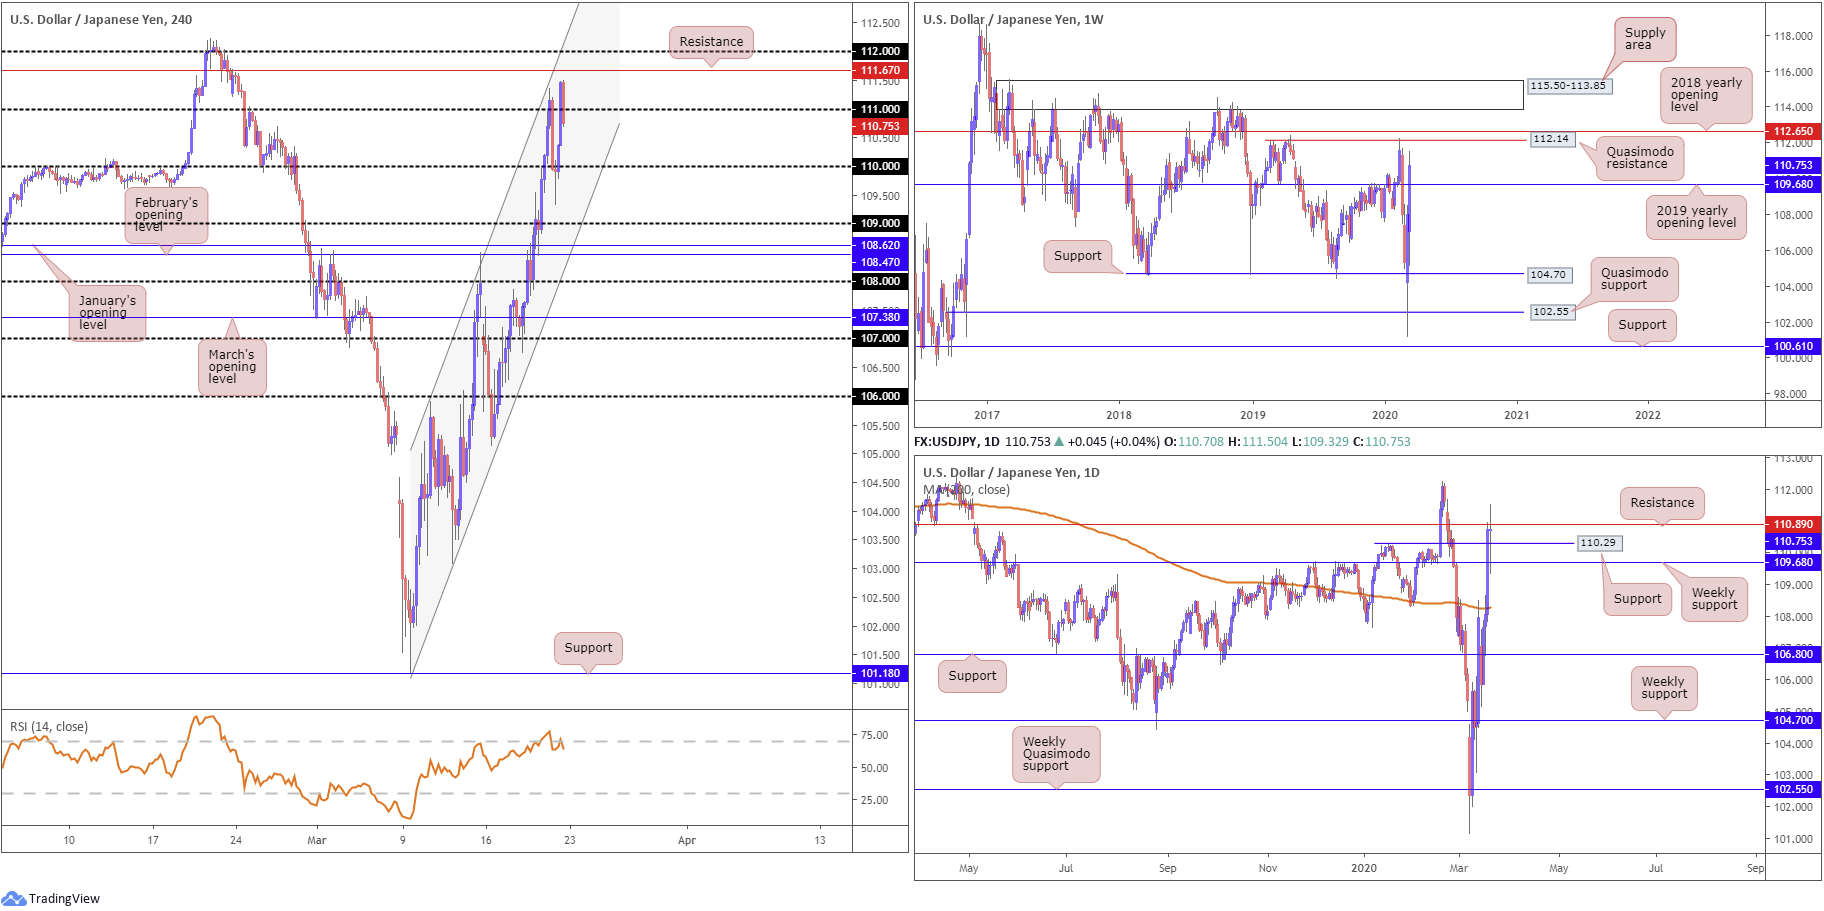
Driven by broad-based USD bidding, USD/JPY held the bulk of its gains last week, adding more than 275 points and extending the prior week’s 260+ point run, shaped by way of a strong v-shaped recovery off multi-year lows at 101.18.
Technical movement crossed the 2019 yearly opening level at 109.68, potentially unshackling upside to Quasimodo resistance at 112.14, closely shaded by the 2018 yearly opening level at 112.65 and a long-term supply zone formed at 115.50-113.85. Before shaking hands with levels north of 112, traders must take into account the pair could retest 109.68 before transitioning to higher ground.
Daily perspective:
Technical development on the daily timeframe reveals Friday’s activity established a long-legged doji candlestick formation formed between 111.50/109.32, a 218-point range.
Support resides close by at 110.29, a Quasimodo resistance-turned support, with weekly support surfacing at 109.68. Resistance forms at 110.89, with a close beyond this base potentially setting the stage for moves to the weekly Quasimodo resistance priced in at 112.14.
H4 perspective:
Despite having dipped a toe south of 110 Friday, early London reclaimed the round number and retested the base as support. Buyers strengthened their grip heading into US trade, reclaiming 111+ status and reaching highs of 111.50, before retreating and regrouping a handful of points beneath 111 into the close.
Structurally, sellers may retain a bearish tone below 111 early week, possibly laying the foundation for moves to 110 and channel support, taken from the low 101.18.
A rotation back above 111 has resistance at 111.67 in sight, as well as channel resistance, extended from the high 105.91.
With respect to the relative strength index (RSI), we’re trading from overbought territory right now and producing mild bearish divergence.
Areas of consideration:
Although a retest at 109.68 is potentially in the offing this week, upside is favoured on the weekly timeframe, targeting at least 112.14, which will likely be achieved if we overcome daily resistance at 110.89. In fact, a daily close above 110.89 will likely be viewed as a bullish cue.
Above 110.89, H4 resistance at 111.67 is the next port of call and could be potentially troublesome for long positions, though a break of here will highly likely make a play for the 112 handle and then 112.14 on the weekly scale.
USD/CAD:
Weekly gain/loss: +3.84%
Weekly close: 1.4336
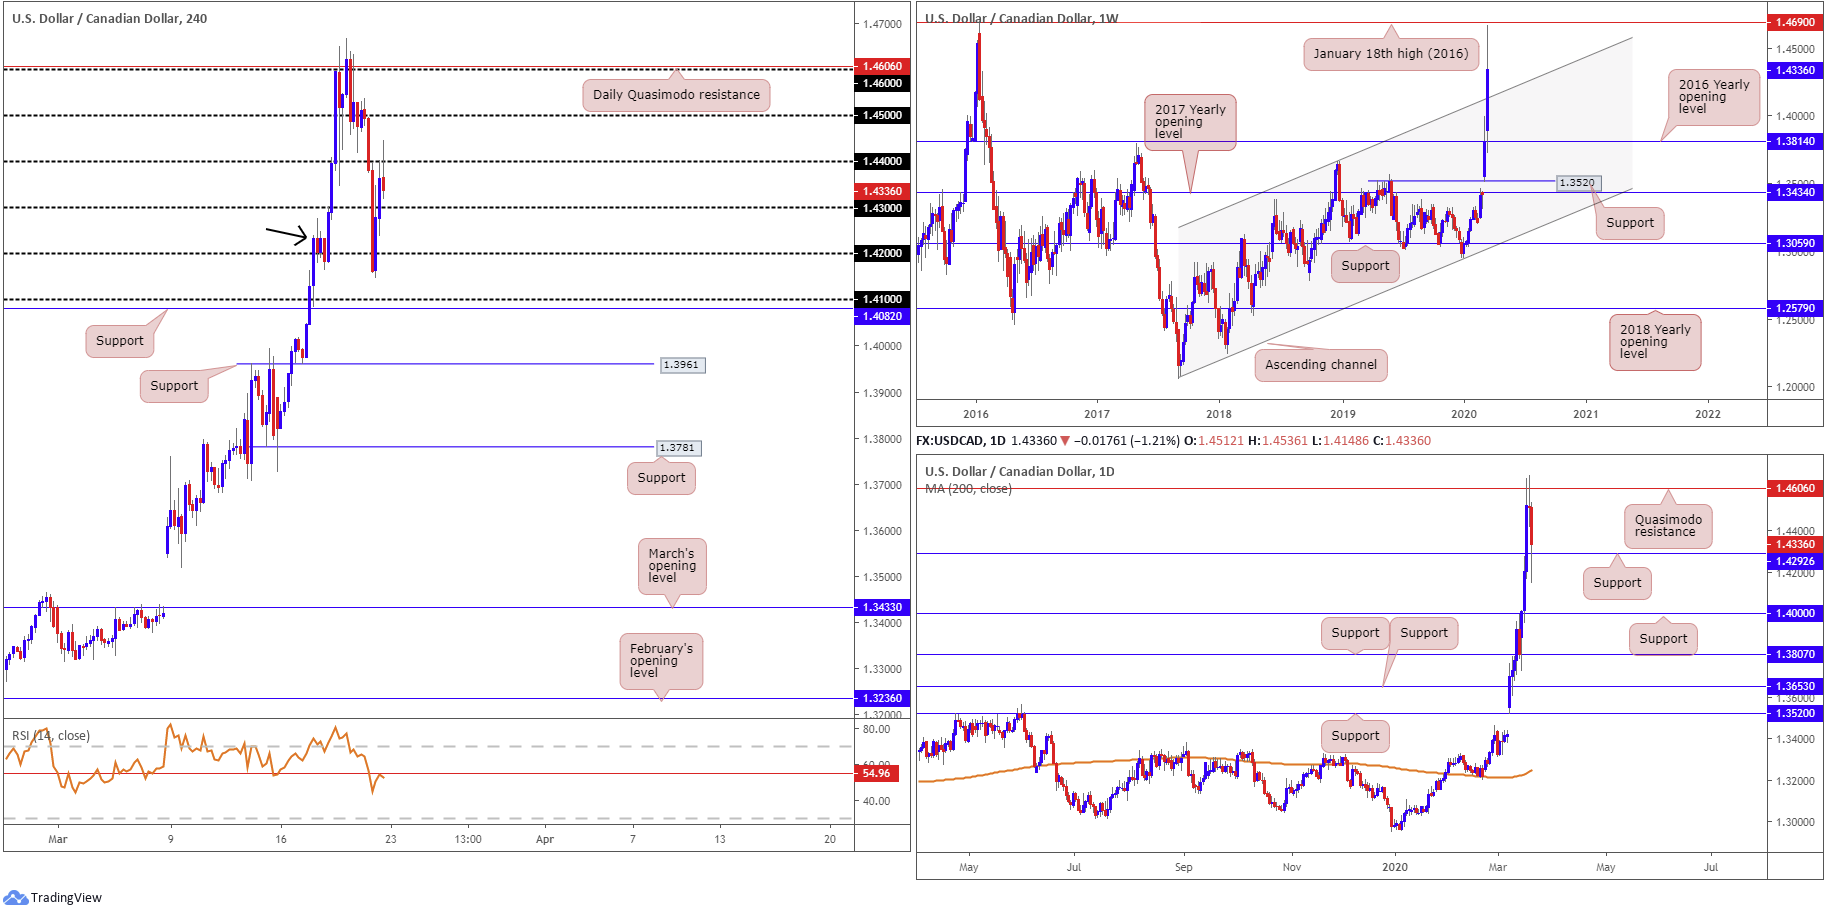
Weekly perspective:
Vigorous USD buying amidst a scramble for liquidity and WTI prices falling nearly 30% on the week had USD/CAD finish 530 points in the green.
The pair reached highs of 1.4667, a touch short of the January 18th high at 1.4690 (2016), before pulling back to 1.4336. This came after retesting the 2016 yearly opening level at 1.3814, and breaching long-term channel resistance, etched from the high 1.3661.
Daily perspective:
Quasimodo resistance at 1.4606 elbowed its way into the spotlight Thursday by way of a doji candlestick formation, followed by a run lower Friday that whipsawed through support priced in at 1.4292.
In the event of a break lower this week, support resides at 1.4000, whereas a move through 1.4606 has 1.4810 in the firing range, a Quasimodo resistance level.
Traders may also want to note the 200-day SMA (orange – 1.3245) is seen turning higher after grinding lower since August 2019.
H4 perspective:
Dovetailing closely with daily Quasimodo resistance at 1.4606, the 1.46 handle on H4, confirmed by RSI bearish divergence, sent short-term action 400 points to the downside.
Friday witnessed a mild breach of 1.42, sufficient to trip sell stops beneath the round number and the demand base to the left (black arrow), followed by a 200-point recovery to peaks north of 1.44.
Confirmed by the relative strength index (RSI) crossing swords with resistance at 54.96, H4 price concluded Friday fading 1.44 in the shape of a half-hearted shooting star pattern, considered a bearish signal at peaks.
Areas of consideration:
1.41 on the H4 timeframe is a level to keep an eye on this week as possible support; not only does the base align with H4 support coming in at 1.4082 it intersects closely with weekly channel resistance-turned support from 1.3661.
Alternatively, another appealing area of support this week resides close by around 1.43. Although in direct conflict with the H4 timeframe’s shooting star bearish signal, 1.43 comes packaged with daily support at 1.4292.
Both 1.41 and 1.43 are positioned in line with the underlying primary trend, trading north since September 2017 (weekly timeframe).
USD/CHF:
Weekly gain/loss: +3.64%
Weekly close: 0.9852
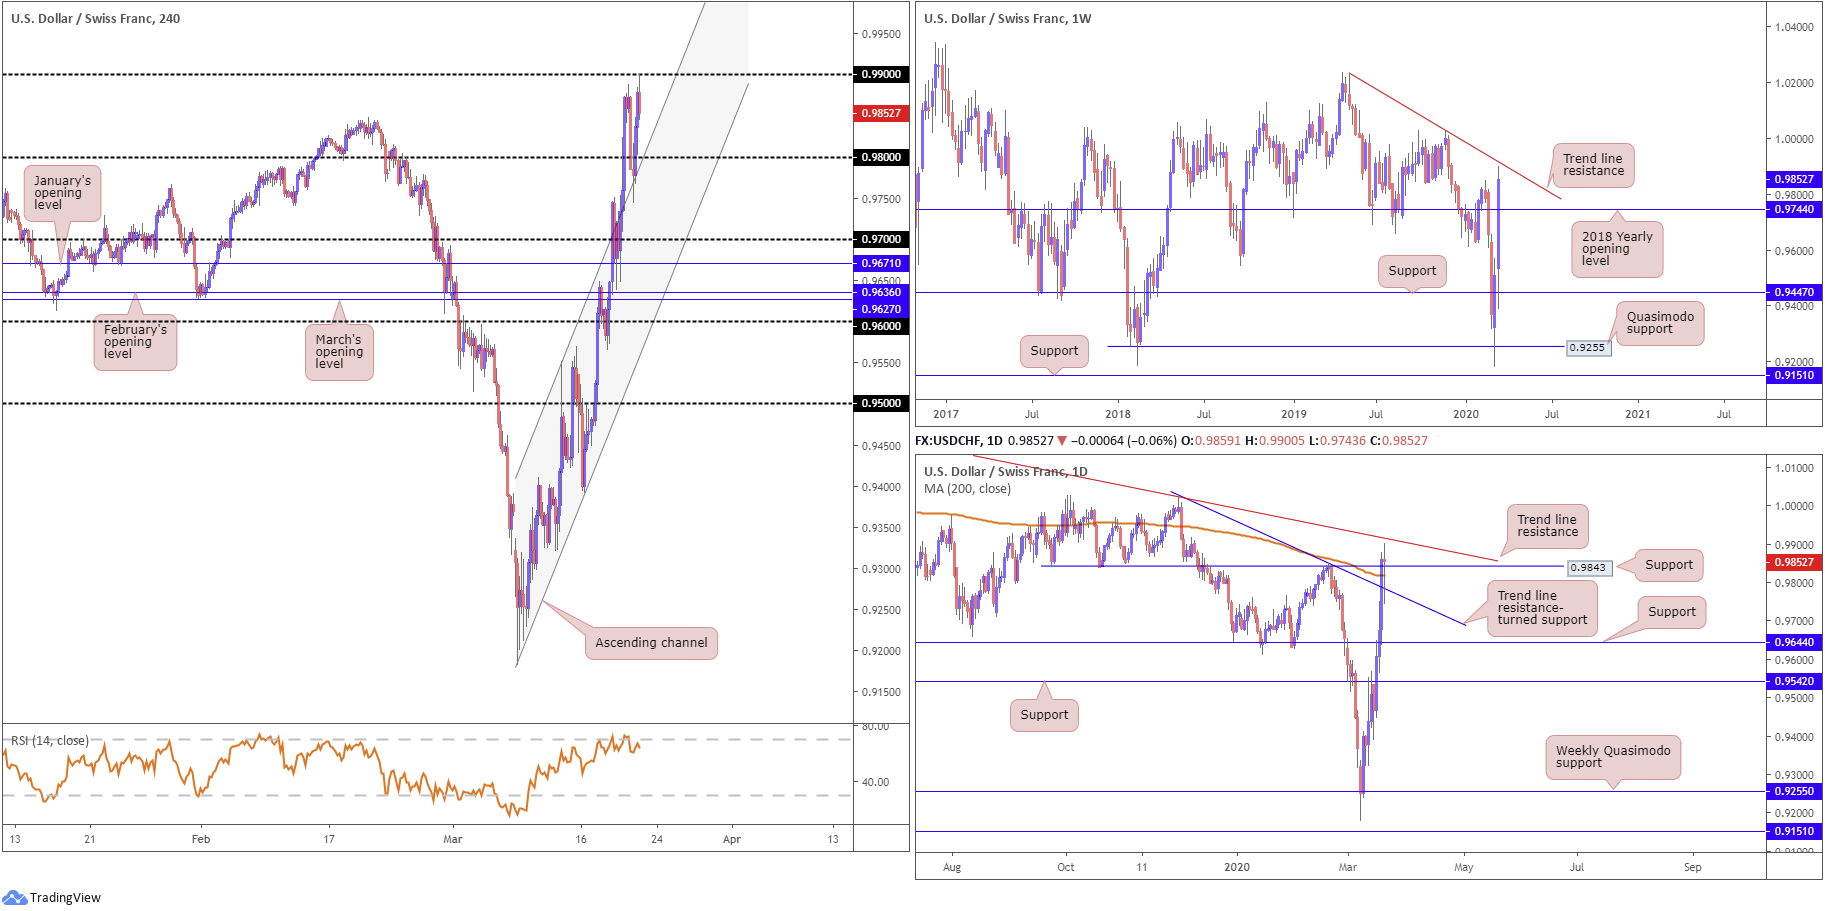
Weekly perspective:
Extending the V-shape recovery off multi-year lows at 0.9182, the pair retained its underlying bid last week and added 340 points.
Bolstered by broad USD strength, price action nestled above the 2018 yearly opening level at 0.9744, surpassing the 0.9848 February 20th high and clocking levels beneath trend line resistance, taken from the high 1.0226.
Daily perspective:
Elsewhere, daily price worked its way through trend line resistance, extended from the high 1.0023, the 200-day SMA (orange – 0.9817) and resistance at 0.9843 (now potential support). Moderate supply is visible to the left of price, though not much to get excited about. The next real challenge, in terms of resistance on this scale, can be seen around the weekly trend line resistance highlighted above.
H4 perspective:
Prior to shaking hands with the underside of 0.99, intraday flow attracted some dip-buying south of 0.98 off channel resistance-turned support from the high 0.9551, amid a strong recovery in global risk sentiment. Technicians with a focus on price-action based strategies may also want to note the 0.99 handle represents Quasimodo resistance, with the left shoulder taken from early December 2019.
Obviously moves beneath 0.99 has channel resistance-turned support in view as a viable target, while a decisive close above 0.99 has parity (1.0000) on the radar.
With respect to the relative strength index (RSI) we are seeing mild bearish divergence take hold out of overbought terrain.
Areas of consideration:
Daily support at 0.9843 is, at the time of writing, facing a retest. Upside targets from this region reside around the 0.99 handle and the current weekly trend line resistance.
Breakout buying above 0.99 will see the current weekly trend line resistance enter the mix, perhaps hampering upside and causing price to reconsider levels beneath 0.99 – a fakeout setup or bull trap. In fact, this could represent a potential bearish scenario to keep an eye on this week, should H4 price close back beneath 0.99 after testing weekly trend line resistance.
Dow Jones Industrial Average:
Weekly gain/loss: -16.65%
Weekly close: 19027
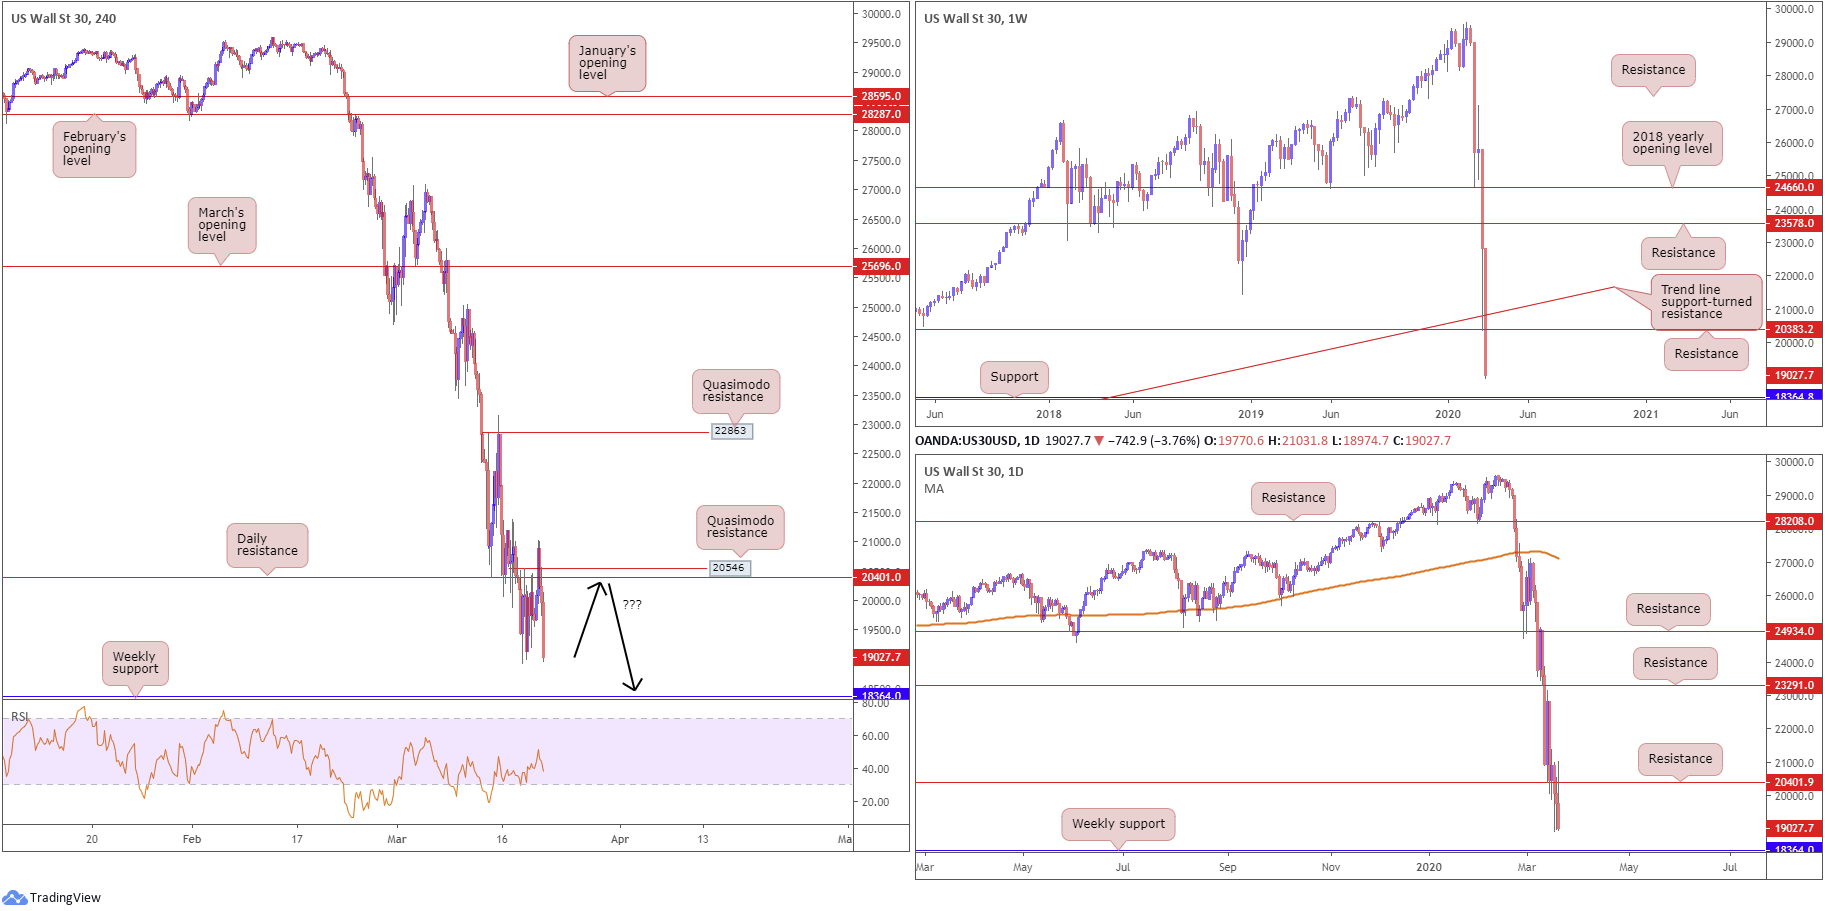
Weekly perspective:
It’s been the worst week for investors since the 2008 financial crisis.
Stocks fell nearly 17%, pictured by way of a near-full-bodied bearish candle.
Long-term trend line support, extended from the low 6466, caved in last week as did support at 20383, now both serving resistances. The next port of call on this timeframe rests at support drawn from 18364, followed by Quasimodo support at 17899.
Daily perspective:
The story on the daily timeframe has candles retesting the underside of resistance at 20401, a prior Quasimodo support level, by way of a bearish outside day formed on Friday, generally considered a signal we’re moving lower. Weekly support mentioned above at 18364 also calls for attention on this timeframe as the next downside target.
What’s also notable from a technical standing is, aside from price trading beneath the 200-day SMA (orange – 27112), the dynamic value has recently begun to drift lower after months of upside movement.
H4 perspective:
Friday had major benchmarks book losses across the board as fear over the coronavirus pandemic refused to abate. The Dow Jones Industrial Average declined 913.21 points, or 4.55%; the S&P 500 also lost 104.47 points, or 4.34%, and the tech-heavy Nasdaq 100 ended lower by 294.23 points, or 4.04%.
From a technical standpoint, like daily and weekly movement, price action has eyes on the weekly support at 18364. Daily resistance is also a reasonably dominant fixture on this timeframe at 20401, as is H4 Quasimodo resistance at 20546.
Areas of consideration:
Before reaching weekly support at 18364, intraday flow on the H4 timeframe may attempt to pare losses this week and retest the H4 Quasimodo resistance and daily resistance combination between 20546/20401 for potential shorting opportunities. In light of recent volatility, though, traders will likely be wary of executing a position lacking additional confirmation, such as a bearish candlestick signal, for example.
XAU/USD (GOLD):
Weekly gain/loss: -2.03%
Weekly close: 1498.7
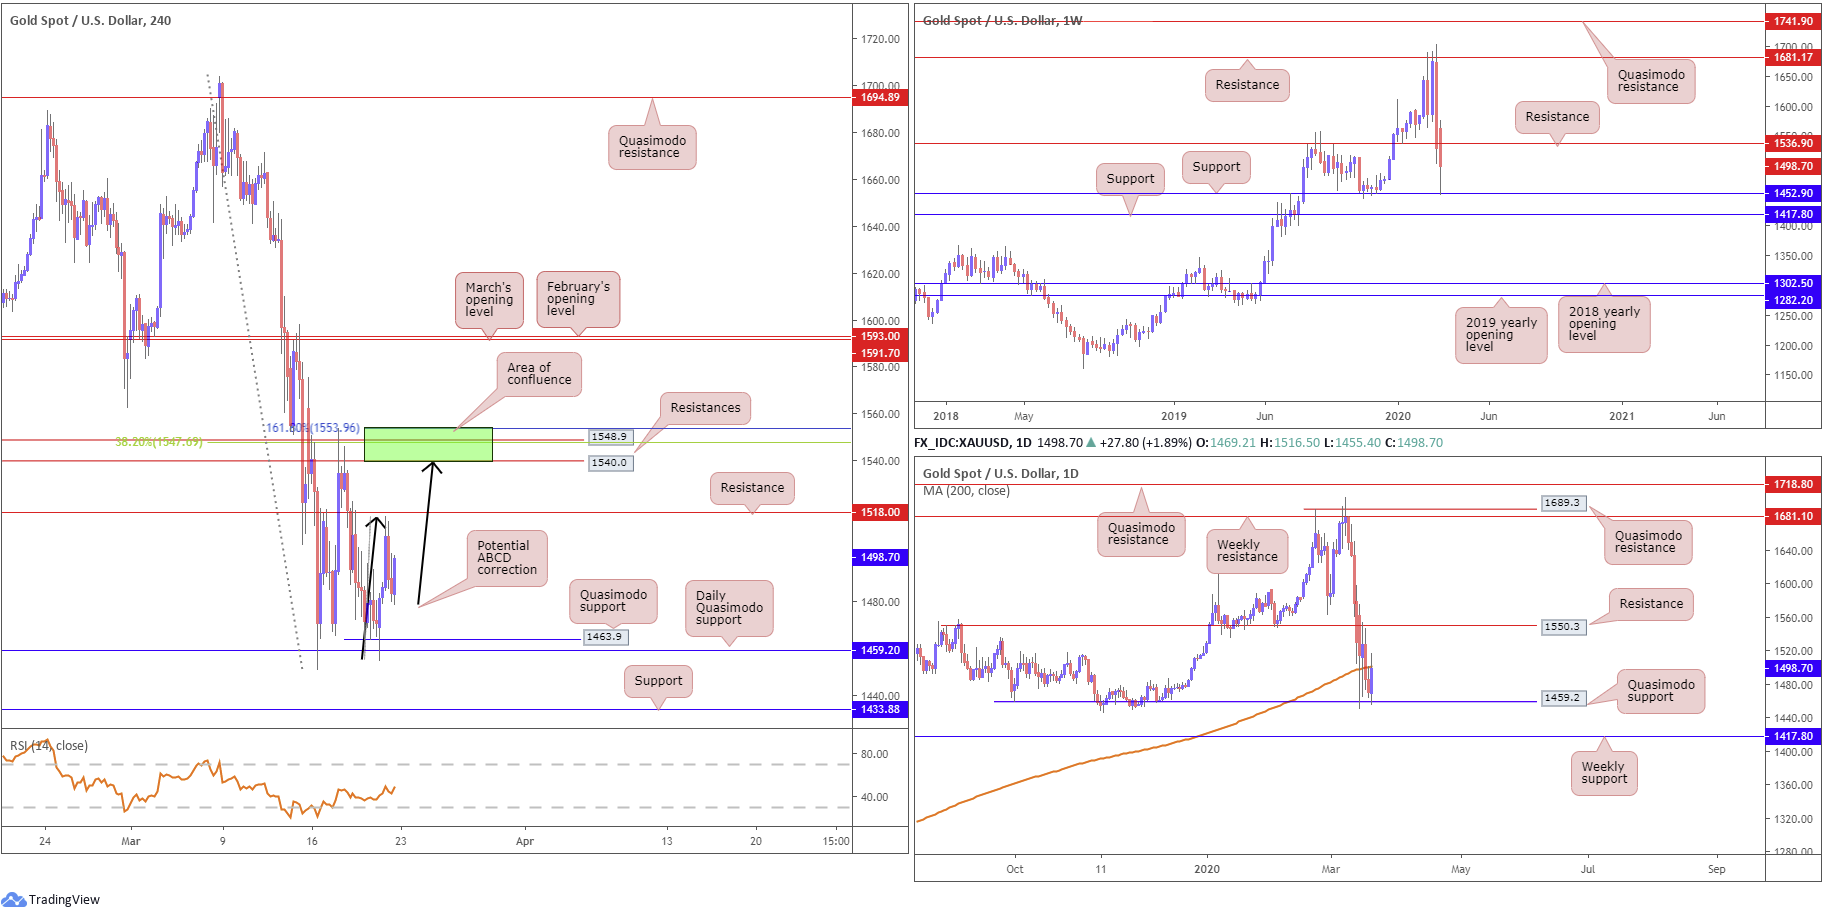
Weekly perspective:
Weekly price reveals moves beneath support at 1536.9 (now a serving resistance) took shape last week, consequently reconnecting with support priced in at 1452.9, positioned ahead of another layer of support at 1417.8.
Daily perspective:
Though leaving resistance at 1550.3 unchallenged, daily flow reclaimed the 200-day SMA (orange – 1501.4) to the downside and shook hands with familiar Quasimodo support at 1459.2, converging closely with weekly support at 1452.9.
Friday printed a stronger-than-expected recovery off the aforementioned Quasimodo base, pencilling in a bullish outside day formation. While closely connected with weekly support at 1452.9, buyers face resistance from the current 200-day SMA.
H4 perspective:
The coronavirus emergency continued to weigh on global economic growth last week, with investors favouring liquidity over safety, the dollar.
Bullion, despite daily Quasimodo support at 1459.2 (which merges with H4 Quasimodo support at 1463.9) and weekly support at 1452.9 in play along with the risk-averse mood, could remain under pressure this week.
Without a decisive move forming above daily resistance at 1550.3, bulls may lack conviction in this market, therefore it’s worth pencilling in H4 support beneath the current daily Quasimodo base at 1433.8, in the event we pop lower this week.
Areas of consideration:
Given the current status spot gold has took on over the past weeks, sellers still likely have the upper hand this week.
- H4 resistance at 1518.0 is first in line as a possible ceiling.
- A break above 1518.0 perhaps clears the path to H4 resistances at 1548.9/1540.0, which merges closely with a 161.8% ABCD (black arrows) Fibonacci extension at 1553.9 and a 38.2% Fibonacci retracement at 1547.6 (green zone). In addition, the H4 area houses daily resistance at 1550.3 within its upper boundary and is stationed a touch north of weekly resistance at 1536.9.
Out of the two, 1548.9/1540.0 appears the higher probability reversal zone.
The accuracy, completeness and timeliness of the information contained on this site cannot be guaranteed. IC Markets does not warranty, guarantee or make any representations, or assume any liability regarding financial results based on the use of the information in the site.
News, views, opinions, recommendations and other information obtained from sources outside of www.icmarkets.com.au, used in this site are believed to be reliable, but we cannot guarantee their accuracy or completeness. All such information is subject to change at any time without notice. IC Markets assumes no responsibility for the content of any linked site.
The fact that such links may exist does not indicate approval or endorsement of any material contained on any linked site. IC Markets is not liable for any harm caused by the transmission, through accessing the services or information on this site, of a computer virus, or other computer code or programming device that might be used to access, delete, damage, disable, disrupt or otherwise impede in any manner, the operation of the site or of any user’s software, hardware, data or property.
[1] https://www.bostonfed.org/news-and-events/press-releases/2020/federal-reserve-board-expands-money-market-mutual-fund-liquidity-facility.aspx


