
EUR/USD:
Weekly gain/loss: -0.35%
Weekly closing price: 1.2285
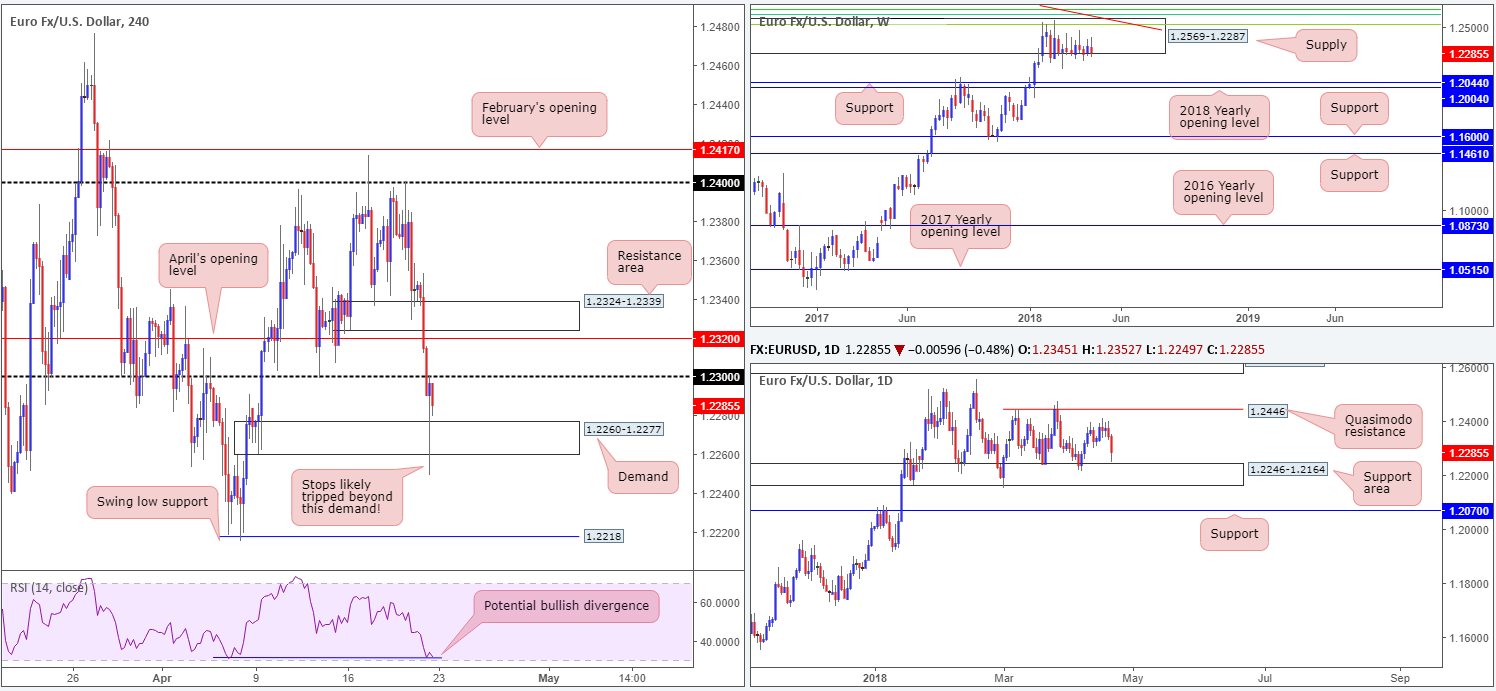
Shaped by three robust weekly candles back in late 2014, the weekly supply zone priced in at 1.2569-1.2287 has held the EUR/USD captive since late January. Although the buyers still have a strong hand in this fight (see overall trend), we feel the pair may want to shake hands with nearby support targets (weekly support band at 1.2044, shadowed closely by the 2018 yearly opening level at 1.2004) before making its next play.
In terms of daily movement, the single currency remains posted above a daily support area plotted at 1.2246-1.2164. Formed from a simple daily supply back in 2014, this zone has governed downside action since the beginning of the year. Purely from a technical perspective, we believe this is the reason behind weekly sellers’ struggle to pursue lower levels. The next port of call beyond the daily zone can be seen at 1.2070: a daily support level positioned just north of the aforementioned weekly levels.
A quick recap of Friday’s action on the H4 scale shows price broke out of its recent range (H4 demand at 1.2324-1.2339/1.24) to the downside amid signs of a slowing Eurozone economy. Likely also affected by a strong USD across the board, the H4 candles concluded Friday’s segment whipsawing through the lower edge of a H4 demand base at 1.2260-1.2277 (likely tripping stops), and settled just south of 1.23. One other thing to keep in mind is the H4 RSI currently displays a bullish divergence reading just ahead of the oversold value.
Potential trading zones:
Because buyers have likely been weakened around H4 demand mentioned above at 1.2260-1.2277, and seeing as 1.23 held firm as resistance, further moves to the downside are expected today/early this week. With this being said, though, traders need to prepare for the possibility of a bullish reaction off of 1.2246ish: the top edge of the daily support area, followed then by the H4 swing low support at 1.2218.
On account of the above, intraday shorts could be an option as long as take-profit targets remain nearby 1.2246. Longer-term, however, this market is a tricky beast to tackle, given the clear conflict seen between weekly and daily structures at this time.
Data points to consider today: Slew of Eurozone manufacturing PMIs; US existing home sales.
GBP/USD:
Weekly gain/loss: -1.68%
Weekly closing price: 1.4001
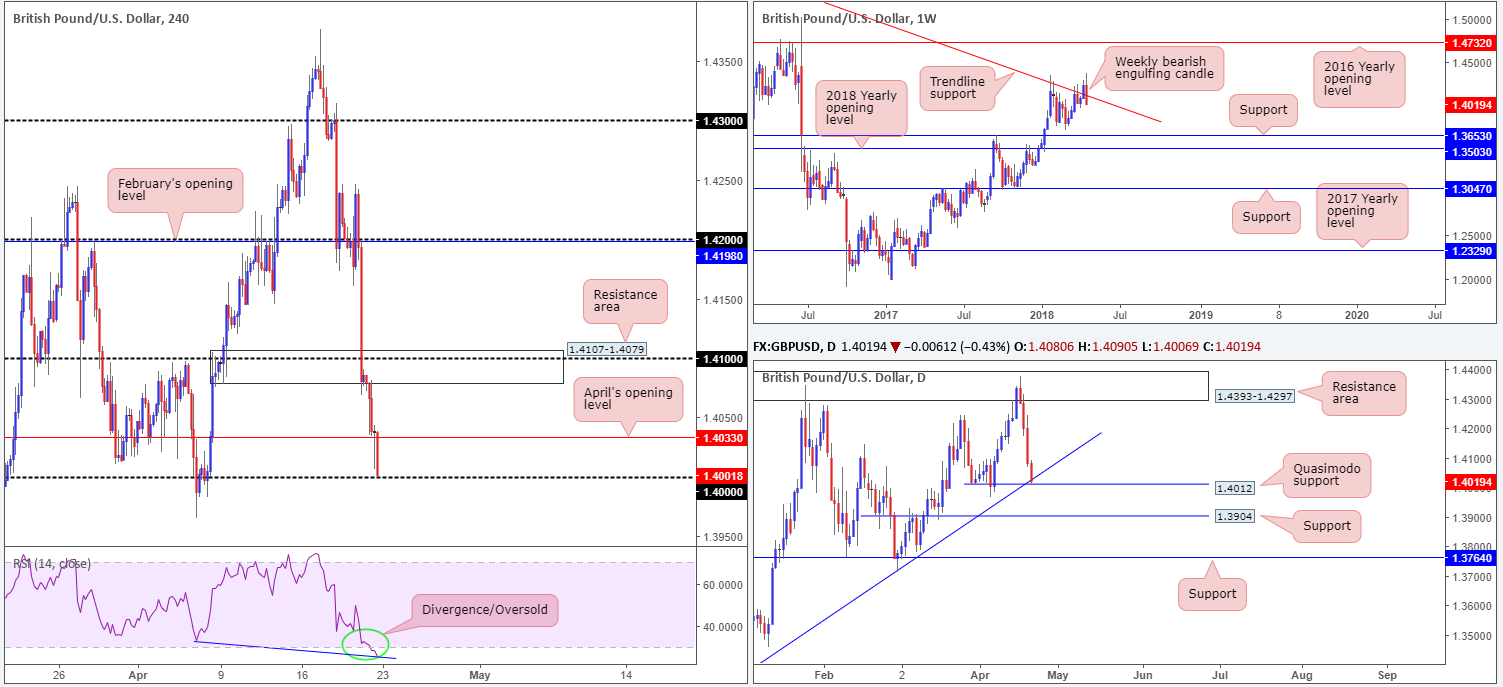
In the shape of a strong-looking weekly bearish engulfing candle, last week’s movement nose-dived back beneath a long-term weekly trend line resistance taken from the high 1.5930. This has likely caught the attention of candlestick enthusiasts and therefore could spark further selling this week. Points of interest from this angle fall in at the Feb 26 low 1.3711, followed closely by weekly support marked at 1.3653.
Turning our attention to daily structure, we can see that daily price ended the week closing at a rather interesting support: a daily Quasimodo support at 1.4012 that intersects beautifully with a daily trend line support etched from the low 1.3061. Should the barrier hold there’s little resistance seen until we reach the 1.42 neighborhood. Additional downside, on the other hand, has daily support at 1.3904 to target.
Over on the H4 candles, recent selling pressure took out both H4 demand at 1.4107-1.4079 (now acting resistance area) and April’s opening level at 1.4033, before closing the week out just north of the key psychological support 1.40.
It has been quite a week for the British pound! April’s rally hit a stumbling block after clocking a fresh post-Brexit vote peak on Monday. Softened by average earnings, inflation and a miss on retail sales prompted BoE Governor Carney to ‘manage’ expectations for a May hike, which were close to unanimous heading into the week. MPC hawk Saunders partially redressed the balance on Friday, but odds for a tightening next month are now evens at best.
Potential trading zones:
Traders are likely honing in on the key figure 1.40 today, given its close connection with the current daily support structures, as well as the H4 RSI indicator exhibiting strong divergence within oversold territory. The only wrinkle in this line up is the fact that weekly price suggests further selling could be on the cards! As such, we would strongly recommend waiting and seeing if H4 price can print a full or near-full-bodied bull candle from 1.40 before pulling the trigger. This, alongside noted convergence, would likely be enough to lift prices back above April’s opening level at 1.4033 and up to the 1.41 region.
Data points to consider today: US existing home sales.
AUD/USD:
Weekly gain/loss: -1.24%
Weekly closing price: 0.7669
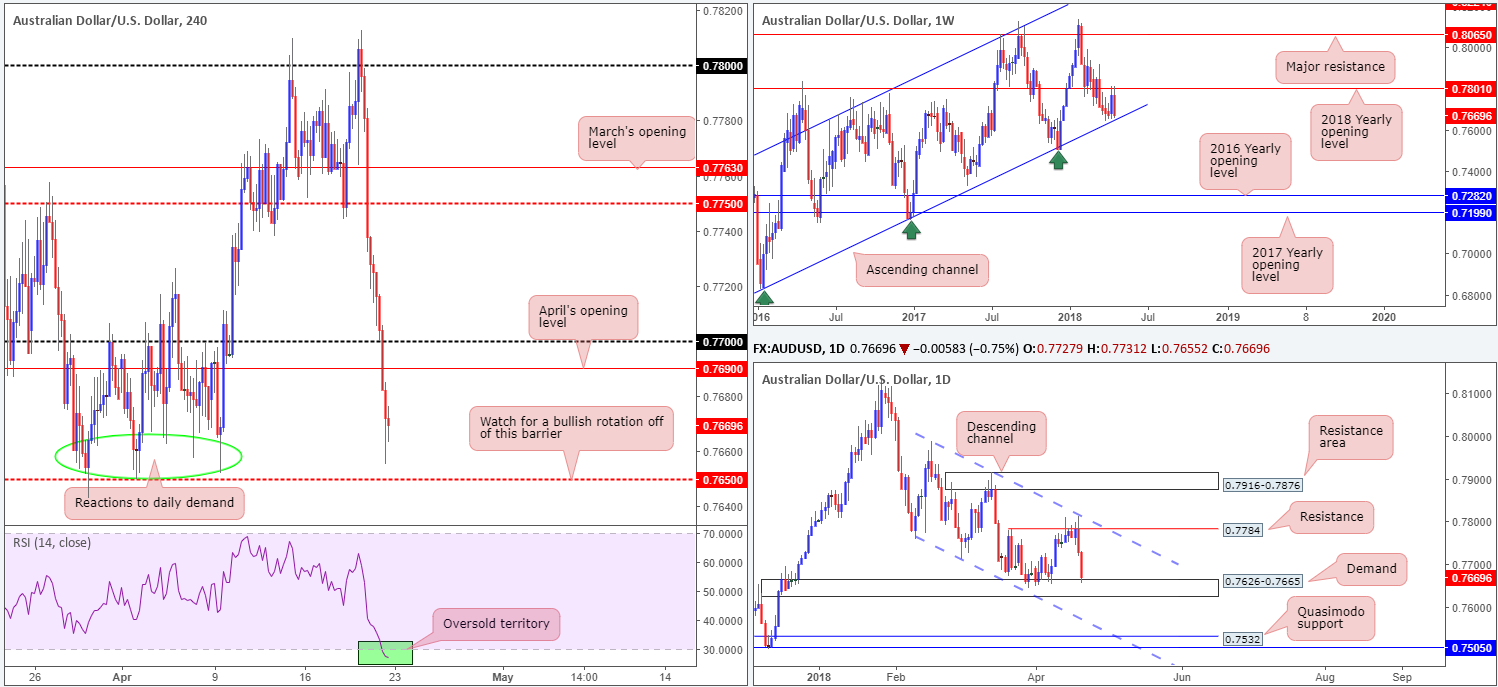
After crossing swords with the 2018 yearly opening level seen on the weekly timeframe at 0.7801 last week, the commodity currency fell sharply. Reclaiming all of the prior week’s gains, weekly price is now seen trading within striking distance of a long-term weekly channel support extended from the low 0.6827.
Daily resistance at 0.7784, along with a converging daily channel resistance taken from the high 0.7988, capped upside beautifully in recent trade. As is shown on the daily timeframe, the Aussie dollar withered against its US counterpart in the later stages of the week, consequently placing daily demand at 0.7626-0.7665 on the radar. Further selling from here could open up the pathway south to the daily channel support drawn from the low 0.7758, followed then by a daily Quasimodo support at 0.7532.
With Thursday’s downbeat jobs report undermining Aussie sentiment, H4 price failed to clear 0.78 once again and forced its way south beyond 0.7750. Thanks largely to an upbeat USD, Friday’s action went on to drill through the 0.77 band and easily cleared nearby support in the shape of April’s opening level at 0.7690, leaving the H4 mid-level support at 0.7650 on the hit list going into the new week. Also worth noting is the H4 RSI is currently trading inside oversold territory.
Potential trading zones:
Having seen weekly price park itself just ahead of a weekly channel support, and daily price recently engage with demand, a recovery to the upside could be in store this week. The team has emphasized interest in 0.7650 on the H4 timeframe as a potential platform to look for buying opportunities. A reasonably sized H4 full or near-full-bodied bullish rotation candle printed from here would, in our technical book, suggest buyer intent, with a realistic initial target objective set at 0.7690: April’s opening line.
Data points to consider today: RBA Assist Gov. Kent speaks; US existing home sales.
USD/JPY:
Weekly gain/loss: +0.30%
Weekly closing price: 107.61
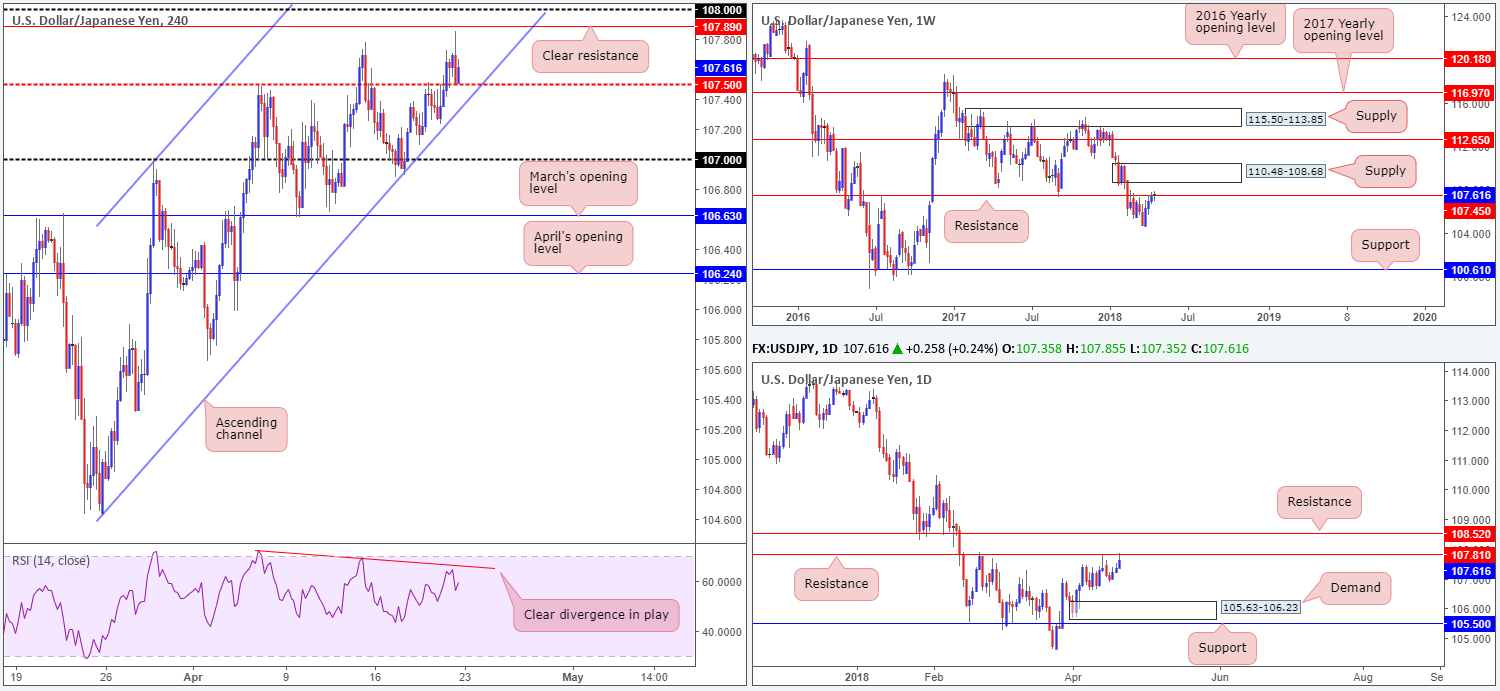
The USD/JPY market extended gains for a fourth consecutive session last week, resulting in weekly price marginally closing beyond a weekly resistance level positioned at 107.45. With sellers potentially weakened, the next area of interest to the upside can be seen at a weekly supply zone drawn from 110.48-108.68.
A little lower on the curve, however, daily price finished the week testing daily resistance plotted at 107.81. This level formed support back in September 2017 and again as resistance in February and April of 2018. A move lower from this barrier, therefore, is a possibility and could lead to a test of daily demand based at 105.63-106.23. A break higher, nonetheless, has daily resistance at 108.52 to target (seen just south of the noted weekly supply).
Friday’s dealings on the H4 timeframe show the candles eventually conquered H4 mid-level resistance plotted at 107.50, and went on to test highs of 107.85, just missing a clear H4 resistance hurdle at 107.89 before retreating to retest 107.50 as support. Additional noteworthy points are:
- The H4 RSI presents clear bearish divergence.
- The H4 channel support extended from the low 104.62 is seen just beneath 107.50.
Potential trading zones:
In short, here’s what we have so far:
- Weekly price showing signs of a continuation move higher.
- Daily price battling with resistance.
- H4 action sandwiched between 107.89/107.50.
On account of this, we feel upside in this market is clear beyond the 108 handle up to daily resistance at 108.52/underside of weekly supply at 108.68 (potential [intraday] long plays on any retest seen at 108 as support). By contrast, downside appears free beyond the H4 channel support. However, room is limited given the possibility of support emerging from 107.
Data points to consider today: US existing home sales.
USD/CAD:
Weekly gain/loss: +1.20%
Weekly closing price: 1.2764
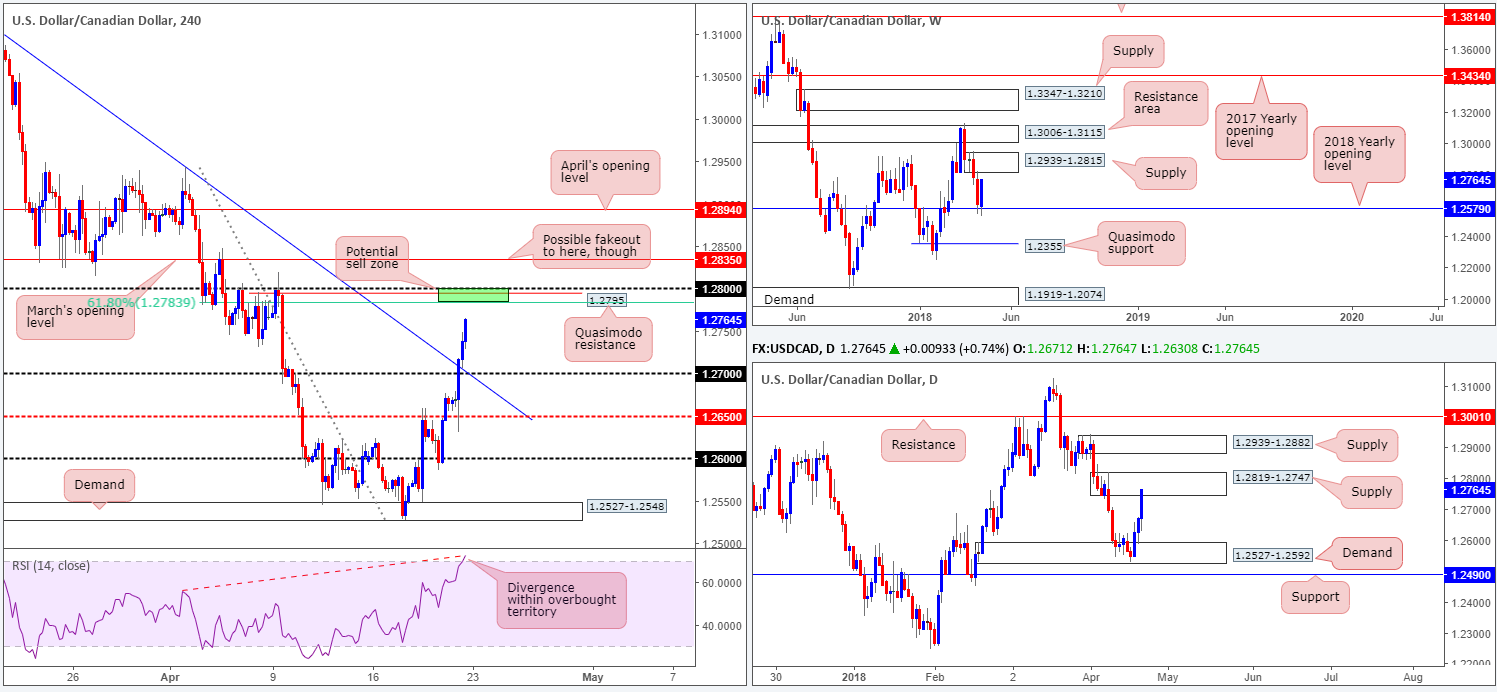
The USD/CAD sported a surprisingly strong recovery off the 2018 yearly opening level seen on the weekly timeframe at 1.2579 last week. Retrieving 100% of the prior week’s losses and closing the week at its highs, weekly price is now stationed just south of weekly supply at 1.2939-1.2815.
Daily demand at 1.2527-1.2592 offered buyers a platform to trade from last week, which, as you can probably see, encapsulates the noted 2018 weekly level. Strong buying led to daily price eventually shaking hands with supply coming in at 1.2819-1.2747, which happens to be glued to the underside of the noted weekly supply zone. Continued buying from this point may call for daily supply at 1.2939-1.2882 to be brought into play (positioned within the upper limits of the current weekly supply).
The Canadian dollar gained additional downside pressure on Friday after inflation figures surprised to the downside in March, forcefully lifting the H4 candles above 1.27 and its converging H4 trend line resistance taken from the high 1.3124. What this move also accomplished was highlight a particularly interesting area of resistance on the H4 timeframe at 1.28/1.2783. Comprised of the 1.28 handle, a H4 Quasimodo resistance at 1.2795, a 61.8% H4 Fib resistance level at 1.2783 and an accompanying H4 RSI divergence/overbought reading, this area could potentially hold prices lower today/early this week.
Potential trading zones:
As already noted above, we’re a fan of 1.28/1.2783. Bolstering this area further, however, is the fact that it is housed within the daily supply mentioned above at 1.2819-1.2747. The initial take-profit target from this point can be set at 1.27. Despite the strong confluence offered here, though, there is one cautionary point to take on board: a potential fakeout up to March’s opening level at 1.2835. It is important to note that this level resides within the lower limits of weekly supply at 1.2939-1.2815. Therefore, should you look to short 1.28/1.2783, remain cognizant of this risk!
Data points to consider today: US existing home sales; BoC Gov. Poloz speaks.
USD/CHF:
Weekly gain/loss: +1.29%
Weekly closing price: 0.9750
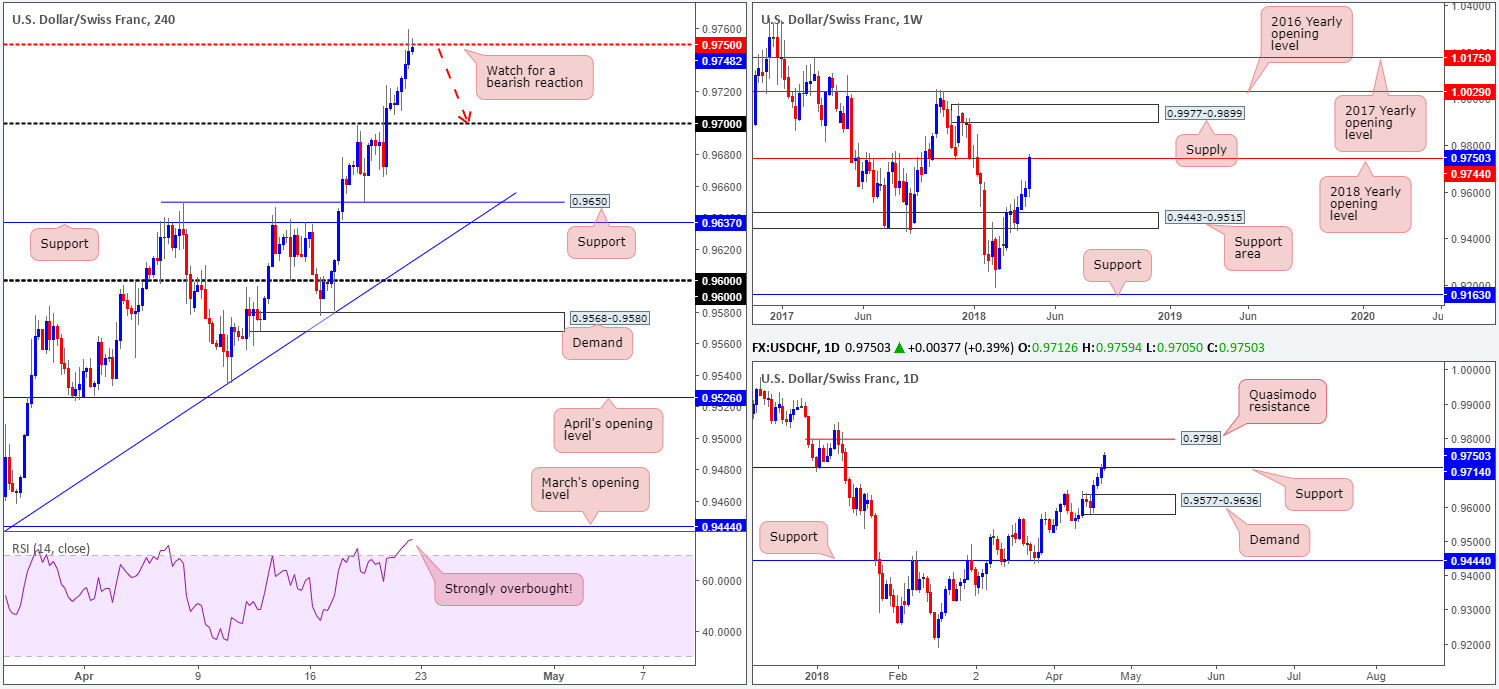
Chalking up its fourth consecutive weekly gain last week, weekly price concluded the session marrying up with the 2018 yearly opening level sited at 0.9744. Increased pressure to the upside this week may introduce weekly supply at 0.9977-0.9899 to the fight. A rejection off 0.9744, on the other hand, has a downside objective located at 0.9443-0.9515: a weekly support area.
A closer look at price action on the daily timeframe exhibits potential to climb higher and touch gloves with a daily Quasimodo resistance at 0.9798, after strongly driving above daily resistance at 0.9714 (now acting support). A break of this Quasimodo, at least as far as we can see, would be considered a strong bullish indication that we’ll soon be reaching the aforementioned weekly supply!
Following a break of 0.97 on the H4 timeframe, the pair went on to challenge nearby resistance at 0.9750 going into Friday’s close. As this level has connections with the 2018 yearly opening level mentioned above at 0.9744, a selloff from here could be seen this week, despite daily price indicating higher prices may be in store.
Potential trading zones:
Keeping it simple, the team has noted to keep a watchful eye on 0.9750. Complemented with a strong overbought reading on the H4 RSI indicator and weekly resistance, a H4 full or near-full-bodied bearish candle printed from here would, technically speaking, be worthy of shorting. However, we feel it would be best to try and attempt to get your stops as tight as possible on this one since the next downside target from here falls in around daily support noted above at 0.9714.
Data points to consider today: US existing home sales.
DOW 30:
Weekly gain/loss: +0.42%
Weekly closing price: 24462
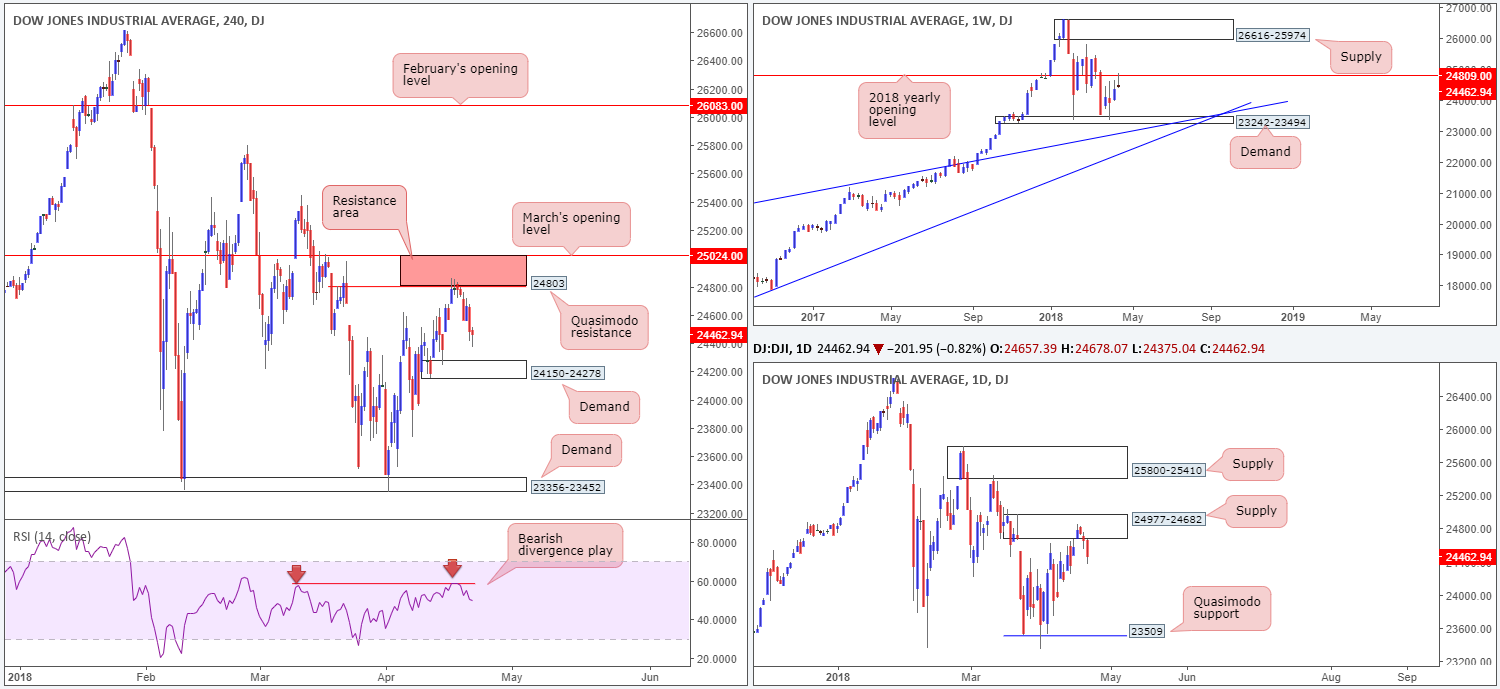
Over the course of last week, we witnessed the Dow Jones Industrial Average reconnect with the underside of the 2018 yearly opening level at 24809. Selling interest from this level, as you’ll see on the weekly timeframe, formed a nice-looking weekly bearish pin-bar formation. The question is, though, will this be enough to attract sellers into the market this week and maybe even make a play for weekly demand plotted at 23242-23494?
Bolstering the aforementioned 2018 yearly line was a daily supply zone penciled in at 24977-24682. From a technician’s perspective, we feel this certainly added weight to the weekly level! Downside from this point is relatively free, as far as we can see, with the next support target not coming into motion until we reach 23509: a daily Quasimodo support level.
Since the beginning of last week the team were banging the drum about a H4 resistance area marked in red at 25024/24803 (March’s opening level and a H4 Quasimodo resistance). Why we liked this zone was simply down to the H4 RSI indicator displaying bearish divergence, as well as having strong connections to higher timeframe structures (weekly 2018 yearly level and current daily supply). Well done to those who took advantage of this short!
Potential trading zones:
According to market structure, further downside could be upon us this week. We believe the H4 candles are likely to retest H4 demand brought in at 24150-24278. Beyond this area, the team has noted to also keep an eyeball on the H4 demand at 23356-23452 as the next downside target, which happens to be positioned just beneath the daily Quasimodo support mentioned above at 23509.
Data points to consider today: US existing home sales.
GOLD:
Weekly gain/loss: -0.74%
Weekly closing price: 1335.5
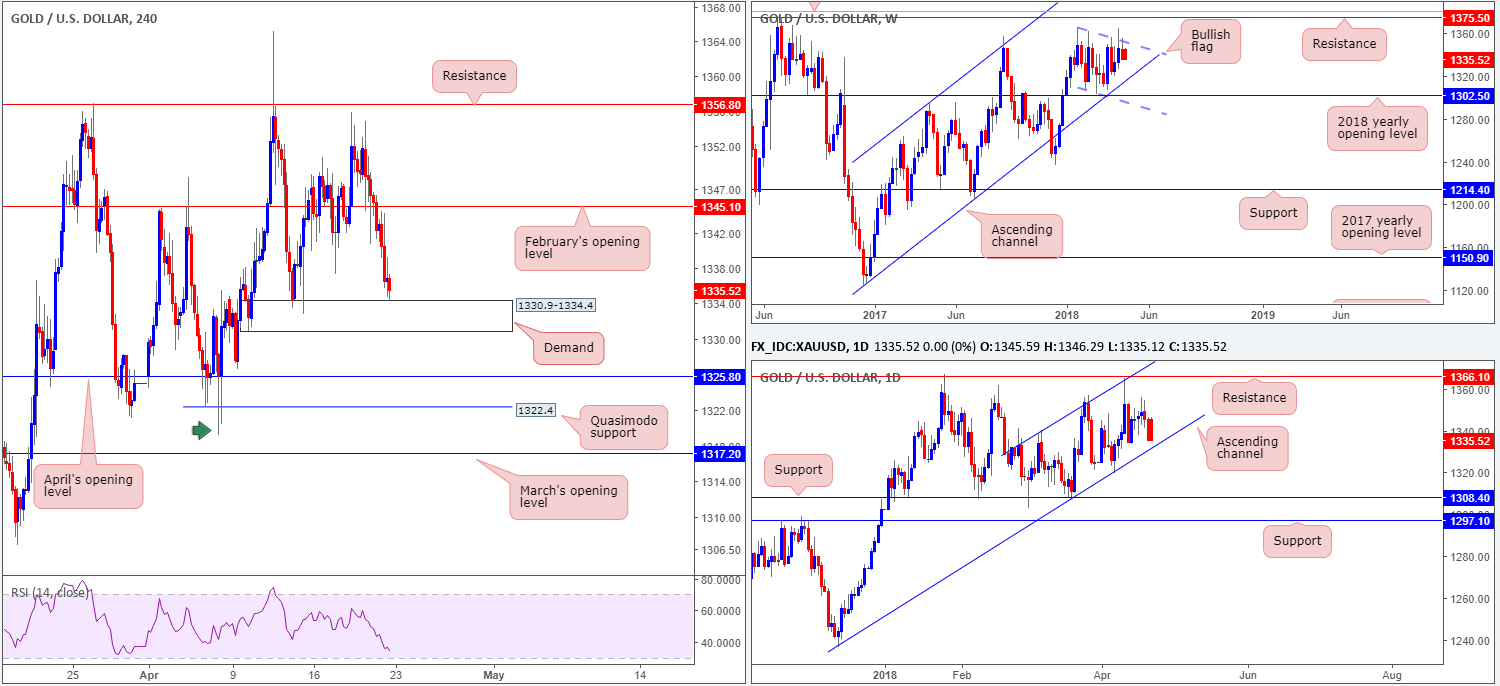
As the US dollar lifted higher last week, we witnessed the price of gold fade the top edge of a bullish flag formation taken from the high 1366.0 is reasonably strong fashion. Sustained selling from this point could eventually force bullion to challenge a long-term weekly channel support taken from the low 1122.8.
Stepping down to the daily timeframe, it remains clear that the yellow metal has spent over a month compressing within a daily ascending channel (1236.6/1340.5). The week ended with price closing in the shape of a near-full-bodied daily bearish candle just north of the daily channel support. In the event that this ascending line fails to hold (assuming it is tested that is), traders’ crosshairs will then likely be pinned on the April 6 low at 1319.8, followed by daily support placed at 1308.4.
Leaving the H4 resistance level at 1356.8 unchallenged on Thursday, the H4 candles began to break down. February’s opening level at 1345.1, despite attempting to hold, gave way and price went on to close the week out testing the top edge of a H4 demand base coming in at 1330.9-1334.4.
Potential trading zones:
While intraday traders will likely have their eyes on the current H4 demand, we feel there’s a strong chance that we may see a fakeout through the area, as the current daily channel support level is lurking just below it. A better area for longs, in our opinion, is April’s opening level seen at 1325.8, which happens to merge nicely with the said daily channel line! However, remain cognizant of the H4 Quasimodo support beneath that line at 1322.4 as this could also act as a magnet to price. Therefore, safe stops on long positions are best placed beyond the head of the noted H4 Quasimodo at 1319.2 (green arrow).
This site has been designed for informational and educational purposes only and does not constitute an offer to sell nor a solicitation of an offer to buy any products which may be referenced upon the site. The services and information provided through this site are for personal, non-commercial, educational use and display. IC Markets does not provide personal trading advice through this site and does not represent that the products or services discussed are suitable for any trader. Traders are advised not to rely on any information contained in the site in the process of making a fully informed decision.
This site may include market analysis. All ideas, opinions, and/or forecasts, expressed or implied herein, information, charts or examples contained in the lessons, are for informational and educational purposes only and should not be construed as a recommendation to invest, trade, and/or speculate in the markets. Any trades, and/or speculations made in light of the ideas, opinions, and/or forecasts, expressed or implied herein, are committed at your own risk, financial or otherwise.
The use of the site is agreement that the site is for informational and educational purposes only and does not constitute advice in any form in the furtherance of any trade or trading decisions.
The accuracy, completeness and timeliness of the information contained on this site cannot be guaranteed. IC Markets does not warranty, guarantee or make any representations, or assume any liability with regard to financial results based on the use of the information in the site.
News, views, opinions, recommendations and other information obtained from sources outside of www.icmarkets.com.au, used in this site are believed to be reliable, but we cannot guarantee their accuracy or completeness. All such information is subject to change at any time without notice. IC Markets assumes no responsibility for the content of any linked site. The fact that such links may exist does not indicate approval or endorsement of any material contained on any linked site.
IC Markets is not liable for any harm caused by the transmission, through accessing the services or information on this site, of a computer virus, or other computer code or programming device that might be used to access, delete, damage, disable, disrupt or otherwise impede in any manner, the operation of the site or of any user’s software, hardware, data or property.


