
Key risk events today:
RBA Gov Lowe Speaks; BoC Gov. Macklem Speaks.
(Previous analysis as well as outside sources – italics).
EUR/USD:
Weekly gain/loss: -0.72%
Weekly close: 1.1173
Weekly perspective:
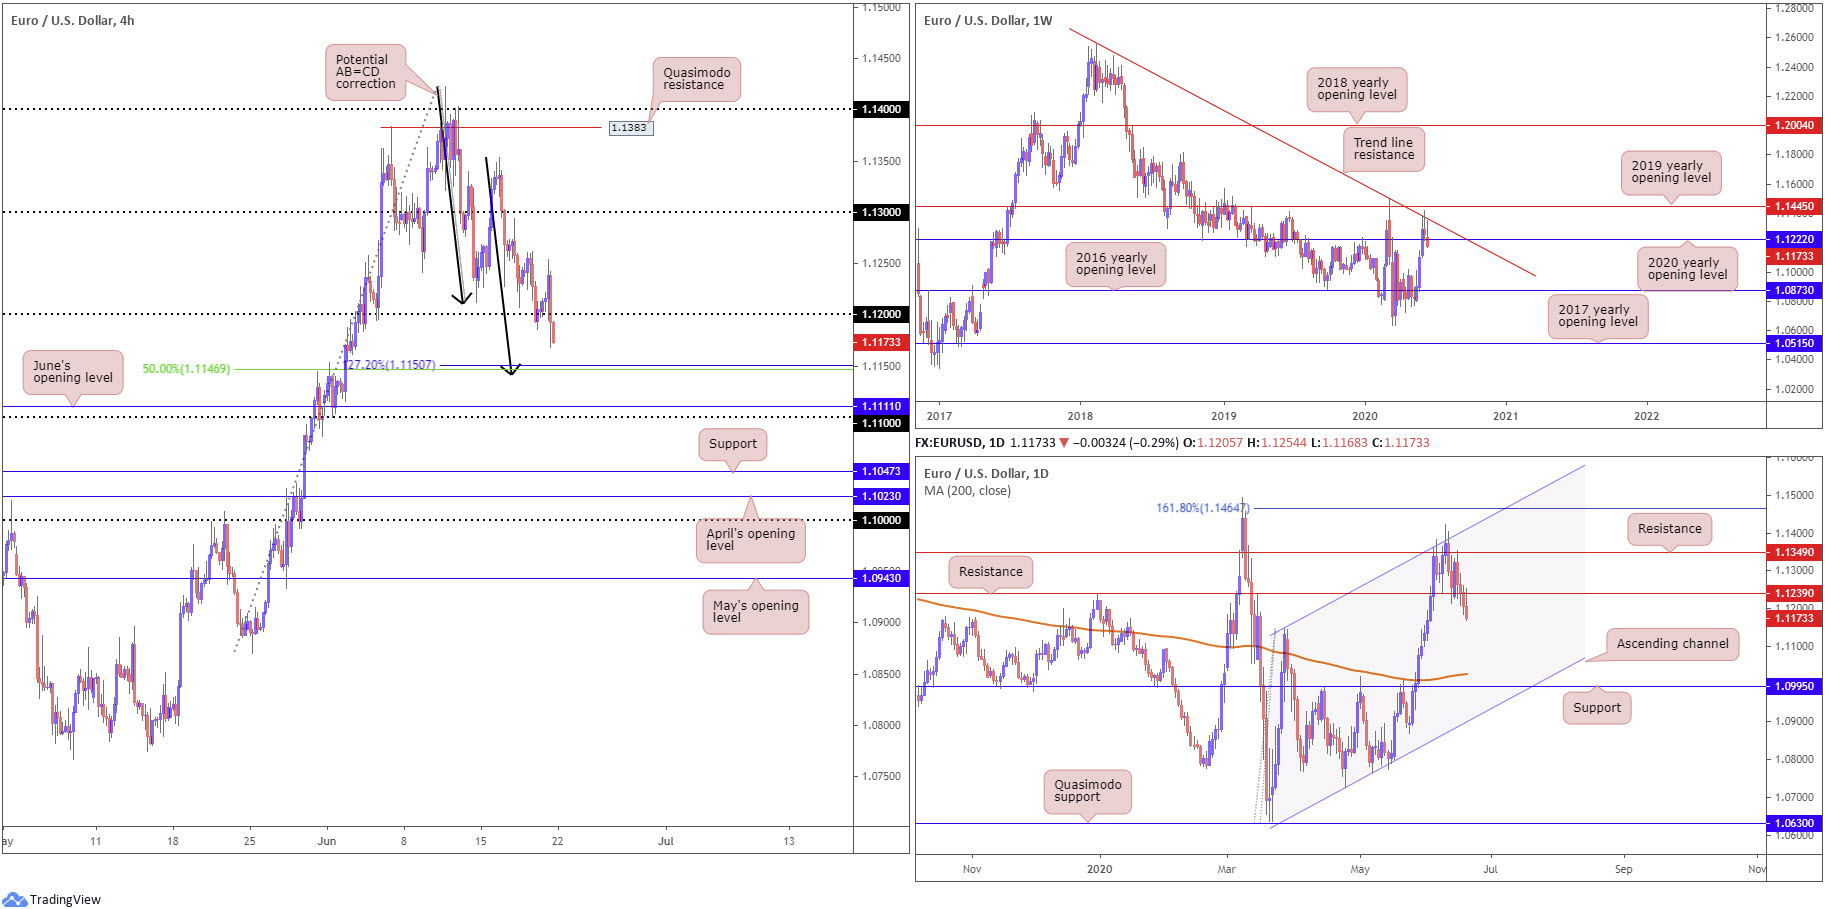
Impetus continued to wane in recent trade, modestly extending losses south of long-standing trend line resistance, taken from the high 1.2555.
The 2020 yearly opening level at 1.1222 also came under fire, putting forward the possibility of an approach to the 2016 yearly opening level at 1.0873 over the coming weeks. This, therefore, positions sellers in the driving seat at the moment.
Daily perspective:
Daily, as you can see, had price action cross into waters under support at 1.1239 last week, retesting the base as resistance on Friday.
Recording its fourth consecutive decline, the break of the aforementioned support is considered significant, perhaps exposing downside to as far south as the 200-day SMA (orange – 1.1026), which is on the point of turning higher after drifting south for several months.
H4 perspective:
Despite a reasonably passionate recovery attempt, traders abandoned 1.12 going into US hours Friday. This tilts towards price challenging a relatively uniform AB=CD correction (black arrows) pattern at 1.1140 early week. A 127.2% Fibonacci extension point at 1.1150 converges close by, together with a 50.00% retracement ratio at 1.1146.
Breaking through the AB=CD formation throws June’s opening level at 1.1111 into the pot as feasible support this week, along with the 1.11 handle.
Areas of consideration:
The breach of 1.12 has likely excited sellers, particularly after the level held as resistance (check M30 timeframe). 1.1150ish, given H4 confluence, provides enough support to generate a reaction, therefore serving as a logical downside target for intraday shorts under 1.12. Remember, though, the higher timeframes are on your side here, according to technical studies, so downside beyond 1.1150 should not surprise.
H4 AB=CD reactions can produce sizeable moves, typically targeting the 38.2% and 61.8% Fibonacci retracement ratios from legs A-D (can only be applied once/if the AB=CD pattern completes its D-leg). AB=CD buyers, however, are urged to exercise caution here, owing to higher timeframes indicating lower levels this week.
GBP/USD:
Weekly gain/loss: -1.54%
Weekly close: 1.2342
Weekly perspective:
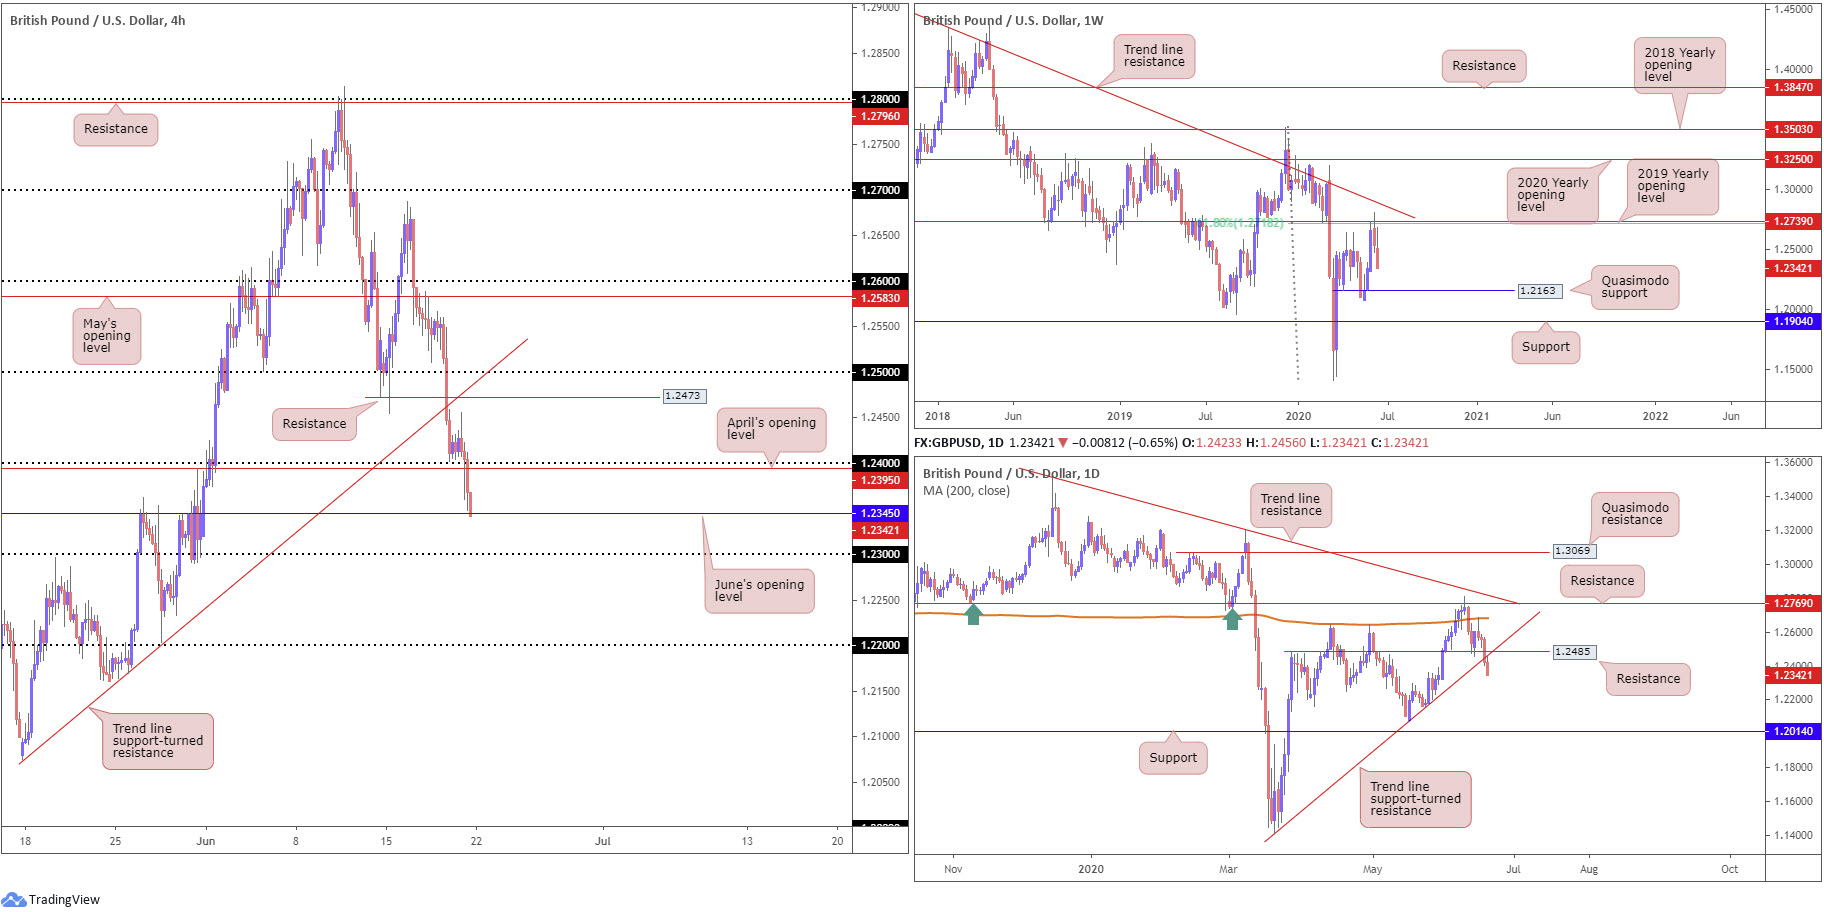
The British pound put in additional declines against the buck last week, extending south of the 61.8% Fibonacci retracement ratio at 1.2718 and 2019 yearly opening level at 1.2739. It should also be emphasised these levels are positioned beneath a long-term trend line resistance, etched from the high 1.5930.
In line with the overall downtrend, recent movement throws Quasimodo support at 1.2163 in the frame as a feasible downside target this week.
Daily perspective:
In conjunction with the weekly timeframe, daily support at 1.2485 yielded Thursday (now a serving resistance), with Friday following through to violate trend line support, taken from the low 1.1409.
The break of the daily supports signals the likelihood of a run to weekly Quasimodo support this week, mentioned above at 1.2163.
H4 perspective:
Transitioning into early Europe Friday, a fleeting move to highs at 1.2455 took shape following the release of stronger-than-anticipated UK monthly retail sales data.
The Office for National Statistics noted:
Retail sales volumes partly rebounded in May 2020 with an increase of 12.0% when compared with the record falls experienced in the previous month, but sales were still down by 13.1% on February before the impact of the coronavirus (COVID-19) pandemic.
Sellers, however, soon strengthened their grip heading into London, eventually overwhelming the 1.24 handle and April’s opening level at 1.2395. This landed candles at June’s opening level drawn from 1.2345 into the close, with a break perhaps uncovering 1.23.
Areas of consideration:
Both weekly and daily timeframes exhibit scope to soften this week, targeting weekly Quasimodo support some 200-pips away at 1.2163.
The above casts a cloud of uncertainty over June’s opening level at 1.2345 as support. A H4 close under 1.2345 may ignite intraday bearish scenarios towards 1.23, with a break putting forward 1.22 as a potential support target.
Another scenario worth putting on the table this week is a possible retest at the underside of 1.24ish. Having noted higher-timeframe structure’s projection, the level could stand firm as resistance and offer considerable risk/reward. Conservative traders will likely want to see at least a H4/H1 bearish candlestick form before pulling the trigger, as round numbers are prone to fakeouts.
AUD/USD:
Weekly gain/loss: -0.49%
Weekly close: 0.6833
Weekly perspective:
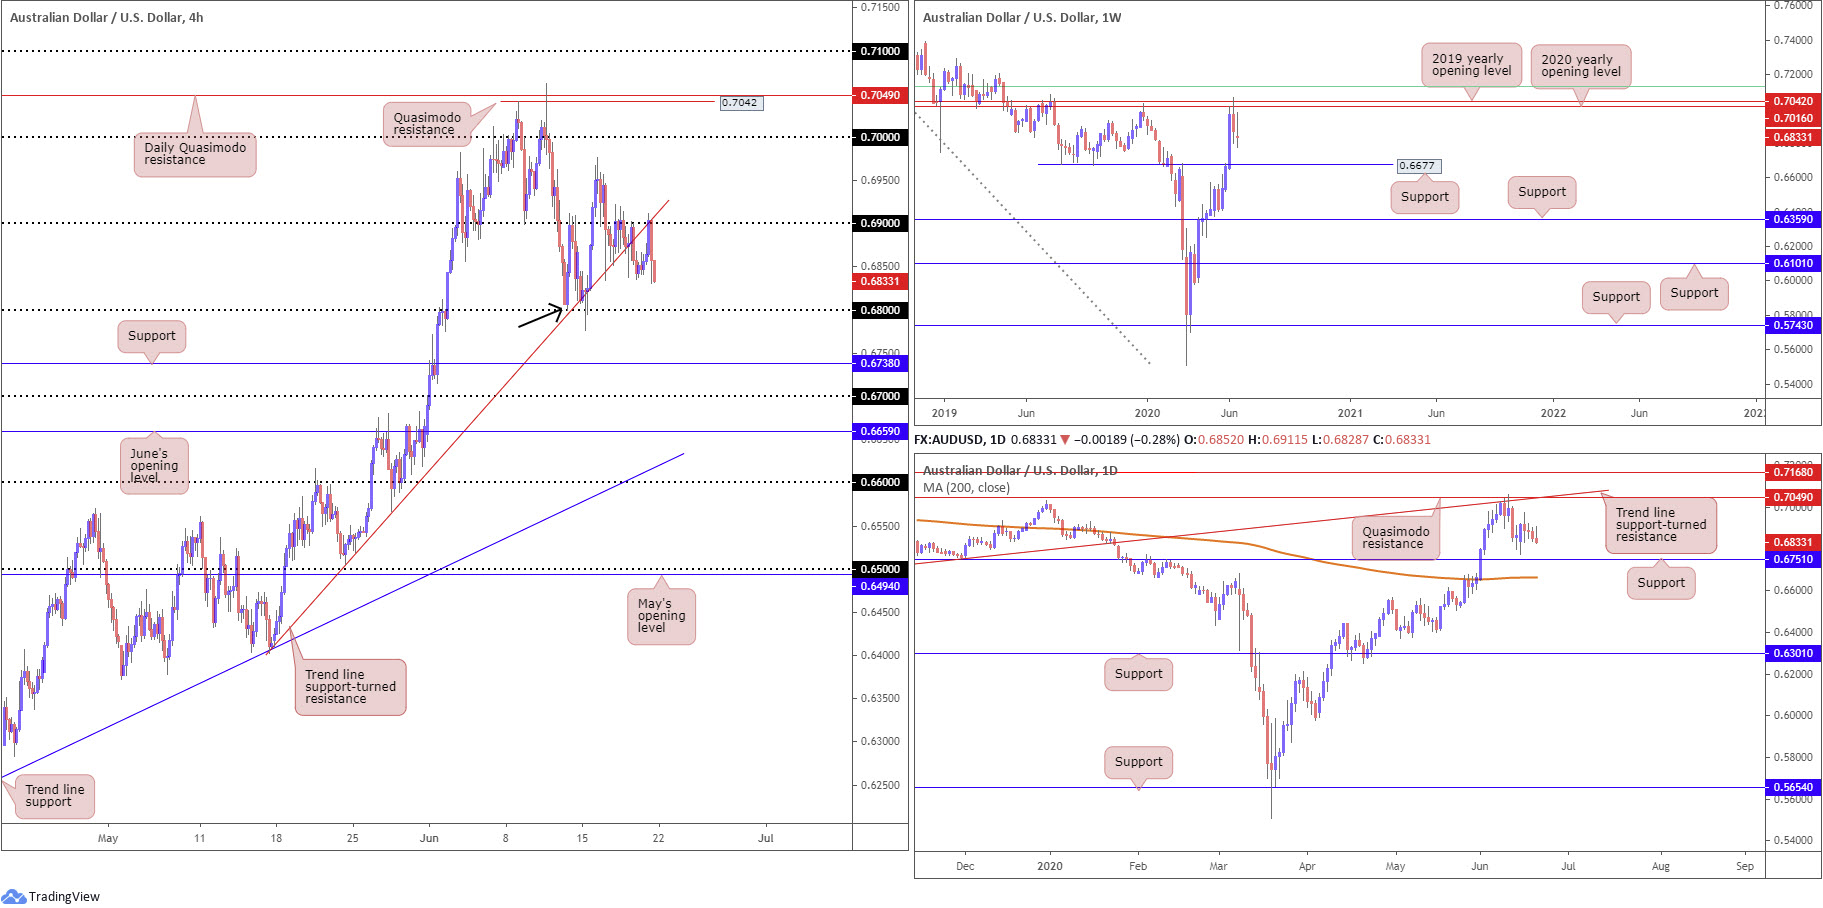
Overall, it was a somewhat muted week, despite ranging between 0.6976/0.6776.
Resistance, forged in the shape of a 2020 yearly opening level and a 2019 yearly opening level at 0.7016 and 0.7042, respectively, continues to offer a dominant presence on the weekly timeframe.
It might also interest traders to note that just above the said resistances we have a 61.8% Fibonacci retracement ratio stationed at 0.7128 (green). While we cannot rule out the possibility of upside attempts this week, support could eventually spin into sight at 0.6677.
The above emphasises a modestly bearish tone going into the new week.
Daily perspective:
Quasimodo resistance at 0.7049, merging closely with trend line support-turned resistance, taken from the low 0.6670, continues to cap upside.
Attention on this timeframe also remains at support coming in from 0.6751. Interestingly, lurking beneath here we have the 200-day SMA (orange – 0.6664), sited close by the weekly support at 0.6677.
H4 perspective:
Friday kept to a narrow range off resistance at 0.69, with local intraday support in motion at 0.6835. What’s notable here, heading into US hours, candle action shook hands with trend line support-turned resistance, taken from the low 0.6409, a level intersecting beautifully with 0.69.
This moves 0.68 in view as the next support target. It should be noted 0.68 also puts forward a local Quasimodo support (black arrow). Penetrating 0.68, nonetheless, shines the spotlight on H4 support coming in at 0.6738, with a break recognising 0.67.
Areas of consideration:
The break of H4 trend line support and recent retest suggests a bearish bias to at least 0.68 early week. Though, according to higher timeframes, dips beyond 0.68 are possible.
Sellers short the H4 trend line retest likely reduced risk to breakeven and banked partial profits ahead of the close. Leaving a portion of the position to run is an option in favour of moves to higher-timeframe supports (daily 0.6751 weekly 0.6677).
USD/JPY:
Weekly gain/loss: -0.48%
Weekly close: 106.84
Weekly perspective:
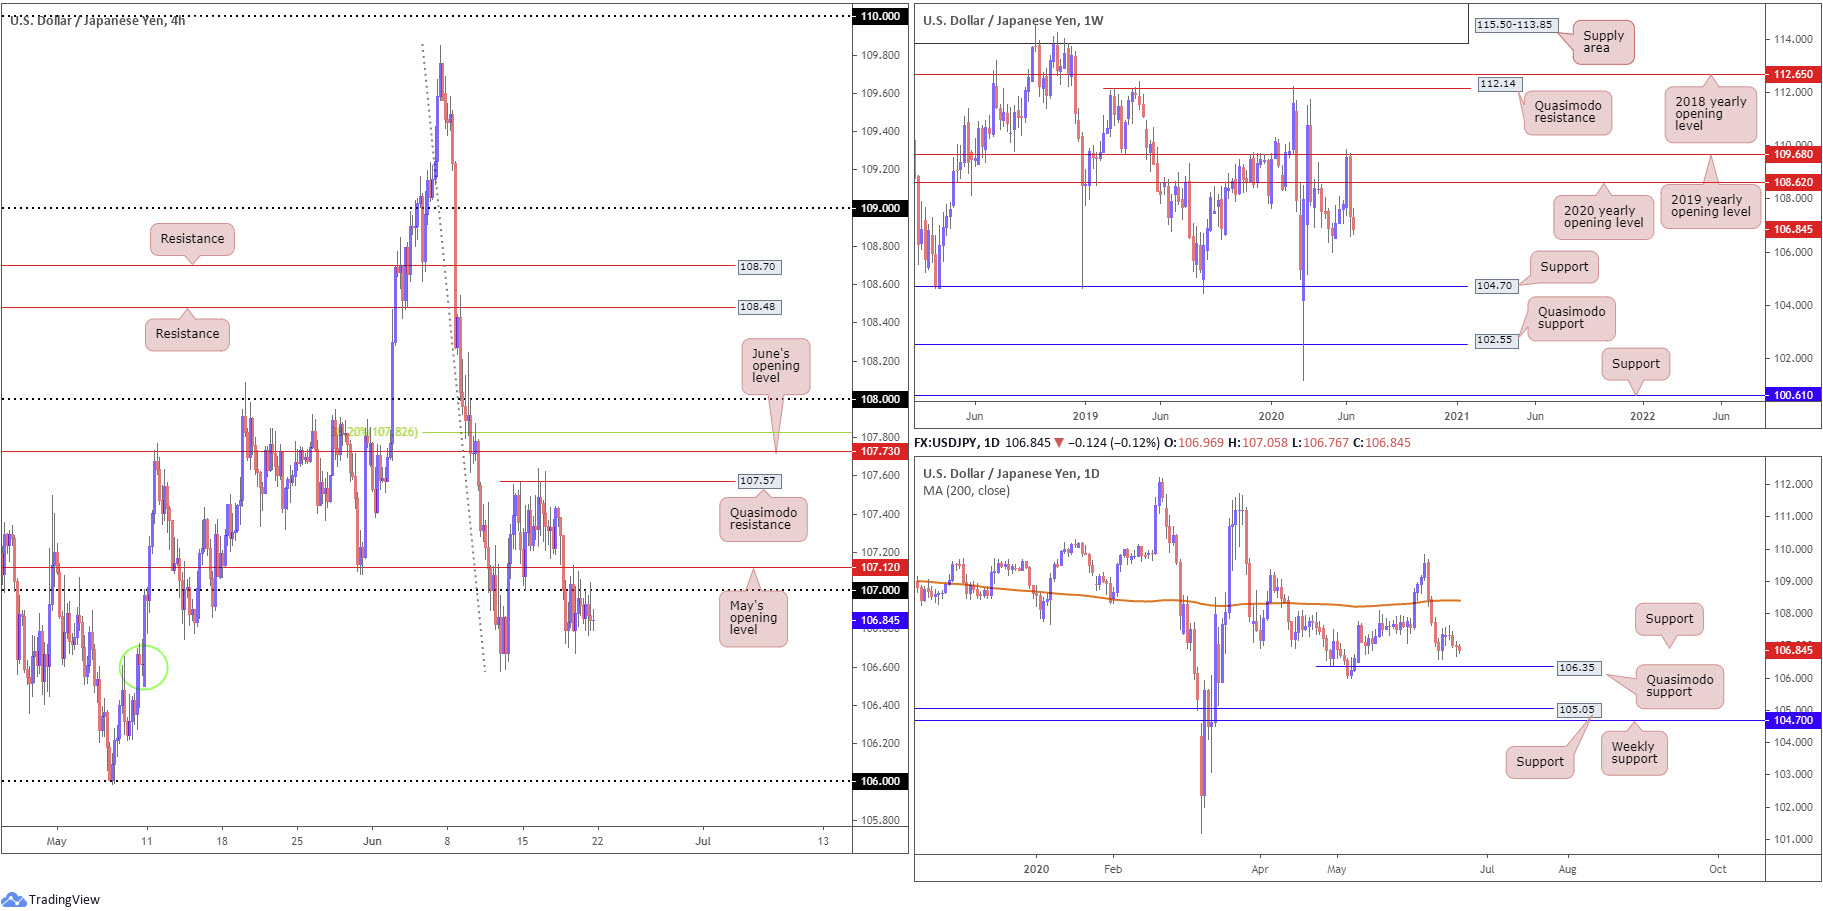
After rejecting the 2019 yearly opening level at 109.68 and voyaging through the 2020 yearly opening level at 108.62, this shifted focus to the 105.98 6th May low as the next downside target on this scale.
As evident from the chart, although concluding half-a-percent lower last week, price remained within the lower portion of its prior week’s range.
105.98, therefore, remains in view going forward.
Daily perspective:
A closer reading of price action on the daily timeframe reveals the candles appear to have eyes for Quasimodo support at 106.35 – It might be worth pointing out the 105.98 6th May low underscored on the weekly timeframe forms the low to the aforementioned Quasimodo support.
A break into territory south of the Quasimodo formation may eventually have price knocking on the door of support at 105.05.
H4 perspective:
The US dollar ended a shade lower against the Japanese yen Friday, sponsored by 107 and May’s opening level at 107.12 serving as resistance.
Slipping lower from this point has demand (green circle) to contend with around 106.60, with further selling underlining the 106 handle.
Areas of consideration:
As aired in Friday’s technical briefing, H4 sellers still appear to be accumulating a position sub 107 at the moment, albeit gripping bids around 106.75.
Weekly price invites a move to 105.98 – essentially the 106 handle on the H4 timeframe, while daily price suggests a potential speed bump at 106.35. H4 demand around 106.60 may also cause problems.
As a result of the above, bearish themes may be something to consider under 107 this week, noting 106.60 and 106.35 as possible hurdles to overcome before crossing swords with 106.
USD/CAD:
Weekly gain/loss: +0.17%
Weekly close: 1.3604
Weekly perspective:
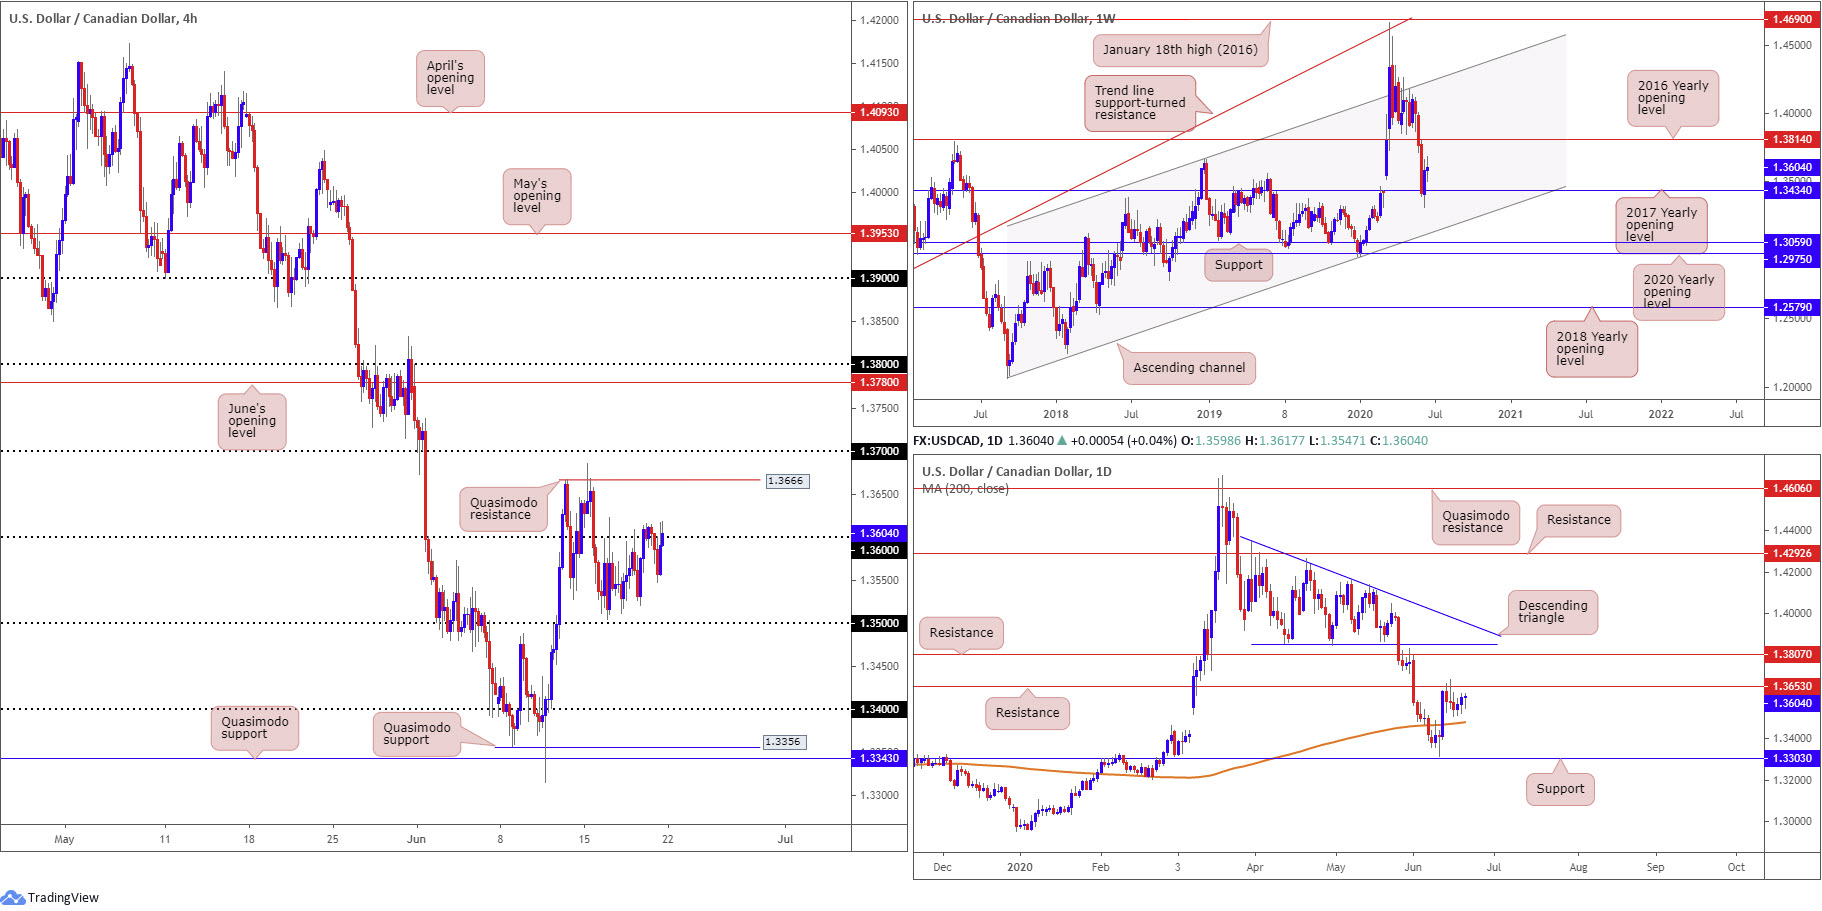
The week put forward a modest upside bias, adding more than 20 pips. This follows the prior week drawing impetus from the 2017 yearly opening level at 1.3434.
In the event this promotes additional bullish sentiment, a potential hurdle to be aware of this week falls in by way of the 2016 yearly opening level at 1.3814. Clearing 1.3434, on the other hand, places channel support, taken from the low 1.2061, in the limelight.
Daily perspective:
Buyers and sellers continue to mingle below resistance at 1.3653, with price so far incapable of gathering enough steam to bring in the 200-day SMA (orange – 1.3478). Above current resistance, another layer of resistance is visible at 1.3807, boasting a close connection to the underside of the recently completed descending triangle. Yet, a spin through the aforementioned SMA this week could have sellers take aim at support coming in from 1.3303.
H4 perspective:
Despite Friday latching onto a relatively healthy bid into 1.36, the round number has proved a tough nut to crack as resistance. This is likely due to the ongoing bid seen in oil bolstering the Canadian dollar – WTI recently touched gloves with $40.00/bbl. However, technicians will note each time price dips from 1.36, the unit fails to print a fresh low, indicating buyers may still be in the driving seat here.
Friday’s cautious close above 1.36 points to Quasimodo resistance at 1.3666 as the next upside hurdle this week, closely followed by 1.37. Diving from current price, on the other hand, could land things at 1.35, a level positioned ahead of the 200-day SMA on the daily timeframe at 1.3478.
Areas of consideration:
As highlighted in previous analysis, higher-timeframe buyers are unlikely to commit to the weekly timeframe’s push off support at 1.3434 until daily resistance from 1.3653 gives way.
Despite 1.36 recently standing firm with respect to resistance, its strength is questionable. Bullish scenarios above the round number could be an option this week, targeting daily resistance at 1.3653, followed by H4 Quasimodo resistance at 1.3666. Conservative traders may seek a retest scenario off 1.36 as support before committing to help avoid being stung from a fakeout, which is common viewing around psychological levels.
USD/CHF:
Weekly gain/loss: +0.04%
Weekly close: 0.9521
Weekly perspective:
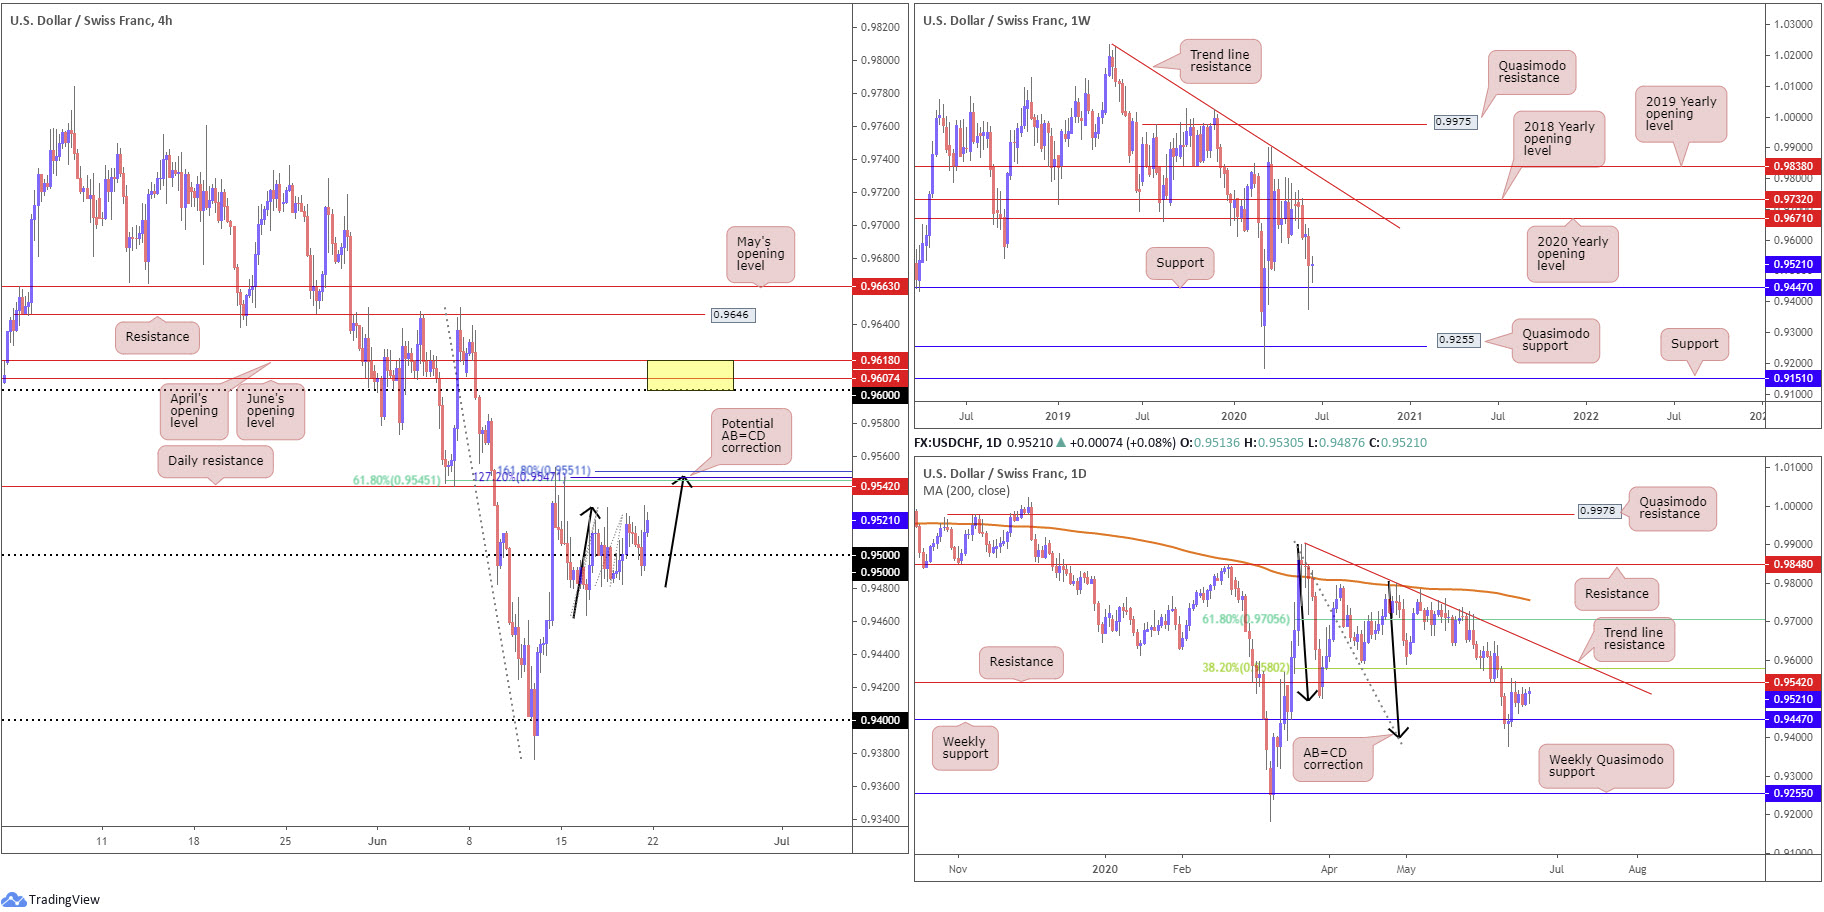
Despite longer-term flow recently observing a rejection off support at 0.9447, buyers displayed limited enthusiasm last week.
Should buyers regain consciousness this week, we could see price stage an approach to the 2020 yearly opening level at 0.9671, stationed close by the 2018 yearly opening level at 0.9732.
Daily perspective:
The break of weekly support at 0.9447 threw breakout sellers into a bear trap as daily buyers vigorously defended AB=CD structure (black arrows) at 0.9395. The initial upside target out of the daily AB=CD pattern, traditionally speaking, can be found at the 38.2% Fibonacci retracement ratio at 0.9580 (derived from legs A-D), positioned above resistance at 0.9542.
It is also possible, according to traditional measures, the next AB=CD target might be met at 0.9705, the 61.8% Fibonacci retracement, also taken from legs A-D. This implies a push above trend line resistance, taken from the high 0.9901.
H4 perspective:
Following a short-lived dip through 0.95 to lows at 0.9487 heading into US hours Friday, enough to trip stops, broad USD buying lifted USD/CHF back above 0.95.
Technically speaking, the tables could turn around 0.9550ish this week. Current action meets the characteristics of a potential AB=CD bearish pattern (black arrows) at 0.9547. Also notable here is daily resistance at 0.9542, a 61.8% H4 Fibonacci retracement ratio at 0.9545, a 127.2% Fibonacci extension at 0.9547 and a 161.8% Fibonacci extension at 0.9551.
Areas of consideration:
In view of the AB=CD/Fib H4 confluence circling daily resistance at 0.9542, a reversal from this neighbourhood is in the offing this week. Buyers north of 0.95, therefore, may want to factor this into trade management.
Despite H4 exhibiting strong confluence around daily resistance, longer term, according to the AB=CD daily take-profit projections, suggests we may eventually head above the noted daily resistance (0.9542) for 0.9580ish. With this being the case, intraday bullish scenarios above daily resistance, in the event we take the level, could also be something to watch for this week.
Dow Jones Industrial Average:
Weekly gain/loss: +0.36%
Weekly close: 25645
Weekly perspective:
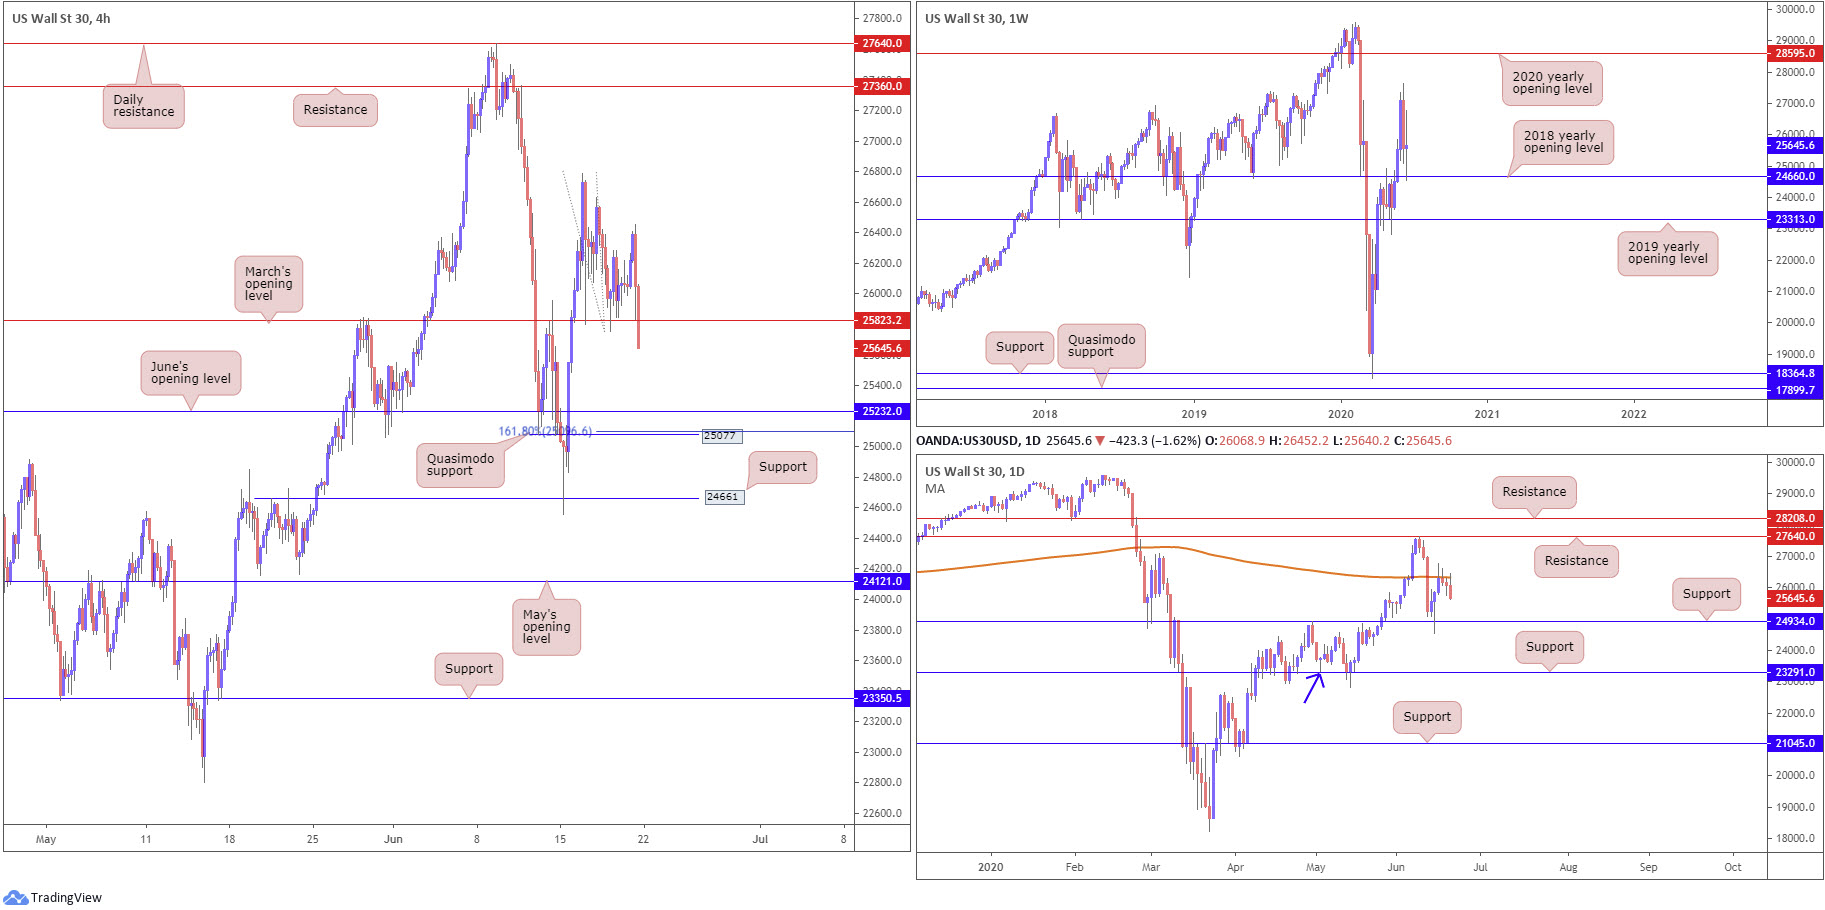
The 2018 yearly opening level at 24660 elbowed its way into the spotlight last week, establishing reasonably firm support. Despite a nudge to highs at 26787, the week wrapped up in the shape of a long-legged doji candlestick pattern, stressing indecision.
Should buyers move into a higher gear this week, the 27638 high, followed by the 2020 yearly opening level at 28595, are visible objectives to work with. Below 24660, however, traders’ crosshairs may be fixed on the 2019 yearly opening level at 23313.
Daily perspective:
Mid-week shook hands with the underside of the 200-day SMA (orange – 26331), with Friday throwing across a bearish outside day formation. As a result of this, traders may push for a retest at support coming in from 24934 this week.
Turning higher and engulfing the aforementioned 200-day SMA points the spotlight at resistance coming in from 27640.
H4 perspective:
Risk assets suffered a knock Friday after Apple announced it will re-close some of its stores due to the rise in COVID-19 cases. The Dow Jones Industrial Average dipped 208.64 points, or 0.80%; the S&P 500 lost 17.32 points, or 0.56%, and the tech-heavy Nasdaq 100 concluded lower by 3.41 points, or 0.03%.
The recovery off March’s opening level at 25823 came to an abrupt halt Friday, aided on the back of SMA selling and recent developments surrounding COVID-19.
25823 now serves as potential resistance, with intraday eyes focused on June’s opening level at 25232, closely shadowed by Quasimodo support at 25077 and a 161.8% Fibonacci extension point at 25096.
Areas of consideration:
The H4 close below 25823 has likely sparked seller interest, with some traders possibly willing to enter short at current price; others may want at least a retest at 25823 to form before engaging.
Further selling this week could take things towards 25232 on the H4. This, combined with H4 Quasimodo support at 25077, the 161.8% Fibonacci extension point at 25096 and daily support at 24934, not only sends across an ideal take-profit target for shorts under 25823, it also provides a stage to consider bullish themes from.
XAU/USD (GOLD):
Weekly gain/loss: +0.78%
Weekly close: 1743.1
Weekly perspective:
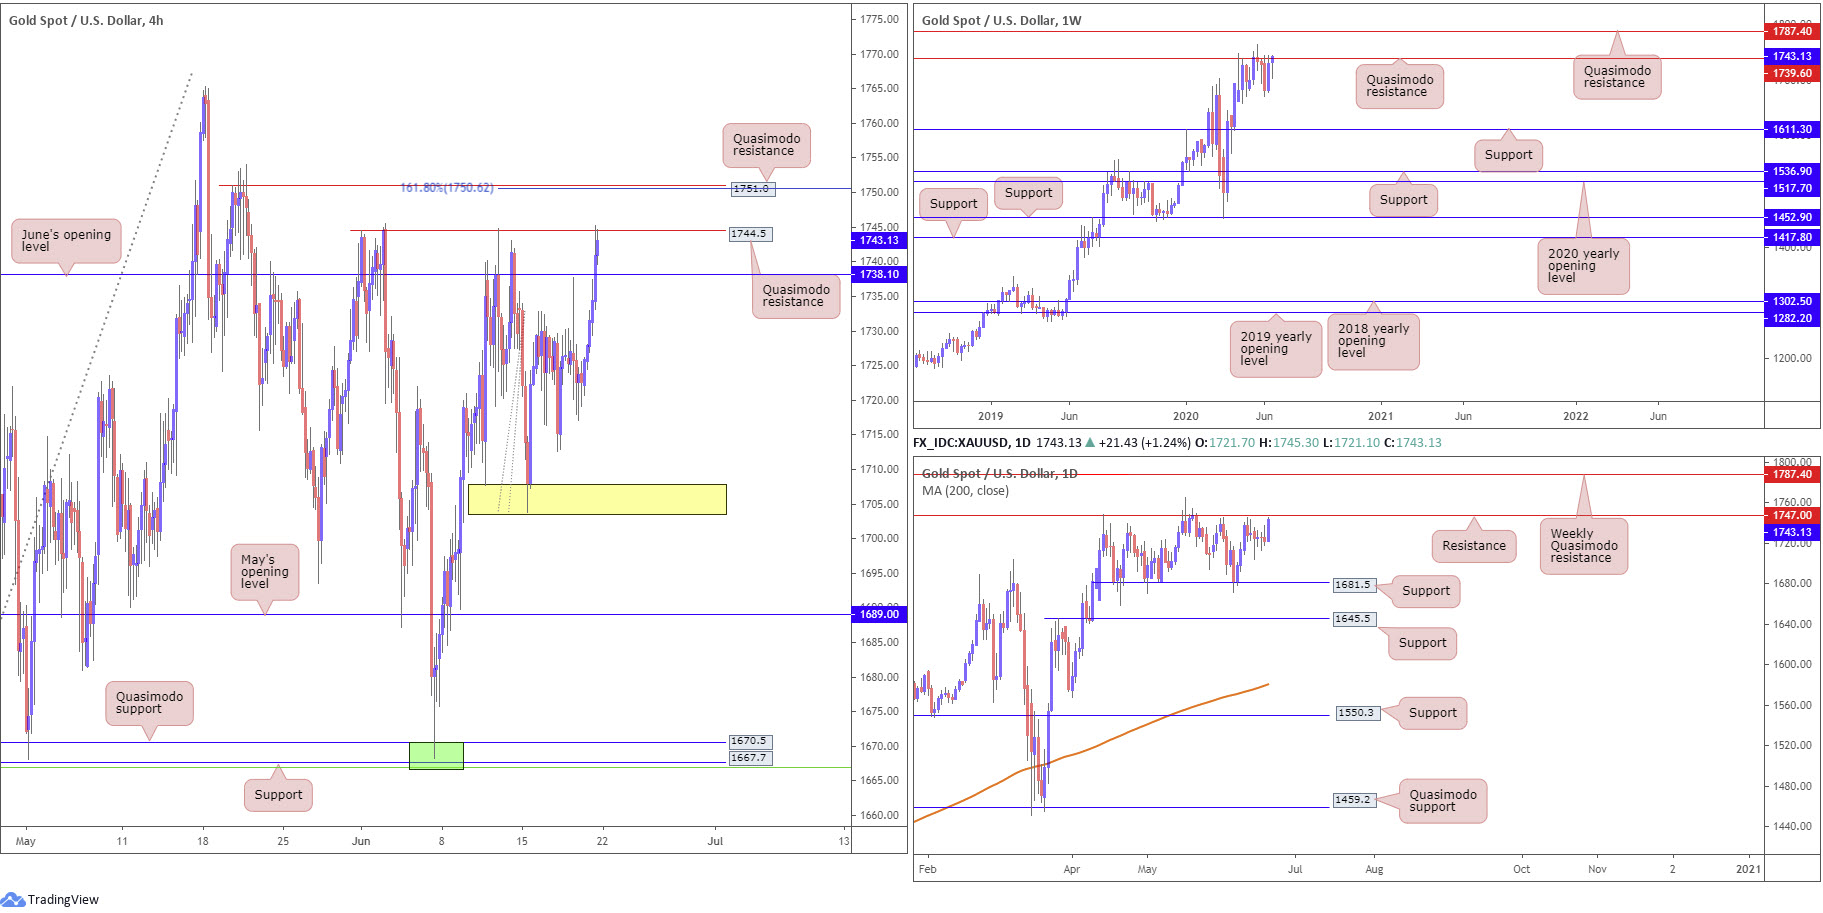
Price movement on the weekly timeframe has had buyers and sellers fighting for position below Quasimodo resistance at 1739.6 since mid-April.
A decisive turn lower from current price moves support at 1611.3 into view, whereas moves higher, in line with the long-term uptrend, sets up a run to Quasimodo resistance at 1787.4.
Daily perspective:
Weekly price hugging the underside of Quasimodo resistance at 1739.6 has helped daily price establish a range between resistance at 1747.0 and support pencilled in at 1681.5. A breakout to the downside shines focus on support at 1645.5; turning higher, however, highlights the weekly Quasimodo resistance mentioned above at 1787.4.
As of current price, thanks to Friday’s near-full-bodied bullish candle, we are testing the upper limits of the current range.
H4 perspective:
Demand for bullion increased Friday, as price found acceptance above June’s opening level at 1738.1 which led to an approach to Quasimodo resistance at 1744.5. A break of here has another Quasimodo formation to target at 1751.0, which comes together with a 161.8% Fibonacci extension from 1750.6.
Areas of consideration:
Although the uptrend has faced north since 2016, all the while weekly Quasimodo resistance remains intact this will likely deter prospective buyers.
A possible setup this week on the H4 timeframe is a pop above Quasimodo resistance at 1744.5 for shorts off fresh Quasimodo resistance at 1751.0, converging with a 161.8% Fibonacci extension from 1750.6. Breaking 1744.5 not only trip stops (potentially providing liquidity to sell into), the move also draws in any sellers from daily resistance at 1747.0.
The accuracy, completeness and timeliness of the information contained on this site cannot be guaranteed. IC Markets does not warranty, guarantee or make any representations, or assume any liability regarding financial results based on the use of the information in the site.
News, views, opinions, recommendations and other information obtained from sources outside of www.icmarkets.com.au, used in this site are believed to be reliable, but we cannot guarantee their accuracy or completeness. All such information is subject to change at any time without notice. IC Markets assumes no responsibility for the content of any linked site.
The fact that such links may exist does not indicate approval or endorsement of any material contained on any linked site. IC Markets is not liable for any harm caused by the transmission, through accessing the services or information on this site, of a computer virus, or other computer code or programming device that might be used to access, delete, damage, disable, disrupt or otherwise impede in any manner, the operation of the site or of any user’s software, hardware, data or property.


