
EUR/USD:
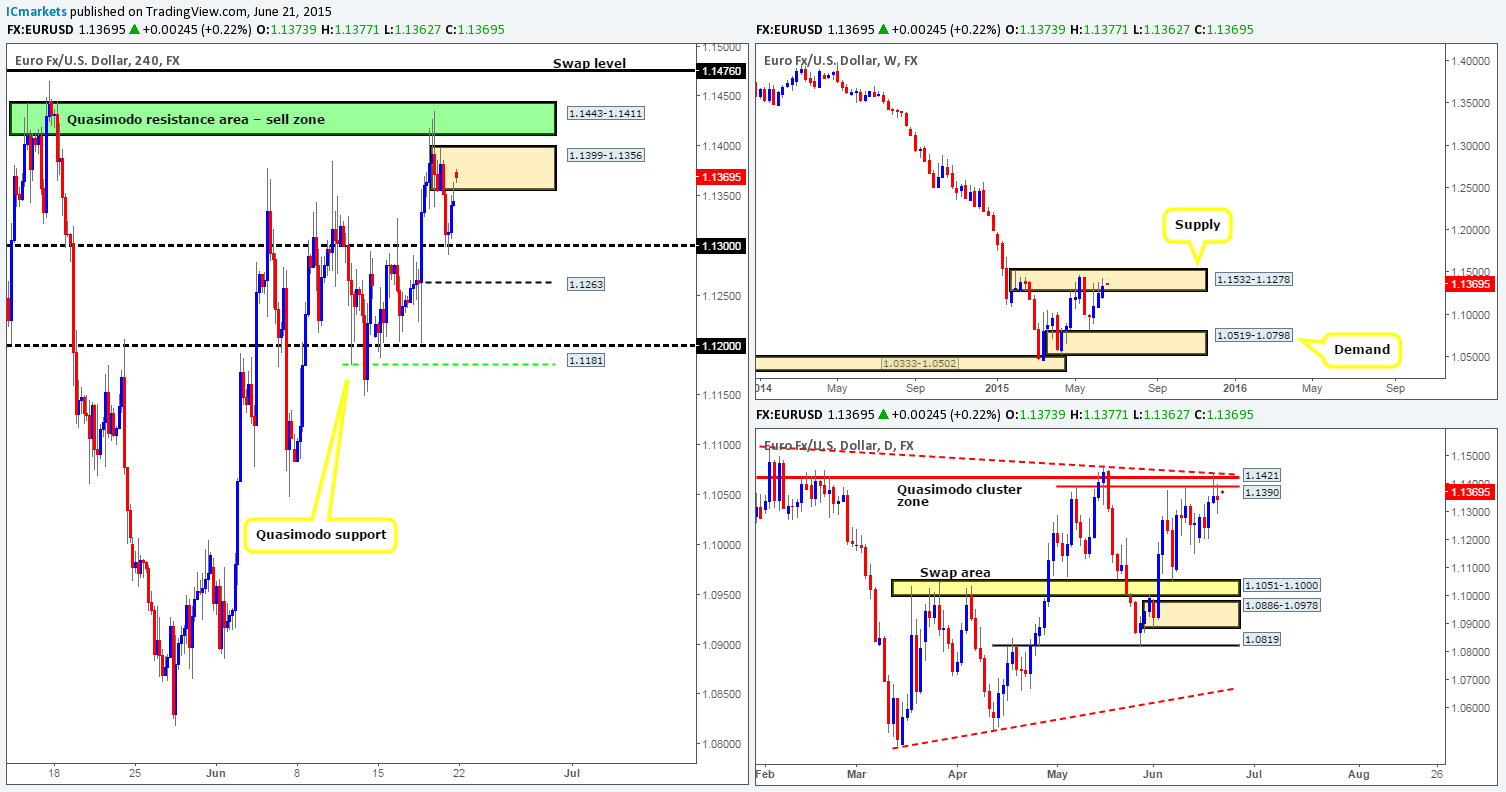
Weekly view: The EUR/USD enjoyed another relatively positive week last week, gaining about 84 pips into the close 1.1345. However, despite this recent advance, price is now lingering within a weekly supply area at 1.1532-1.1278, thus we have to be prepared for possibility that active sellers may come into the market this week. This supply zone is a very significant hurdle in our opinion (held price lower since the 11th May) since if there’s a sustained break above this area, our long-term bias (currently short) on this pair will very likely shift north.
Daily view: The pin-bar rejection seen on Thursday from the daily Quasimodo cluster zone at 1.1390/1.1421 (located relatively deep within the aforementioned weekly supply area) saw little follow-through going into Friday’s session. In fact, both sides of the market appeared indecisive, consequently closing out the week printing a daily indecision candle.
4hr view: During Friday’s sessions, we can see that 1.1300 held as support which as a result saw price test a newly formed 4hr supply at 1.1399-1.1356 into the close (located around the aforementioned the daily Quasimodo cluster zone).
The open 1.1373, however, saw price gap north 28 pips, consequently forcing price higher into the aforementioned 4hr supply area. Despite this, we still believe that this market is in a fantastic position (see higher timeframes) to continue selling off today/this week. However, today may be a bit tricky as the market will likely be awaiting the outcome of the Euro summit as to whether an agreement can finally be reached regarding Greece. With that in mind, our team has decided we’re going to WATCH the following zones for potential SELL opportunities:
- Current 4hr supply area coming in at 1.1399-1.1356.
- The 4hr Quasimodo resistance base seen in green at 1.1443-1.1411.
- 4hr swap level seen at 1.1476.
Our team does not intend to set any pending sell orders at any of the aforementioned areas, we’re patiently going to see what the lower timeframe price action tells us – we’ve found it is always best to wait for lower timeframe confirming price action when unsure.
Levels to watch/live orders:
- Buys: Flat (Stop loss: N/A).
- Sells: 1.1399-1.1356 [Tentative – confirmation required] (Stop loss: 1.1404) 1.1443-1.1411 [Tentative – confirmation required] (Stop loss: dependent on where one confirms this area, but would likely be around the 1.1469 mark) 1.1476 [Tentative – confirmation required] (Stop loss: dependent on where one confirms this level).
GBP/USD:
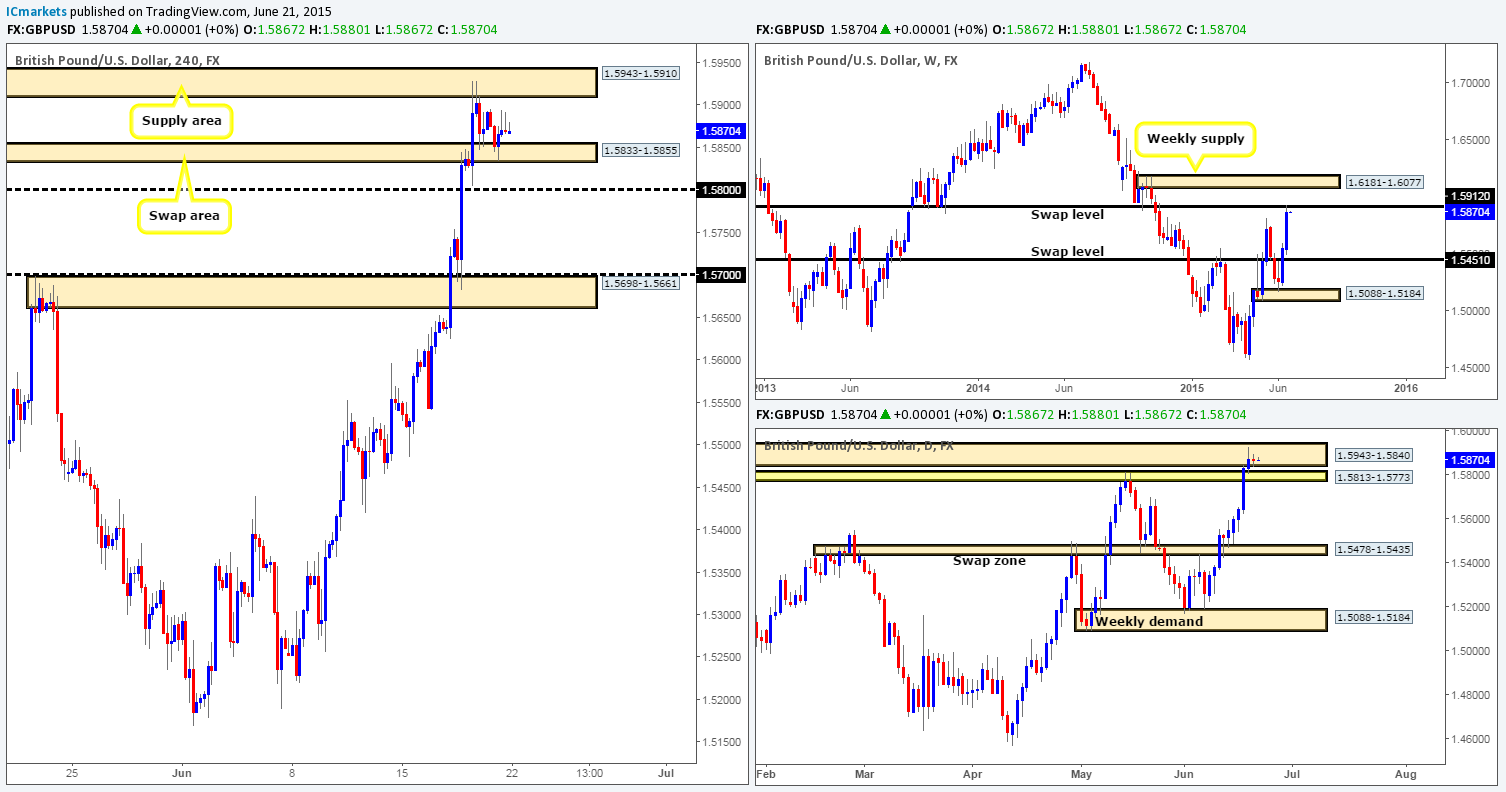
Weekly view – The GBP/USD had another absolutely spectacular week, gaining a little over 320 pips into the close 1.5870. This advance, however, forced price into the jaws of a very significant weekly swap level coming in at 1.5912. Therefore, we may see this market correct itself this week.
Daily view: From this viewpoint, we can see that the upward momentum begun to diminish later on in the week, as price shook hands with a clear daily supply area at 1.5943-1.5840 (encapsulates the aforementioned weekly swap level). Nonetheless, just below this zone sits potential support in the form of a daily swap zone at 1.5813-1.5773. If we can get below here this week, the market may reverse direction. It will be interesting to see what the 4hr timeframe has to say…
4hr view: Following Thursday’s rebound from the 4hr supply area at 1.5943-1.5910 (located deep within the daily supply area mentioned above at 1.5943-1.5840); Friday’s sessions saw the GBP extend lower driving price deeper into the near-term 4hr swap area at 1.5833-1.5855, which as you can see held this market higher going into the close.
Going forward, there were clearly no big changes over the weekend as the market opened a mere three pips lower than Friday’s close at 1.5867.
Technically, both the weekly and daily timeframes are showing price positioned around resistive structures (see above), so we’re naturally favoring shorts over longs at the moment. But as things stand, there is still potential buy-side liquidity lurking just below on this timeframe – the aforementioned 4hr swap area and the round number 1.5800. Until these barriers have been taken out, it would be very difficult to justify selling this market no matter what the higher timeframes are telling us. With that being said though, we still have our eye on the 4hr supply area at 1.5943-1.5910 for a possible short trade. However, we would need to see very, very attractive lower timeframe confirming price action to convince us to commit capital here.
Levels to watch/ live orders:
- Buys: Flat (Stop loss: N/A).
- Sells: 1.5943-1.5910 [Tentative – confirmation required] (Stop loss: 1.5949).
AUD/USD:
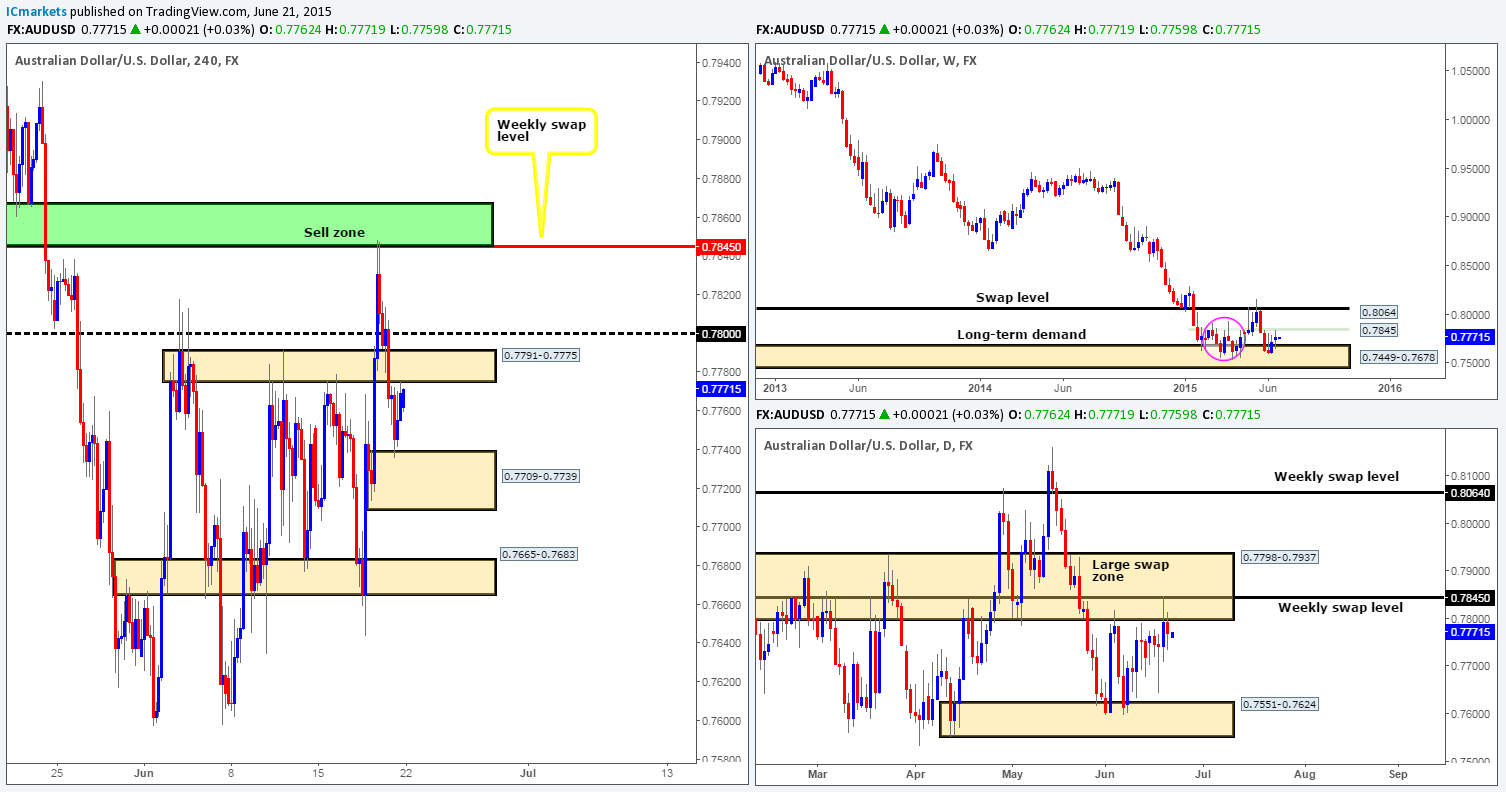
Weekly view – Following the rebound seen from the long-term weekly demand area at 0.7449-0.7678, price connected with a minor weekly swap level coming in at 0.7845 last week, consequently forming a weekly indecision candle going into the close 0.7769. Judging by the sloppy reaction seen (pink circle – 02/02/15-06/04/15) between these two aforementioned weekly areas a few months ago, things could potentially get messy here again before we see any decisive move take place. From a long-term perspective, nonetheless, the trend direction on this pair is still very much south in our opinion, and will remain this way until we see a convincing break above 0.8064.
Daily view: (Slightly revised) From the pits of the daily scale, it appears that price has begun to chisel out a consolidation zone between 0.7798-0.7937 – a large daily swap zone (surrounds the aforementioned weekly swap level), and 0.7551-0.7624 – a daily demand area (located within the aforementioned weekly demand area). With price now seen loitering around the upper limits of this potential range, entering long in this market may not be the best path to take.
4hr view: Early on in Friday’s sessions, price sold off from the round number 0.7800 and connected beautifully with a 4hr demand area at 0.7709-0.7739, which, as you can see, held firm allowing longs to push price up to retest a 4hr swap area at 0.7791-0.7775 into the close.
For those who read Friday’s report on the Aussie, you may recall that our team took a short trade on Thursday from 0.7842. We took 70% of our position off at the aforementioned 4hr demand area on Friday, and our stop is now set at breakeven plus five. Essentially, we do believe this market will continue driving south this week due to where price is trading on the higher timeframe picture (see above). As such, we’re going to be keeping a close eye on the following areas for potential (lower timeframe) confirmed shorting opportunities today and possibly into the week:
- 4hr swap area at 0.7791-0.7775.
- Round-number region 0.7800.
- 4hr sell zone in green at 0.7867/0.7845 (essentially the minor weekly swap level) for a possible retest.
Levels to watch/ live orders:
- Buys: Flat (Stop loss: N/A).
- Sells: 0.7842 [Live] (Stop loss: 0.7875) 0.7791-0.7775 [Tentative – confirmation required] (Stop loss: 0.7793) 0.7800 [Tentative – confirmation required] (Stop loss: dependent on where one confirms this level) 0.7867/0.7845 [Tentative – confirmation required] (Stop loss: 0.7870).
USD/JPY:
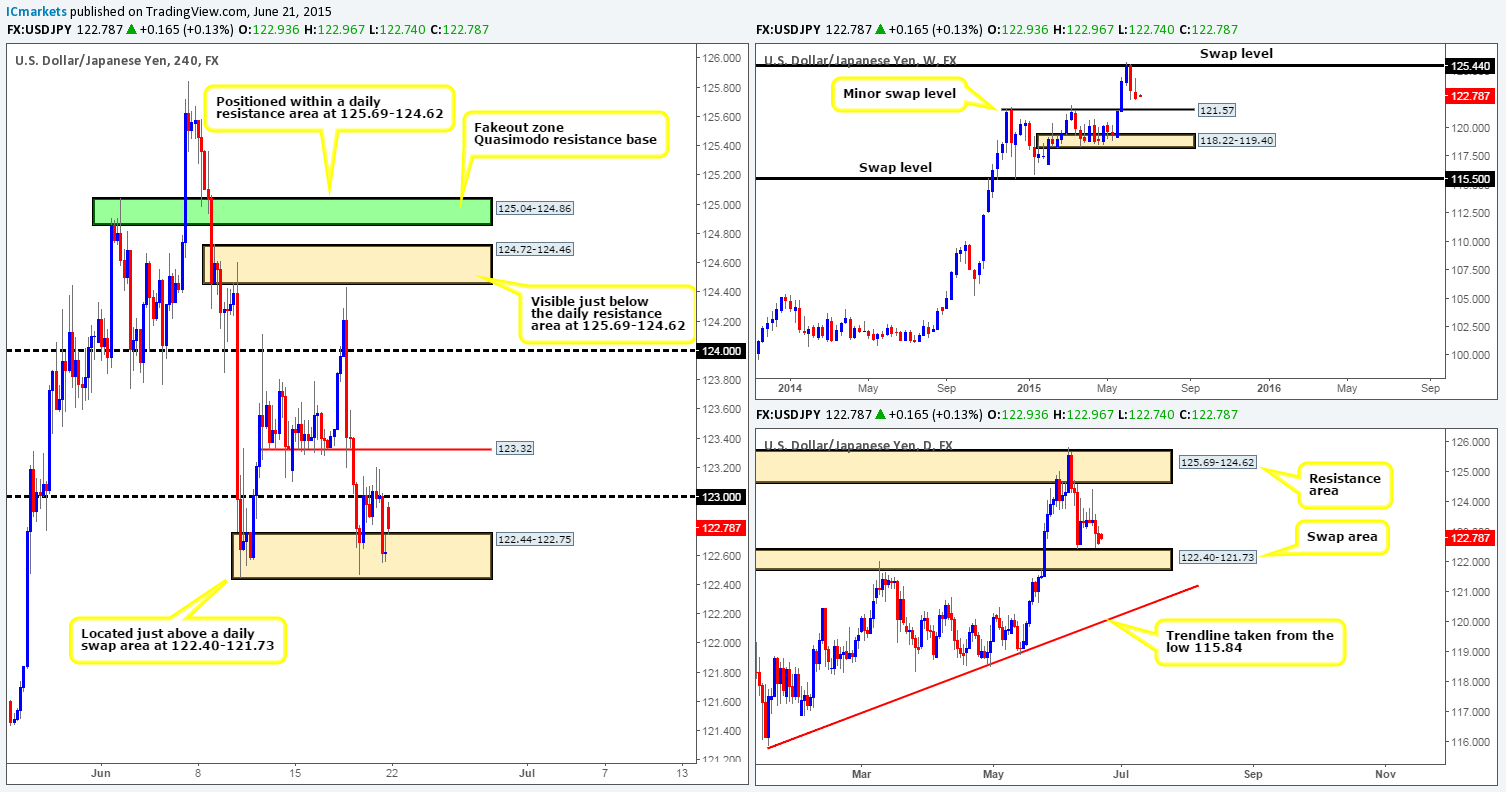
Weekly view – Following the rebound seen from the weekly swap level at 125.44, price extended lower last week, losing about 70 pips into the close 122.62. On the assumption that the sellers can continue holding this market lower this week, we believe there’s a very good chance that price will greet the minor weekly swap level seen at 121.57. Despite this recent decline in value, however, the long-term uptrend on this pair is still very much intact, and will remain that way in our opinion until the weekly swap level 115.50 is consumed.
Daily view: The daily timeframe shows that price came very close to connecting with a daily swap area at 122.40-121.73 towards the end of last week (price found mild support just above this zone at the previous weekly low 122.44), which, if you look back to weekly chart, you’ll see is effectively a key obstacle to a move towards the aforementioned minor weekly swap level positioned just below it.
4hr view: After price shook hands with the round number 123.00 on Friday, a clear battle between the buyers and sellers took place. It was only as we entered into the afternoon U.S session did we see price aggressively sell off into the 4hr demand area at 122.44-122.75 (located just above the aforementioned daily swap area).
Today’s opening number 122.93 saw this market gap north 31 pips from the aforementioned 4hr demand area, just missing the round number 123.00 by seven pips. At the time of writing this weekend gap is being filled, thus pushing price back down to 4hr demand.
With all of the above taken into consideration, where do we see this market moving today and possibly into the week? Well, the weekly chart indicates there is room for price to continue selling off, while the daily chart shows price is only a few pips away from shaking hands with a daily swap area (see above), so where does this leave us on the 4hr timeframe? From the buy side, we do not see any opportunity whatsoever. Even if price breaks above 123.00, the next objective to reach from here is only a mere thirty pips (123.32). A break below the current 4hr demand area, however, would be interesting. We say this simply because there is space below this area for price to move on the 4hr timeframe. The problem shorting on the break/retest here would of course be the fact that price would then be trading within the aforementioned daily swap zone. But with the weekly timeframe by our side so to speak (remember there is room to move south), we would likely consider a short on the break of the current 4hr demand area, as long as a confirmed retest of this zone was seen.
Levels to watch/ live orders:
- Buys: Flat (Stop loss: N/A).
- Sells: Flat (Stop loss: N/A).
USD/CAD:
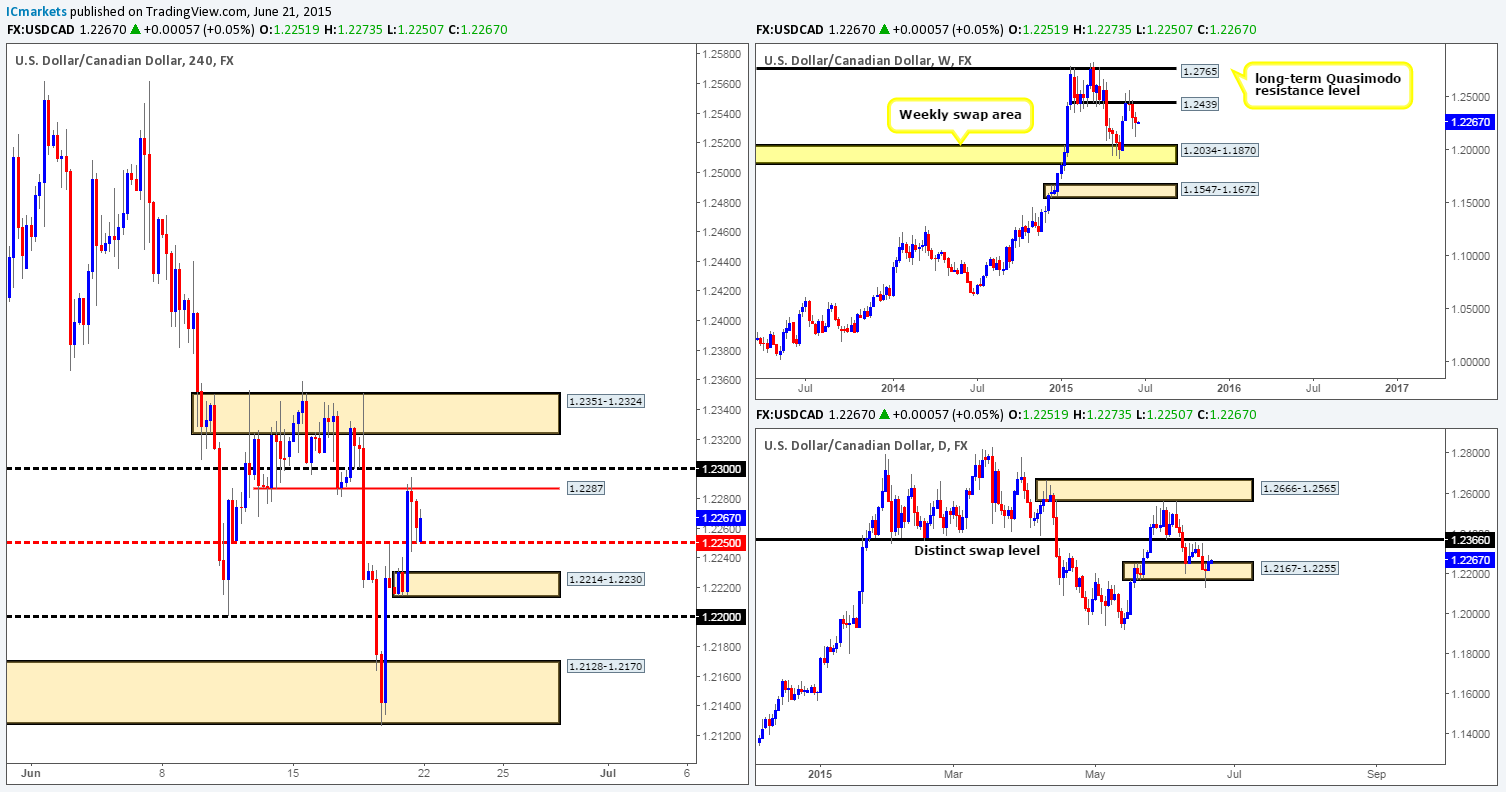
Weekly view – The USD/CAD pair met renewed buying interest last week around the 1.2126 mark, consequently causing a beautiful looking buying tail to form going into the close 1.2261. However, it is difficult to tell from this timeframe why support came in at 1.2126 last week, but what we can see is there is STILL room for price to move south down to the weekly swap area at 1.2034-1.1870. With that being said, our long-term bias on this pair remains long, and it will only be once/if we see a break below the aforementioned weekly swap area at would our present bias likely shift.
Daily view: Thursday’s spike below the daily demand area at 1.2167-1.2255 clearly attracted further buying into the market on Friday. Nonetheless, we have to keep in mind that this could have simply been traders covering shorts towards the end of the week. As such, we’ll only be convinced that price is heading higher from this region once/if we see a clean break above the near-term daily swap level at 1.2366.
4hr view: Throughout the course of Friday’s sessions, we can see that price aggressively broke above the mid-level number 1.2250, and connected with a minor 4hr swap level coming in at 1.2287. The sell off seen from this hurdle was likely caused by traders covering long positions, which as a consequence saw price retest the mid-level number 1.2250 into the close.
The open 1.2251 saw price gap down 10 pips to the aforementioned mid-level hurdle, which at the time of writing has so far attracted buyers into the market.
According to our analysis, mixed vibes are currently being seen from the higher timeframes (see above in bold), making it quite difficult to judge direction at this time. Therefore, until we see more conducive price action on the higher timeframes, we’re going to stick with short-term intraday trades on this pair for the time being:
For longs, we’re currently watching the following areas:
- Mid-level number 1.2250.
- 4hr demand at 1.2214-1.2230.
- Round number 1.2200.
- 4hr demand at 1.2128-1.2170.
For shorts, we’re currently watching the following areas:
- 4hr swap level at 1.2287.
- Round number 1.2300.
- 4hr resistance base at 1.2351-1.2324.
Just to be clear here guys, we have no intention in placing any pending orders at the above zones; we would need to see confirming price action from the lower timeframes before committing capital to a trade.
Levels to watch/ live orders:
- Buys: 1.2250 [Tentative – confirmation required] (Stop loss: dependent on where one confirms this level) 1.2214-1.2230 [Tentative – confirmation required] (Stop loss: 1.2211) 1.2200 [Tentative – confirmation required] (Stop loss: dependent on where one confirms this level) 1.2128-1.2170 [Tentative – confirmation required] (Stop loss: 1.2121).
- Sells: 1.2287 [Tentative – confirmation required] (Stop loss: dependent on where one confirms this level) 1.2300 [Tentative – confirmation required] (Stop loss: dependent on where one confirms this level) 1.2351-1.2324 [Tentative – confirmation required] (Stop loss: 1.2363).
USD/CHF:
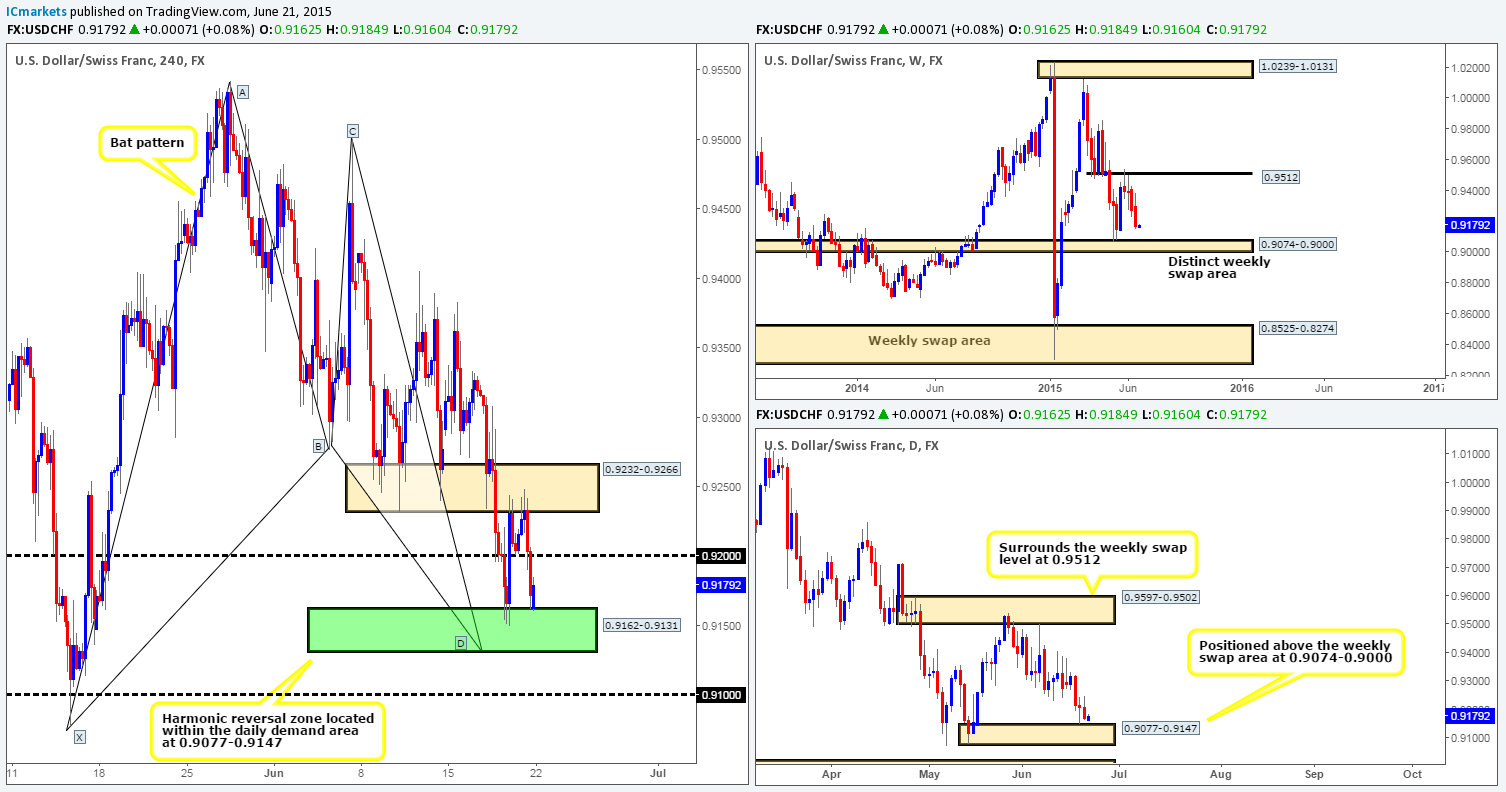
Weekly view – The USD/CHF suffered further losses again this week, losing a little over 100 pips into the close 0.9172. Provided that the sellers can continue with this tempo this week, it is likely we’ll see price shake hands with the weekly swap area at 0.9074-0.9000.
Daily view: From this viewpoint, it is clear to see that during both Thursday and Friday’s sessions, the buyers and sellers spent much of their time battling for position around the upper limit of a daily demand area at 0.9077-0.9147 (located just above the weekly swap area at 0.9074-0.9000). In order for the weekly sellers to reach the upper limits of the aforementioned weekly swap area, a break below this daily demand zone would be required.
4hr view: Price continued to sell off going into Friday’s sessions, which as you can see, took out 0.9200 and retested the 4hr Harmonic Bat reversal zone seen in green at 0.9162-0.9131 (located just within the aforementioned daily demand area). The open 0.9162, however, has seen ‘early-bird’ buyers come into the market from this 4hr Harmonic support zone, which may tempt further buying going into the more liquid sessions today. However, given the mixed vibes we’re seeing from the higher timeframes (see above in bold) at the moment, it is quite difficult to judge long-term direction. Therefore, for anyone considering trading the retest of the current 4hr Harmonic support today, we would strongly recommend waiting for some sort of confirming signal before doing so, because price could just as easily wipe this area out today and continue south this week.
As we are still currently short the AUD, we would not be comfortable buying the USD here, so we’ll let any opportunity here slide for the time being until our Aussie trade is resolved.
Levels to watch/ live orders:
- Buys: Flat (Stop loss: N/A).
- Sells: Flat (Stop loss: N/A).
US 30:
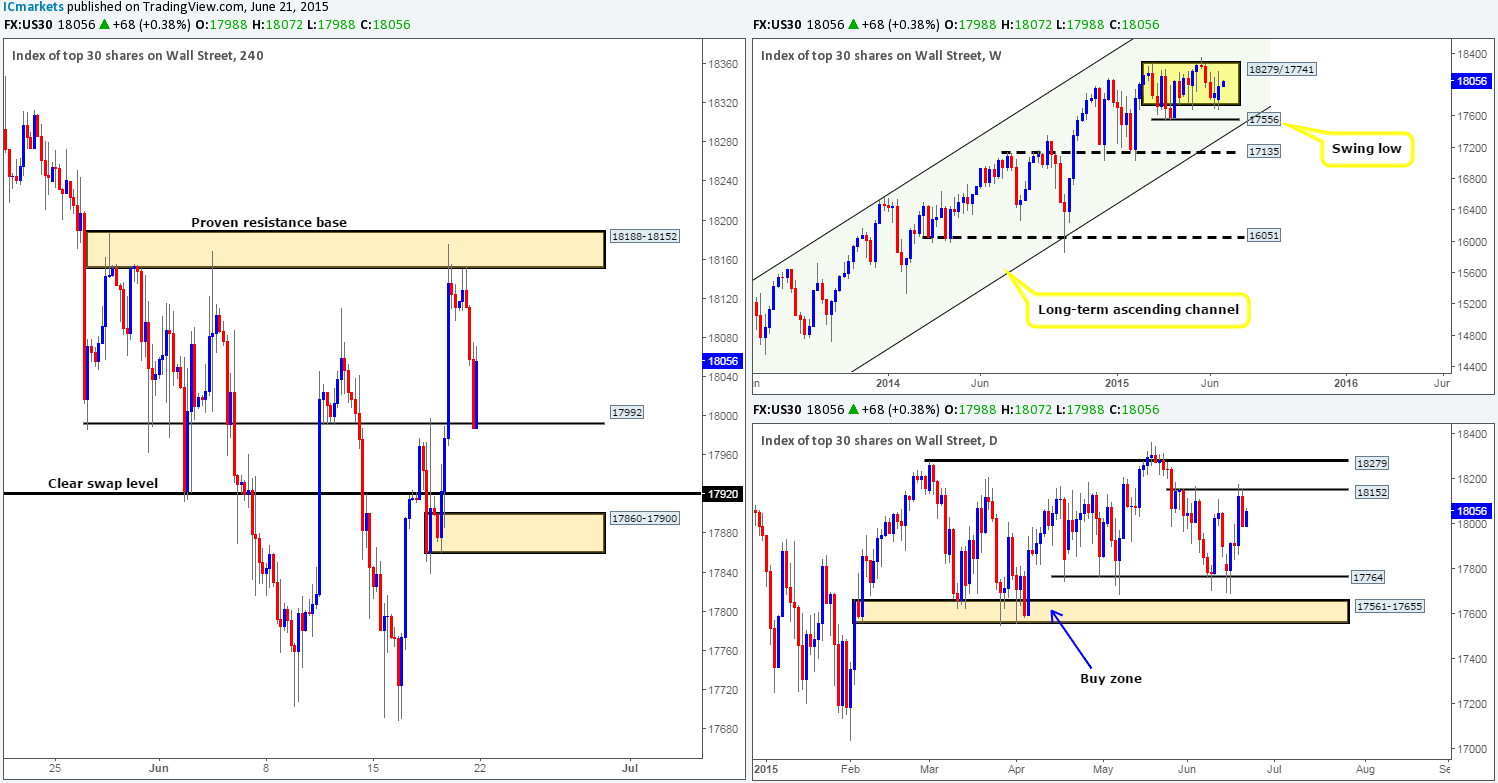
Weekly view – Last week’s action saw renewed buying interest come in from around the 17688 mark forcing price to close at 17988. This has, at least for us anyway, confirmed that price is trading within a small range (seen in yellow) between 18279/17741. From a longer-term perspective, however, the overall uptrend on this index is still very strong, and will remain this way in our opinion until we see a convincing push below 16051.
Daily view: From this viewpoint, we can see that price rebounded from a minor daily resistance level at 18152 into Friday’s close. Assuming that the sellers remain strong this week, it is possible that the market may challenge the 17764 region once again.
4hr view: Friday’s descent saw the DOW aggressively sell off from a proven 4hr resistance base at 18188-18152 (essentially the same as our aforementioned daily resistance level), which forced the market south to test 17992 into the close.
Price remained unaffected during the weekend as price opened at exactly the same price as Friday’s close – 17988. 17988 was clearly of interest to buyers at the open since price was forcefully pushed higher from here. We feel there is a good chance that the market will continue to rally today at least until the aforementioned 4hr resistance base (could be an area to look for confirmed shorts), due to there being very little resistance seen until this area. Therefore, unless there’s any lower timeframe entries long from current price i.e. a break and retest of a lower timeframe level, we do not see any trading opportunities on this index at the moment.
Levels to watch/ live orders:
- Buys: Flat (Stop loss: N/A).
- Sells: Flat (Stop loss: N/A).
XAU/USD (Gold)
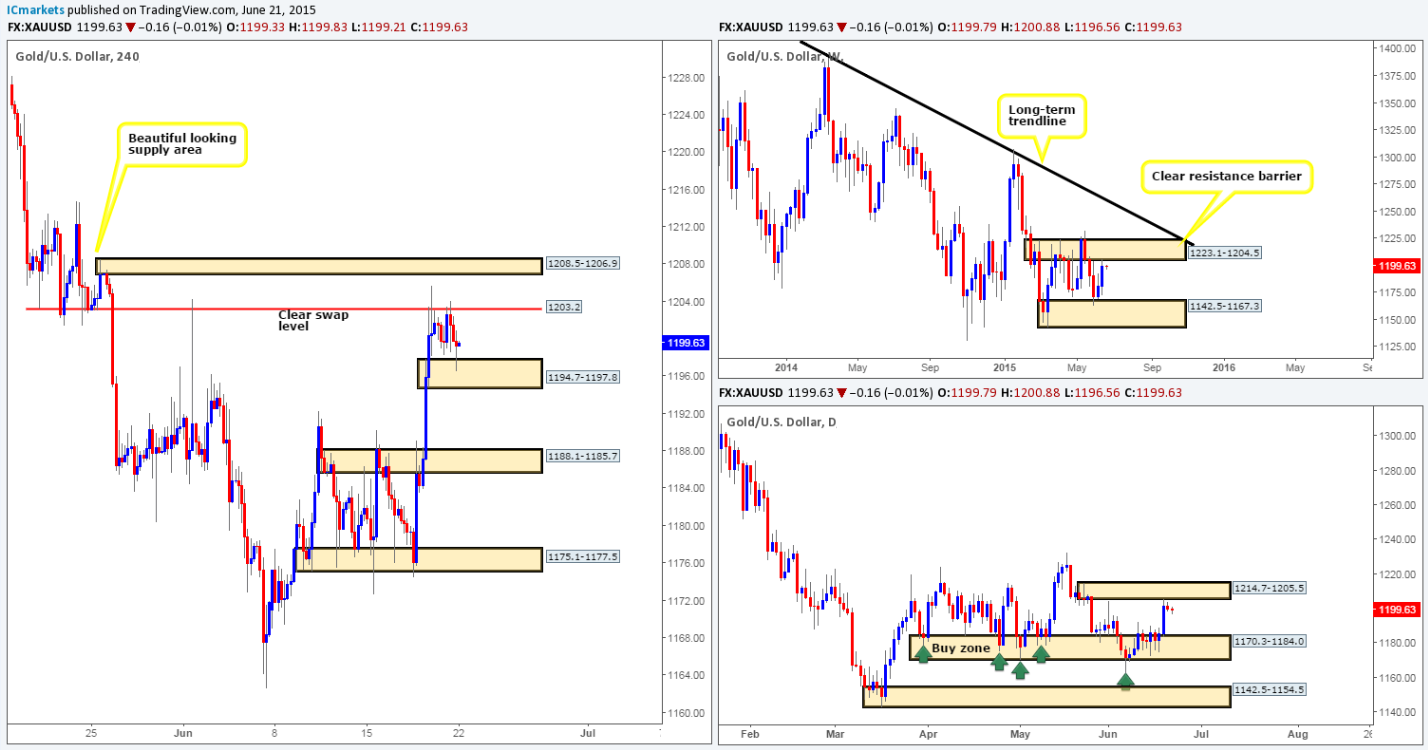
Weekly view – The gold markets gained about 1850 pips on the week, closing at 1199.7. This move consequently pushed price up to weekly supply at 1223.1-1204.5, and has effectively confirmed (at least for us anyway) that gold has now entered into a phase of consolidation between this weekly supply zone and weekly demand at 1142.5-1167.3. From a long-term perspective, however, gold is still trending south in our opinion. It will only be once/if we see a close above the weekly trendline extended from the high 1488.0 would we begin to feel that this market may be reversing.
Daily view: Thursday’s advance saw gold connect with a daily supply area at 1214.7-1205.5 (located within the aforementioned weekly supply area), which as you can see, saw very little interest from the sell side of this market going into Friday. Should the sellers gain consciousness this week, we might (considering the location of this area on the weekly timeframe) see a decline in value back down towards the daily buy zone seen at 1170.3-1184.0.
4hr view: Friday’s action saw price respect the 4hr swap level 1203.2, which (around the open 1199.7) forced the market to test the near-term 4hr demand area at 1194.7-1197.8. Price is now effectively trapped in between these two structures, and until a breakout is seen, our team will not likely be trading this market.
Considering the market’s overall position on the higher timeframes at the moment (see above in bold), it is more likely we’ll see a breakout south – check out the free space below the current 4hr demand area, it is indeed a beautiful sight. Nevertheless, before a breakout south is seen, we may see a fakeout north to tie in with the small 4hr supply area seen at 1208.5-1206.9 (located within the aforementioned daily supply area), which is potentially tradable if one is patient enough to wait for lower timeframe confirmation.
So, to sum up, a break below current 4hr demand, would, in effect, be our cue to begin looking for short entries into this market – a retest of this area with (lower timeframe confirmation) as supply would be fantastic! If price should breakout and connect with the 4hr supply area at 1208.5-1206.9, however, we would also consider shorts as long as corresponding lower timeframe confirmation was also present. We would also advise constant monitoring of any trade taken from this zone at least until 1194.7-1197.8 is consumed.
Levels to watch/ live orders:
- Buys: Flat (Stop loss: N/A).
- Sells: Flat (Stop loss: N/A).


