
Key risk events today:
BoJ Gov. Kuroda Speaks; RBA Assist Gov. Kent Speaks.
EUR/USD:
Weekly gain/loss: -0.44%
Weekly close: 1.1220
Weekly perspective:
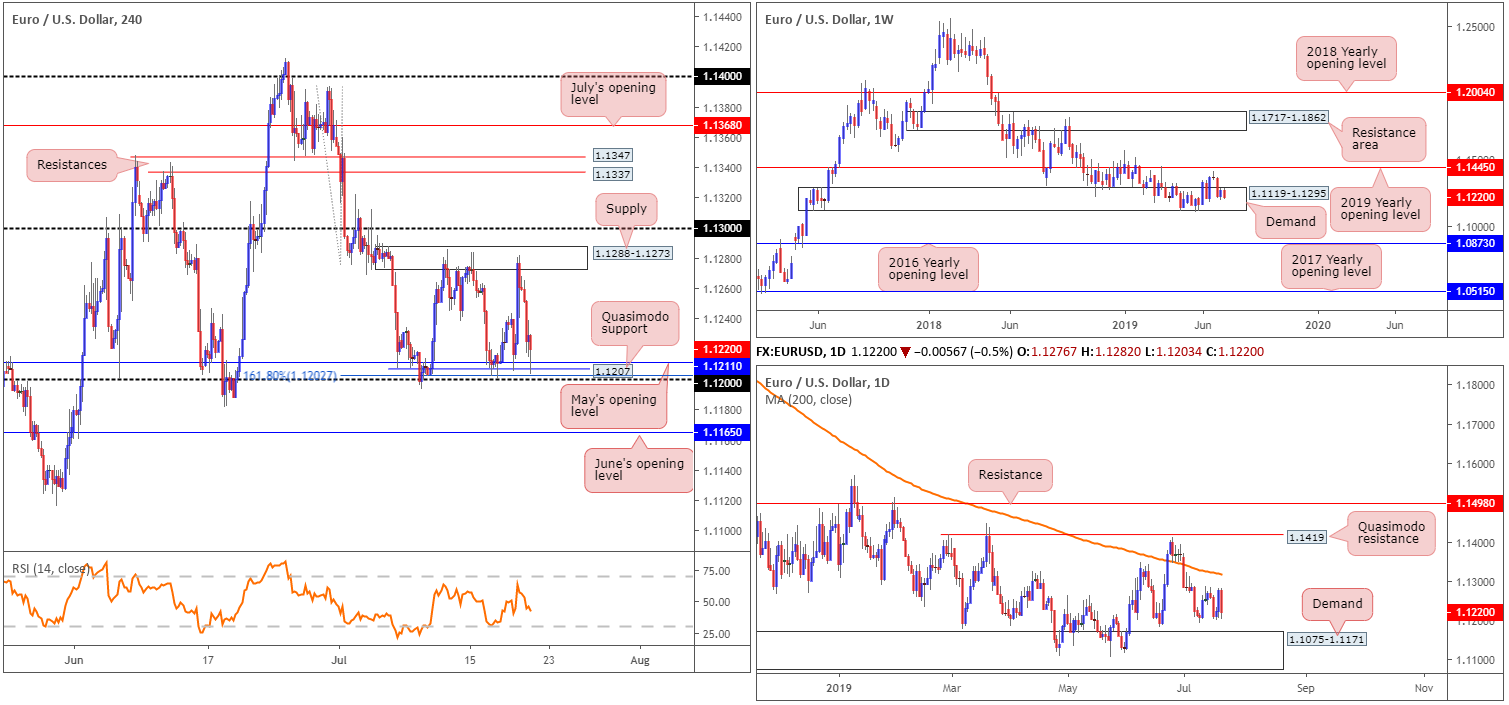
Since November 2018, the weekly candles have been warring for position between long-standing demand at 1.1119-1.1295 and the 2019 yearly opening level (resistance) at 1.1445. Areas outside of the said barriers to be aware of fall in around the 2016 yearly opening level at 1.0873 (support) and a resistance area drawn from 1.1717-1.1862.
As of the week’s close, price action concluded deeper within the limits of the said demand area, further weakening the chances of a bullish move and erasing all of the prior week’s gains.
Daily perspective:
According to the daily timeframe, the EUR/USD represents a ranging phase. Despite this, the research team’s structural analysis has resistance mounted just north of the range at the 200-day SMA (orange – 1.1318) and support seen lower on the curve by way of demand located at 1.1075-1.1171. It might also interest traders to note the demand is glued to the underside of the current weekly demand area.
H4 perspective:
Friday witnessed the US dollar unwind a portion of Thursday’s losses, which were largely influenced by Federal Reserve member William’s comments, stating it’s better to take preventative measures on rates than to wait for a disaster to unfold. Assisted initially after a NY Fed spokesperson walked back on Fed’s Williams earlier dovish remarks, the buck’s strength continued into the US session Friday after Fed sources diminished hopes of a 50bps cut. This sent the US dollar index back above the 97.00 mark into the close.
Technically speaking on the EUR/USD’s H4 chart, the candles continue to carve out a 70-point range between 1.12 and supply at 1.1288-1.1273 since early July. As underlined in earlier reports, 1.12 brings with it a 161.8% Fibonacci ext. point at 1.1202, a Quasimodo support at 1.1207 and May’s opening level at 1.1211. It might also be worth noting the 1.13 handle positions itself just north of the current supply zone, and June’s opening level at 1.1165 – merges closely with the top edge of the current daily demand – is seen south of the said range.
Areas of consideration:
Having seen the H4 candles form a range between supply at 1.1288-1.1273 and the 1.12 handle, traders may find the range limits of use this week. Trading within this area is certainly possible due to its size, large enough to secure reasonable risk/reward. Protective stop-loss orders are generally located a couple of points beyond the range extreme, targeting the opposing range limit.
In the event the upper edge of the current range is taken out this week, selling opportunities exist between the 200-day SMA on the daily timeframe at 1.1318 and the 1.13 handle on the H4. Not only will sellers likely be active here, liquidity in the form of triggered buy stops above the current range edge will be a strong selling point for traders with deeper pockets. The same can be said for June’s opening level (given its connection to daily structure), only for buying opportunities.
GBP/USD:
Weekly gain/loss: -0.59%
Weekly close: 1.2497
Weekly perspective:
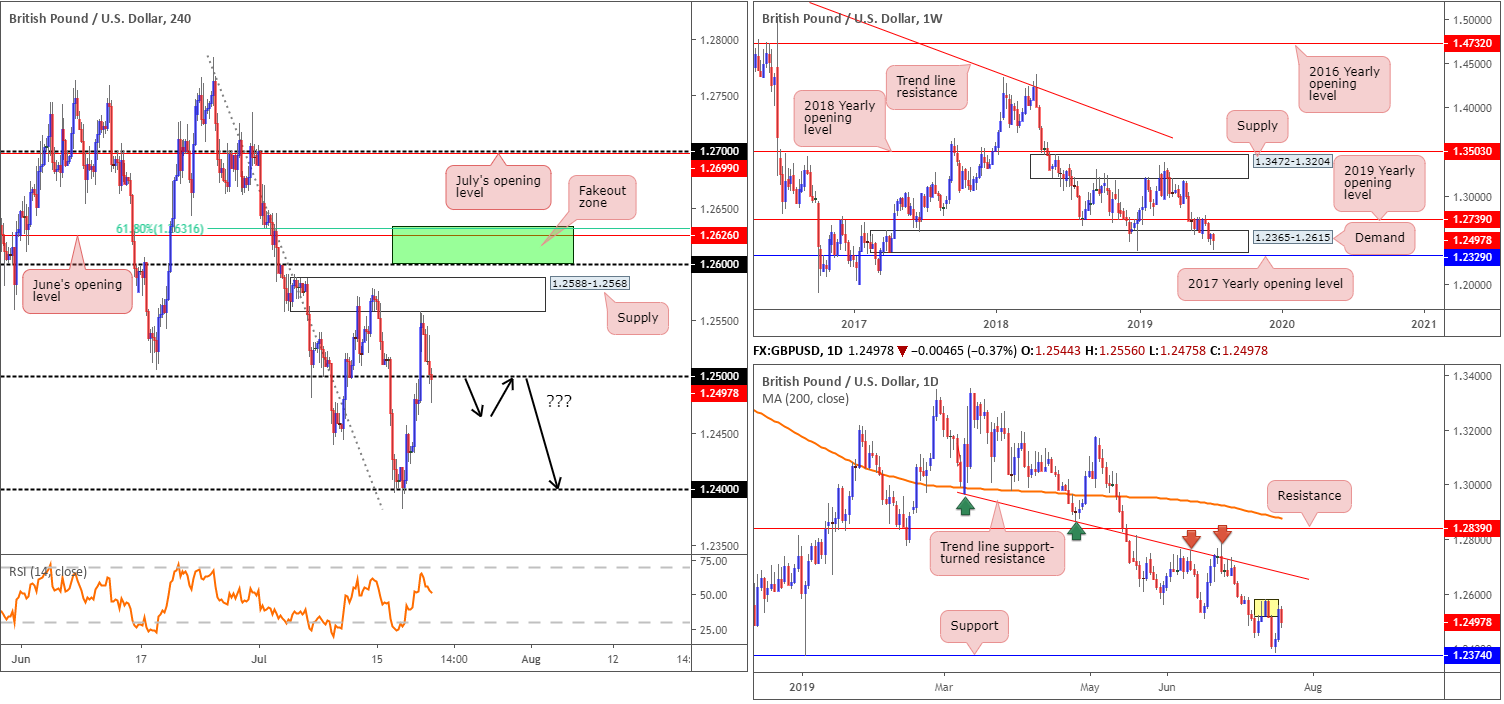
Since May 20, buyers and sellers have been battling for position between long-standing demand at 1.2365-1.2615 and the 2019 yearly opening level at 1.2739 (resistance). Despite recent movement drilling further into the said demand, price action chalked up a second consecutive buying tail last week, perhaps signifying buyer intent. Areas outside of the current range to be conscious of falls in around the 2017 yearly opening level at 1.2329 (support) and supply coming in at 1.3472-1.3204.
Daily perspective:
Leaving support at 1.2374 unchallenged Wednesday, increased demand for the British pound lifted the market higher Thursday, swelling amid a combination of a waning greenback and increased optimism UK parliament would be able to act to prevent a no-deal Brexit. Things turned mildly sour Friday, however, after shaking hands with supply marked in yellow at 1.2578-1.2519.
Beyond the current supply, the path appears clear for an approach to trend line support-turned resistance taken from the low 1.2960.
H4 perspective:
After crossing swords with the underside of supply at 1.2588-1.2568, the GBP/USD reclaimed a portion of Thursday’s gains on Friday and concluded the week marginally beneath 1.25. The move largely came about on the back of USD strength, assisted initially after a NY Fed spokesperson walked back on Fed’s Williams earlier dovish remarks and Fed sources diminishing hopes of a 50bps cut. Brexit uncertainty also remains at the forefront of this market, weighing on most upside attempts. In terms of support below 1.25, 1.24 appears the next logical base.
Areas of consideration:
Despite recent selling, the green H4 zone highlighted in Friday’s briefing remains of interest this week. Between the 61.8 Fibonacci retracement at 1.2631, June’s opening level at 1.2626 and the round number 1.26, located above the H4 supply at 1.2588-1.2568, this area has ‘fakeout to me’ written all over it, with buy stops above the current supply providing liquidity to sell into. Entry anywhere within the green zone is valid, with protective stop-loss orders positioned a couple of points above 1.2631. Conservative traders may, however, opt to wait for additional candlestick confirmation to form before pulling the trigger. This helps identify seller intent and provides entry and risk levels to work with.
Another scenario that may unfold this week is continued selling beneath 1.25. With buyers’ sell stops likely filled by Friday’s selling, and breakout sell orders triggered, further downside could be on the cards. However, selling at current price is chancy, given the limited close lower. Should more of a decisive H4 close form sub 1.25 that’s followed up with a retest, preferably in the form of a bearish candlestick configuration as this helps position entry and risk levels, a sell to 1.24 is certainly worth considering.
AUD/USD:
Weekly gain/loss: +0.29%
Weekly close: 0.7038
Weekly perspective:
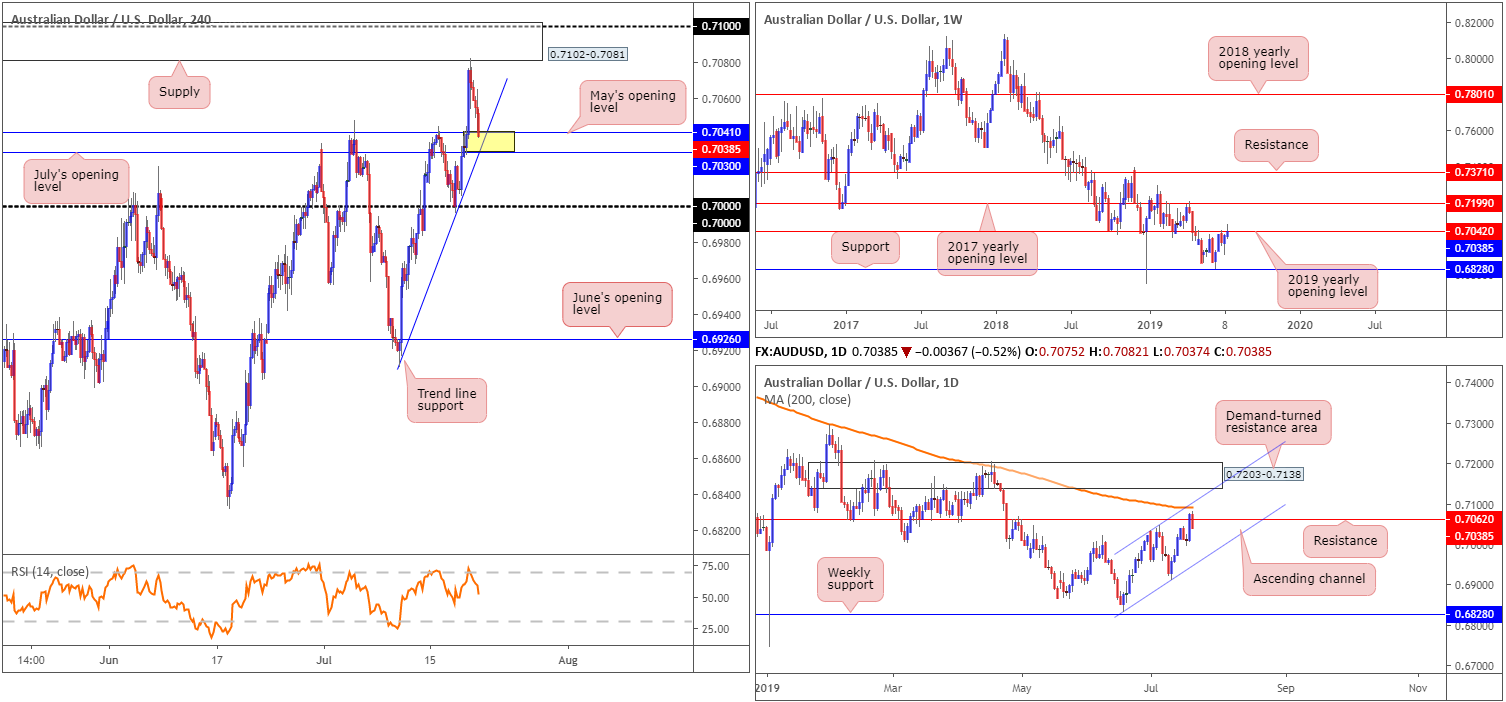
Despite the AUD/USD refreshing multi-month highs at 0.7082, last week’s movement concluded a couple of points beneath the 2019 yearly opening level (resistance) at 0.7042.
Technically, 0.7042 remains a resistance of note, having seen it serve well as support on several occasions in the past and hold price action lower early July. The next downside support target can be seen at 0.6828, should the unit press lower. In the event we push north this week, however, traders may wish to note the 2017 yearly opening level at 0.7199.
Daily perspective:
In recent trading, daily price came within touching distance of the 200-day SMA currently circulating around 0.7091 and channel resistance taken from the high 0.7034, before collapsing lower and reclaiming resistance at 0.7062. Continued selling from this point could lead to a move being seen towards channel support extended from the low 0.6831 this week.
H4 perspective:
A brief recap of Friday’s movement on the H4 timeframe reveals the candles encountered selling around the underside of supply coming in at 0.7102-0.7081, which happens to envelope the 0.71 handle. Coinciding with a USD advance that brought the DXY back above 97.00, the Aussie closed on its lows within an area of support formed by July’s opening level at 0.7030 and May’s opening level at 0.7041 (yellow), which intersects with a steep trend line support taken from the low 0.6910.
Areas of consideration:
Having seen weekly resistance at 0.7042 remain in the fold, and daily price close back beneath resistance at 0.7062, buying this market from the H4 support area at 0.7030/0.7041 may end unfavourably.
Assuming the technical studies presented above are correct and we press lower, short-term selling opportunities exist between 0.7030 and 0.70. However, do ensure risk/reward is factored into any sells here, targeting at least a 1:2 ratio. The key figure 0.70 is a support level by and of itself given the interest it attracts.
Should 0.70 fail to offer support, we then have room to potentially push as far south as June’s opening level at 0.6926. Given the lack of fundamental drivers, though, it’s unlikely we’ll overthrow 0.70 today.
USD/JPY:
Weekly gain/loss: -0.19%
Weekly close: 107.68
Weekly perspective:
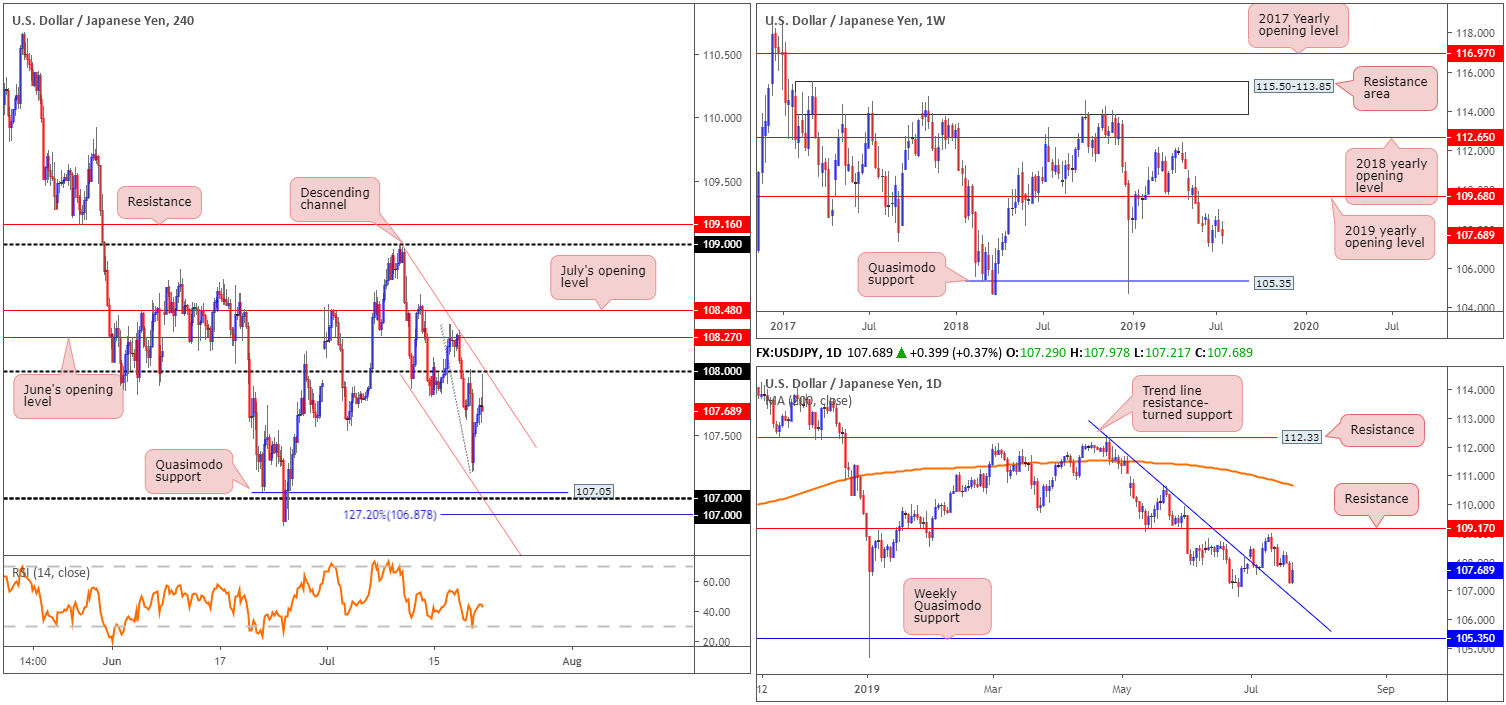
Extending losses for a second consecutive week, the USD/JPY pair erased a little more than 20 points. According to technical structure on the weekly timeframe, long-term resistance is set by way of the 2019 yearly opening level at 109.68 and support is not expected to emerge until reaching a Quasimodo formation at 105.35.
Daily perspective:
Since topping just south of resistance at 109.17, the pair has been slowly grinding southbound. The next port of call, in terms of support, can be seen in the form of a trend line resistance-turned support (extended from the high 112.40), aligning with the 106.78 June 25 low, followed then by the weekly Quasimodo support mentioned above at 105.35.
H4 perspective:
Following Thursday’s Fed related losses after Fed’s Williams dovish comments, a USD correction developed Friday and reclaimed a large portion of recently lost ground. The move higher was triggered after a NY Fed spokesperson walked back on Fed’s Williams dovish remarks and Fed sources diminished hopes of a 50bps cut.
Analysing the market technically shows the candles came within a couple of points of connecting with channel support (etched from the low 107.85), before turning higher and closing just south of the 108 handle in the shape of a shooting star formation.
Areas of consideration:
Although there’s a chance sellers may enter the mix today based on the shooting star pattern produced on the H4 timeframe, the research team urges caution since the candlestick signal did not connect with H4 resistance. Yes it came close, but that’s not enough. For that reason, waiting and seeing if the H4 candles retest the 108 handle and merging channel resistance (extended from the high 108.99) is recommended. Ideally, should the retest of 108 offer another bearish candlestick formation, as this, coupled with both weekly and daily timeframes suggesting lower prices could be in store, is likely enough to consider selling, targeting H4 Quasimodo support at 107.05.
USD/CAD:
Weekly gain/loss: +0.25%
Weekly close: 1.3058
Weekly perspective:
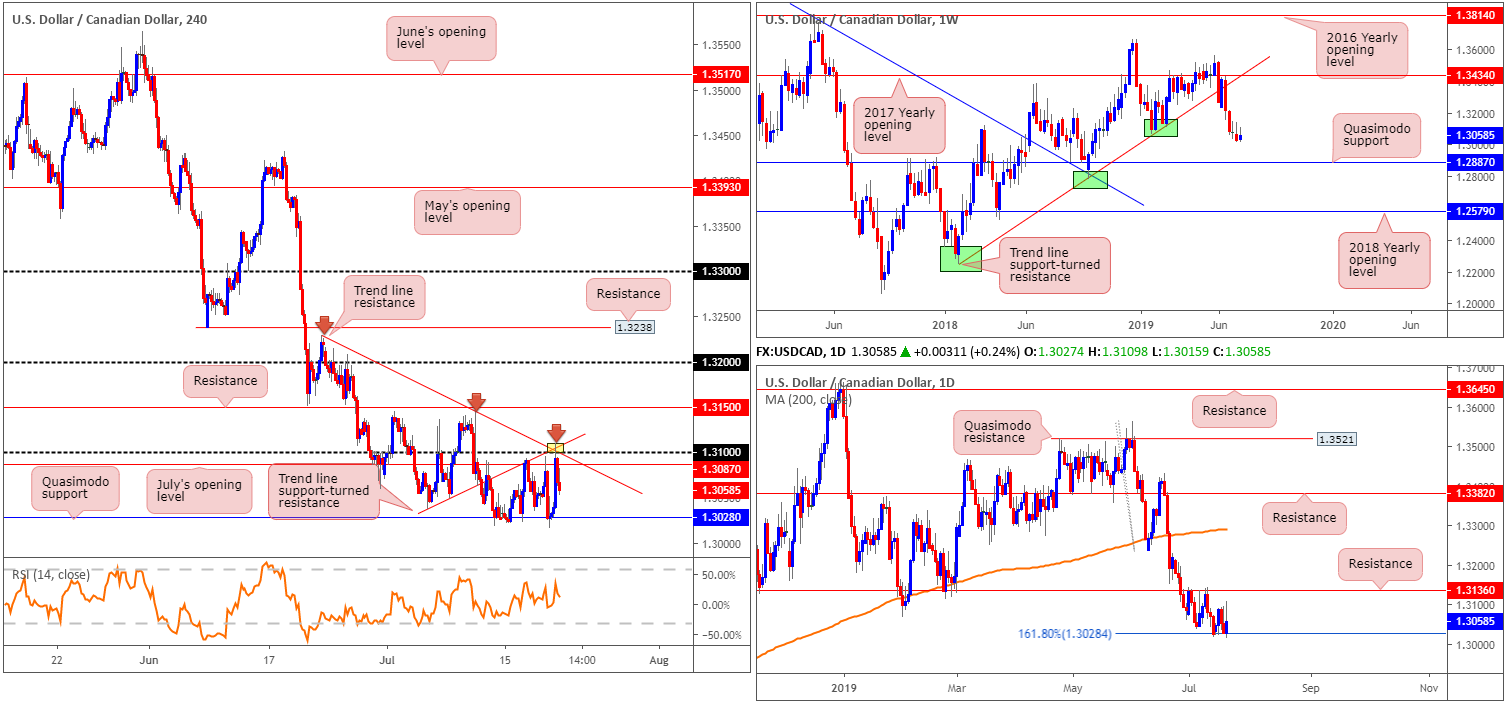
Since coming into close contact with the 2017 yearly opening level at 1.3434 mid-June, selling has been at the forefront of this market. Despite last week’s minor bullish candle, limited support is evident on the weekly timeframe until reaching a Quasimodo formation at 1.2887. For that reason, traders can expect further downside to materialise over the coming weeks.
Daily perspective:
The last line of defence for buyers on the daily timeframe, until the path is clear for a run to the aforementioned weekly Quasimodo support that is, is the 161.8% Fibonacci ext. point at 1.3028 which entered the mix a week ago. To confirm buyer intent here, the research team notes to watch for a daily close to form above resistance at 1.3136.
H4 perspective:
Since July 11, the H4 candles have been carving out a range between Quasimodo support at 1.3028, which happens to align with a 161.8% Fibonacci ext. point highlighted above on the daily timeframe, and the 1.31 handle. Note 1.31 brings with it a collection of resistances, including July’s opening level at 1.3087, trend line resistance taken from the high 1.3199 and a trend line support-turned resistance extended from the low 1.3037. Traders may have also noticed price action reacted at the point the two said trend lines merge on Friday (yellow). With so much local confluence at this point, it was hard not to be bearish.
Areas of consideration:
Outlook remains unchanged.
While the H4 range is still intact and daily price is seen bolstering the lower edge of the area in the form of a 161.8% Fibonacci ext., the research team have eyes on a move lower this week, with a final downside target set at the weekly Quasimodo support drawn from 1.2887. Aside from the shorts currently in play from the 1.31 handle – well done to any of our readers who managed to catch this – a decisive H4 close beneath 1.3028 is eyed this week. A H4 close beneath here that’s followed up with a successful retest will likely be sufficient to encourage further downside. As for entry, traders have the option of basing entry and risk levels on the rejecting candle’s structure – of course this would be ideal if the rejecting candle formed by way of a Japanese candlestick formation.
USD/CHF:
Weekly gain/loss: -0.25%
Weekly close: 0.9814
Weekly perspective:
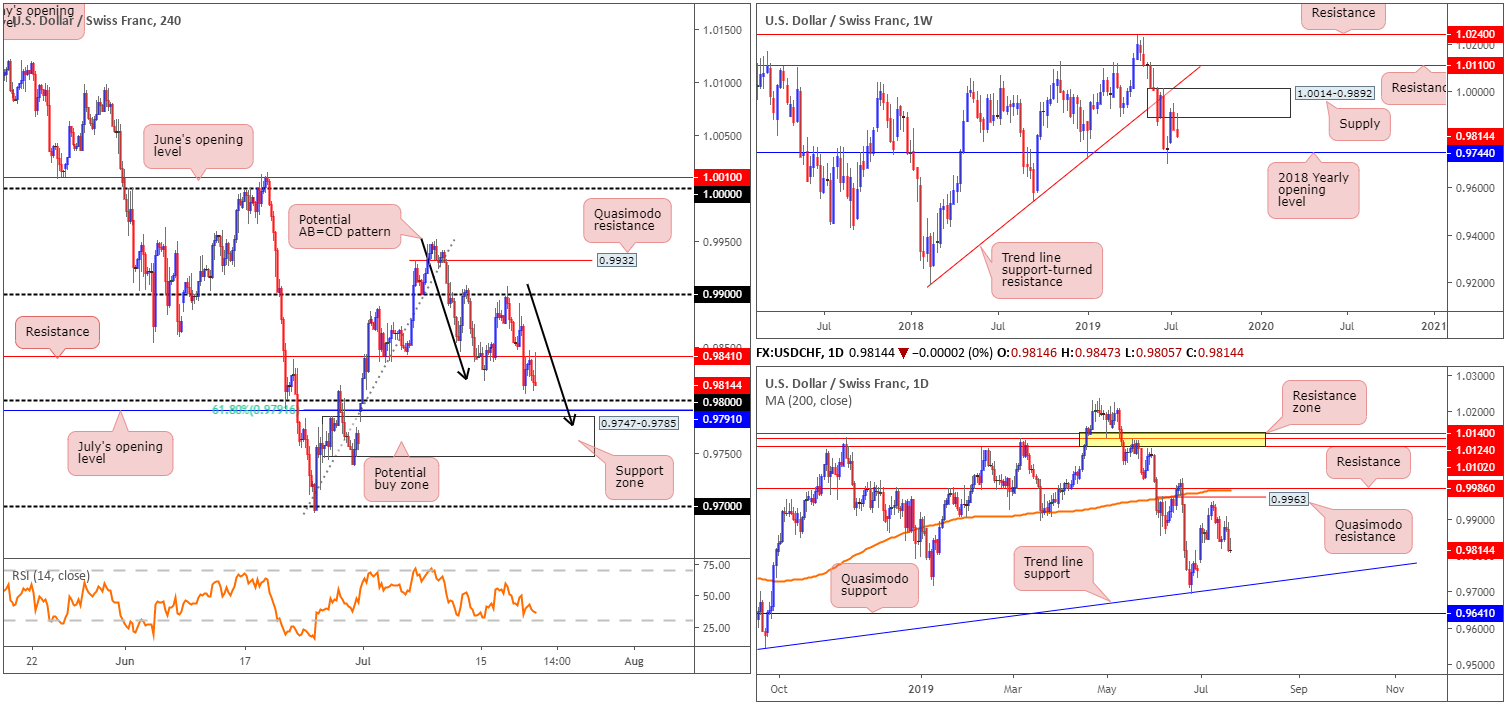
The US dollar surrendered another portion of recent gains off the 2018 yearly opening level at 0.9744 last week, following a rotation lower out of supply at 1.0014-0.9892 by way of a strong bearish selling wick. While this could lead to a revisit of 0.9744, traders may also find use in noting the trend line support-turned resistance (extended from the low 0.9187), closely followed by resistance at 1.0110, should we turn higher this week.
Daily perspective:
Closer examination of price action on the daily timeframe shows the unit pressing south after failing to test Quasimodo resistance at 0.9963 early July, followed closely by resistance at 0.9986 and the 200-day SMA (orange). To the downside, limited support is in view until reaching trend line support taken from the low 0.9542.
H4 perspective:
Having seen the USD/CHF remain beneath resistance at 0.9841 Friday, despite broad-based USD bidding, 0.98 remains an alluring area of support this week. Closely trailed by July’s opening level at 0.9791, a 61.8% Fibonacci retracement value a support zone at 0.9747-0.9785 and a possible AB=CD correction point (black arrows) at 0.9777, the surrounding area offers strong local confluence for a move higher.
Areas of consideration:
Outlook remains unchanged.
Longer-term flow remains unchanged and suggests selling could still be in store from weekly supply at 1.0014-0.9892.
Medium-term flow, also unchanged in terms of tradable zones, has eyes on the 0.98 region (given its surrounding confluence highlighted above) for potential longs. However, traders interested in buying 0.98 are also urged to take into account we could witness a fakeout into 0.9747-0.9785 before rotating higher. Stop-loss placement, therefore, is best positioned beneath this zone at 0.9747.
Dow Jones Industrial Average:
Weekly gain/loss: -0.85%
Weekly close: 27072
Weekly perspective:
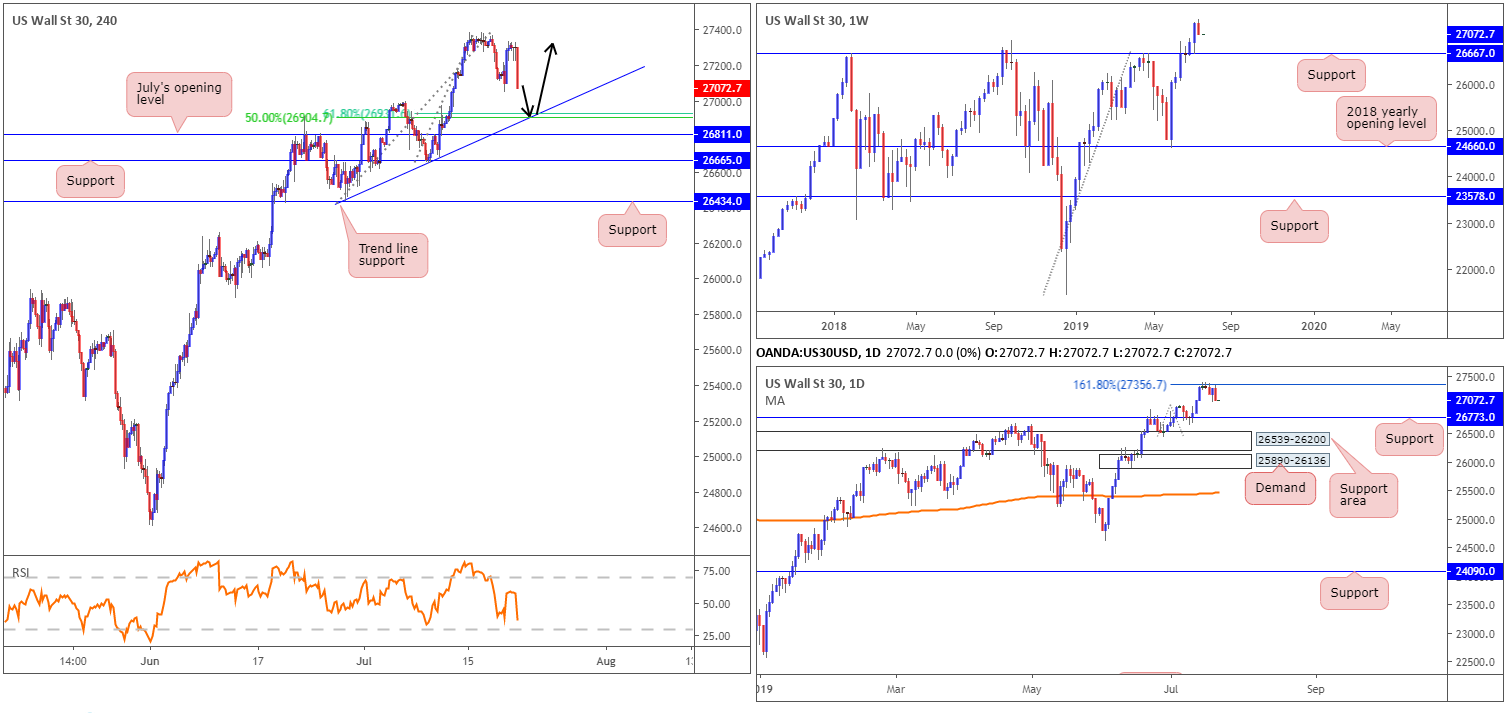
Aside from a brief spell of indecision four weeks back, and last week’s retracement losing more than 230 points, the Dow Jones Industrial Average has emphasised a strong bullish tone since shaking hands with the 2018 yearly opening level at 24660 in early June.
Taking out resistance at 26667 and shortly after retesting it as support has so far provided a floor to this market. With limited resistance in sight until connecting with 28070 (not visible on the screen), a 127.2% Fibonacci ext. point taken from the low 21425, additional buying, despite recent selling, could still be seen over the coming weeks.
Daily perspective:
Contrary to weekly price, daily action is defending the underside of 27356: the 161.8% Fibonacci ext. point. Continued selling from here has a downside support target set at 26773, located just north of weekly support at 26667.
H4 perspective:
Stocks fell Friday as investors digested a slew of corporate earnings reports and remarks from a top Federal Reserve official. The Dow Jones Industrial Average closed at -0.25%; the S&P 500 declined 0.62% and the tech-heavy Nasdaq 100 lost 0.88%.
Limited support is visible on the H4 scale until reaching a trend line support extended from the low 26436, which happens to line up with a 61.8% Fibonacci retracement at 26930 and a 50.0% support value at 26904.
Areas of consideration:
Until the index breaks above daily resistance (161.8% Fibonacci ext. point) at 27356, buying this market long term is a challenge. Once/if this level is taken out, a long, preferably on the retest of 27356, is certainly worthy of consideration, with an ultimate upside target set on the weekly timeframe (see above) at 28070.
Should the index shake hands with H4 trend line support and merging Fibonacci levels (see above), however, a long could be considered, with a stop-loss order fixed beneath July’s opening level at 26811 on the H4 timeframe. The first take-profit target from this point will depend on the approach, but overall the research team are looking at 27356 on the daily timeframe.
XAU/USD (GOLD):
Weekly gain/loss: +0.71%
Weekly close: 1425.3
Weekly perspective:
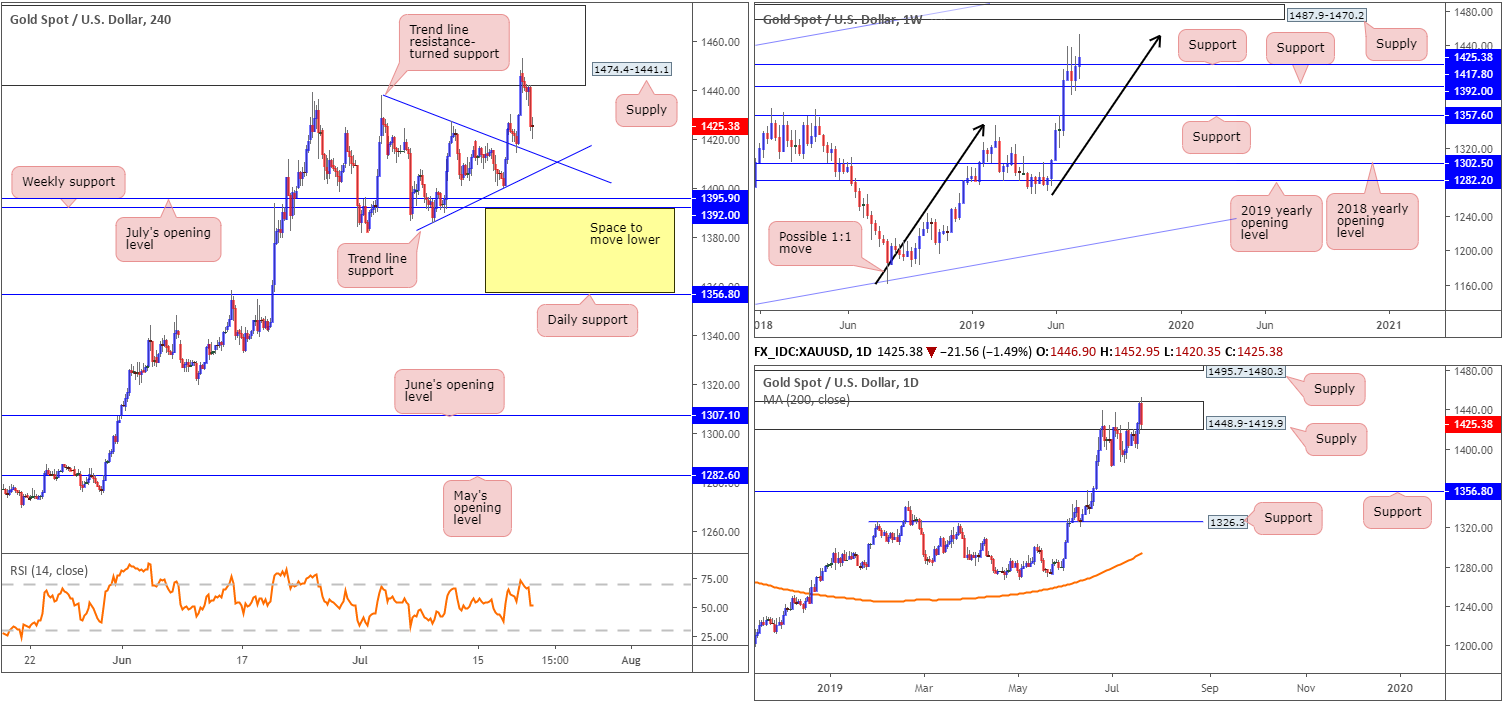
Resistance at 1417.8, which capped downside over the past three weeks, finally gave way last week, allowing bullion to cross paths with a 1:1 correction (black arrows) around 1453.2 shaped from the 1160.3 August 13 low. As is evident from the chart, selling has so far been reasonably strong from 1453.2, though will it be enough to reclaim 1417.8?
Daily perspective:
The technical landscape on the daily timeframe observed a break of the top edge of a supply zone at 1448.9-1419.9 late last week. While this move was likely enough to trip a portion of the stop-loss orders above here, it’s unlikely to have cleared the path north to supply at 1495.7-1480.3 just yet, given Friday’s run south erasing 1.49%.
As for downside targets on this scale, the research team notes to be aware of the 1381.9 July 1 low, followed by support at 1356.8.
H4 perspective:
Friday’s downside moves can be attributed to a stronger dollar across the board. The rather large supply zone drawn all the way back from May 2013 at 1474.4-1441.1 held ground, with the next downside objective seen nearby in the form of a trend line resistance-turned support (taken from the high 1437.7), closely followed by another layer of trend line support taken from the low 1385.5.
Areas of consideration:
Selling this market based on the weekly 1:1 correction at 1453.2 is chancy, given the H4 supports in view. Therefore, it may be best to wait until a H4 close beneath weekly support at 1392.0 is observed. Following this, scope for further selling is seen towards the 1381.9 July 1 low, followed by support at 1356.8.
Well done to those who managed to short the H4 supply zone, however, as this was a noted area to look for shorts in Friday’s report, albeit recommended only with additional bearish candlestick confirmation (which was not seen on the H4 timeframe).
The accuracy, completeness and timeliness of the information contained on this site cannot be guaranteed. IC Markets does not warranty, guarantee or make any representations, or assume any liability with regard to financial results based on the use of the information in the site.
News, views, opinions, recommendations and other information obtained from sources outside of www.icmarkets.com.au, used in this site are believed to be reliable, but we cannot guarantee their accuracy or completeness. All such information is subject to change at any time without notice. IC Markets assumes no responsibility for the content of any linked site.
The fact that such links may exist does not indicate approval or endorsement of any material contained on any linked site. IC Markets is not liable for any harm caused by the transmission, through accessing the services or information on this site, of a computer virus, or other computer code or programming device that might be used to access, delete, damage, disable, disrupt or otherwise impede in any manner, the operation of the site or of any user’s software, hardware, data or property.


