
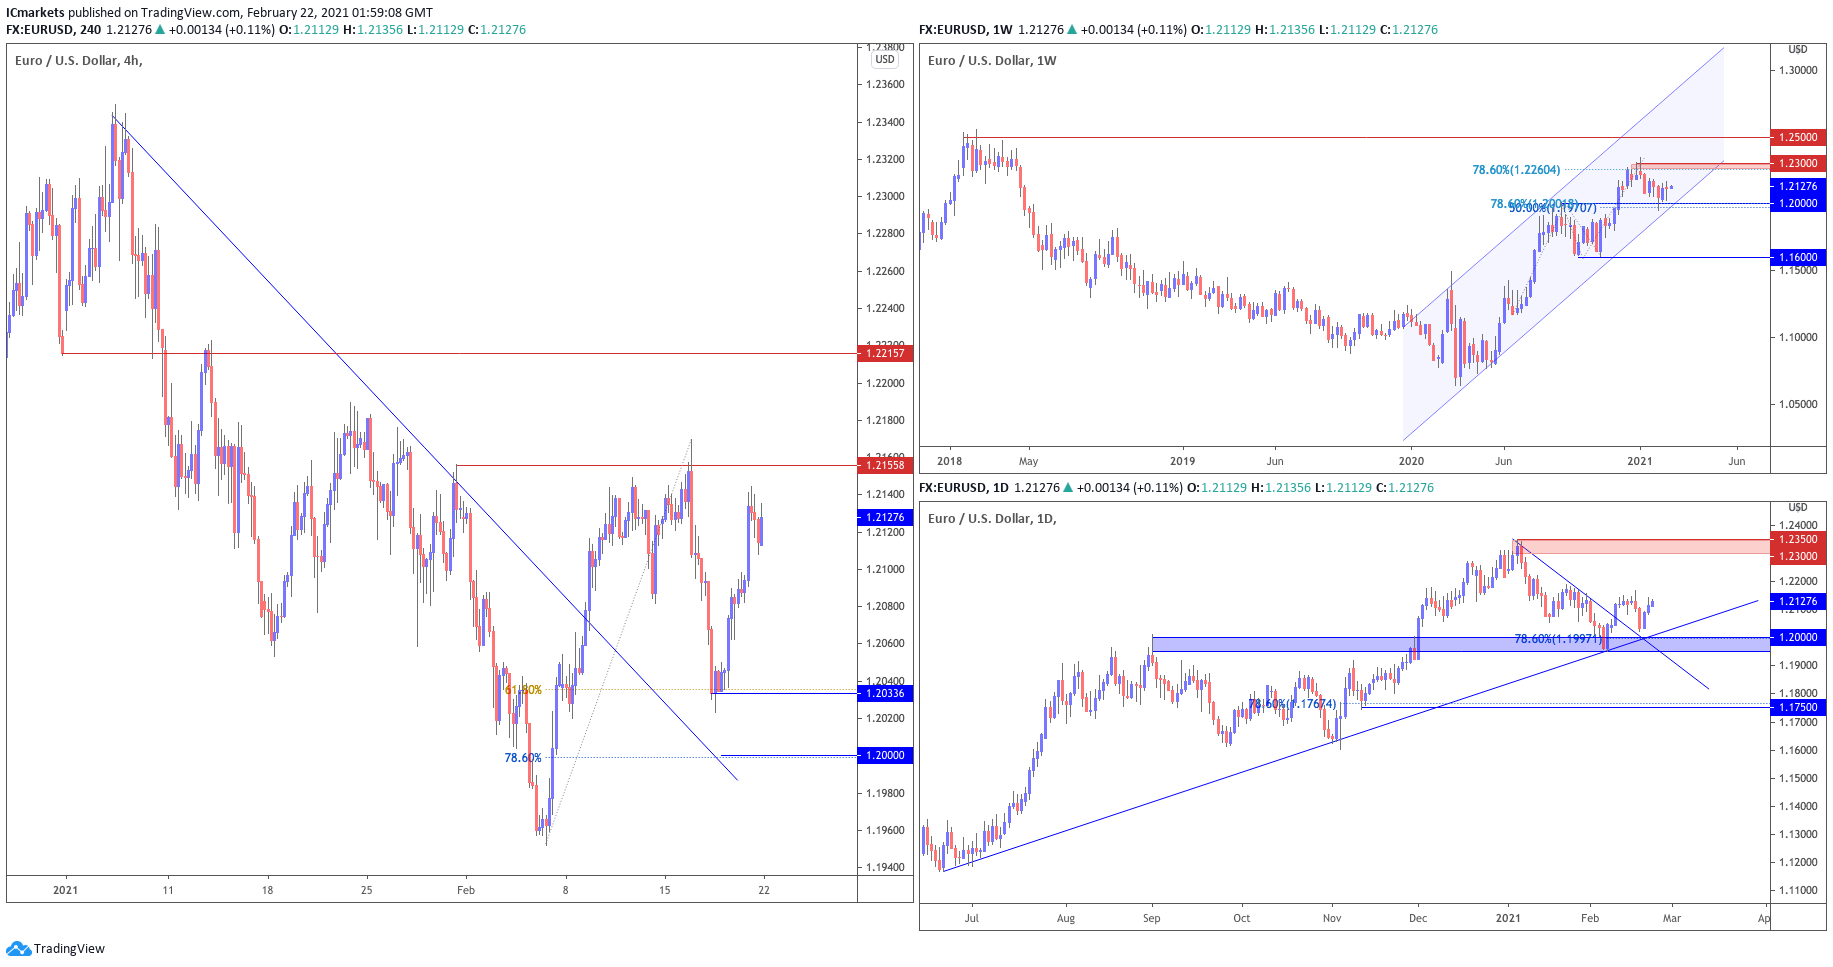
EUR/USD:
Looking at the weekly chart, we can see that prices are testing the support area of our ascending channel at 1.200, which coincides with the 50% Fibonacci retracement and 78.6% Fibonacci extension. We could see a further upside to test our resistance area at 1.2300, in line with the graphical swing high resistance and 78.6% Fibonacci extension. On the daily time frame, prices are holding nicely above the ascending trend line and support area at 1.200 which can also be found on the weekly time frame.
On the H4 timeframe, prices are facing bullish pressure from our support at 1.20336, in line with our graphical swing low support area and 61.8% fibonacci retracement. We could see limited downside before price reaches our resistance area at 1.21558, in line with the graphical swing high resistance level. A break above this resistance level could see a further push up to our next resistance target at 1.22157, in line with our graphical overlap resistance.
Areas of consideration:
- 20336 support area found on H4 time frame
- 21558 resistance level found on H4 time frame
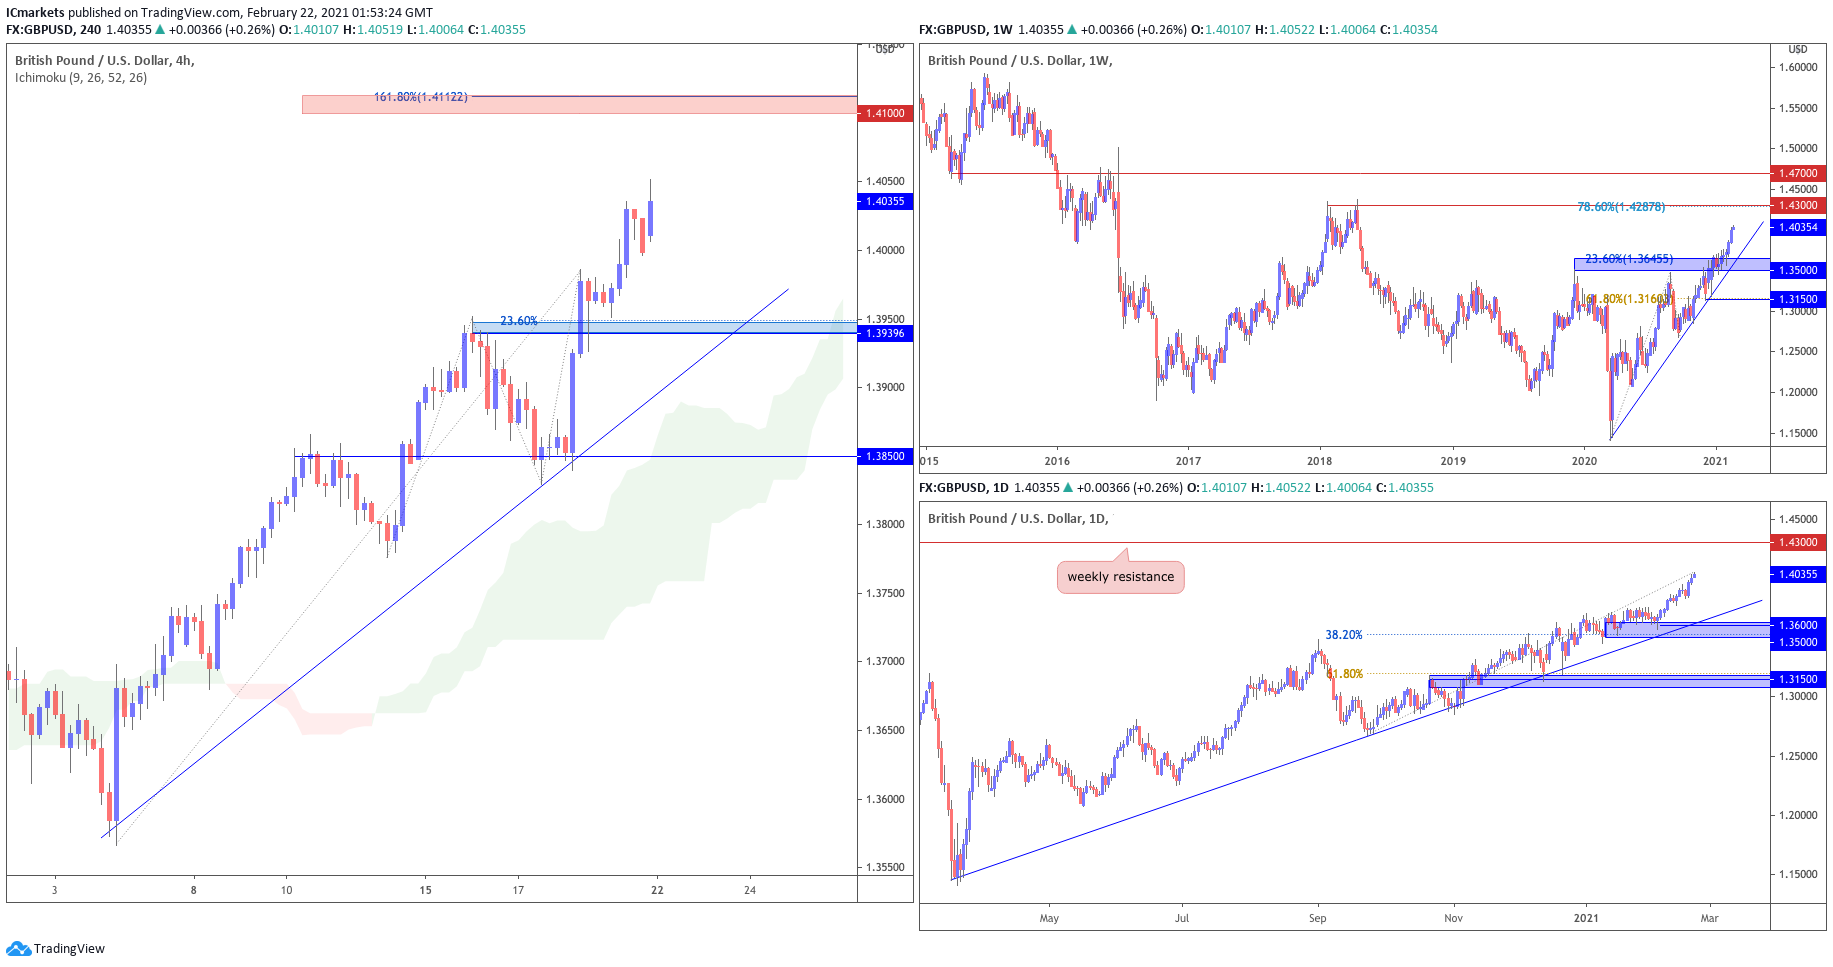
GBP/USD:
Looking at the weekly chart, we can see that prices are holding nicely above our ascending trend line and weekly support area at 1.35000 where we could see a further upside to the weekly resistance level at 1.43000, in line with the graphical swing high area and 78.6% Fibonacci extension. On the daily time frame, our support area at 1.35000 – 1.36000, which is also found on the weekly time frame, coincides with the 23.6% Fibonacci retracement.
On the H4 timeframe, prices are facing bullish pressure from our key support area at 1.39396, in line with our horizontal pullback support and 23.6% fibonacci retracement where we could see a bounce above this level towards our resistance target at 1.4100, in line with our 161.8% fibonacci extension.
Areas of consideration:
- 4100 resistance area found on H4 timeframe
- 39396 support area found on H4 timeframe
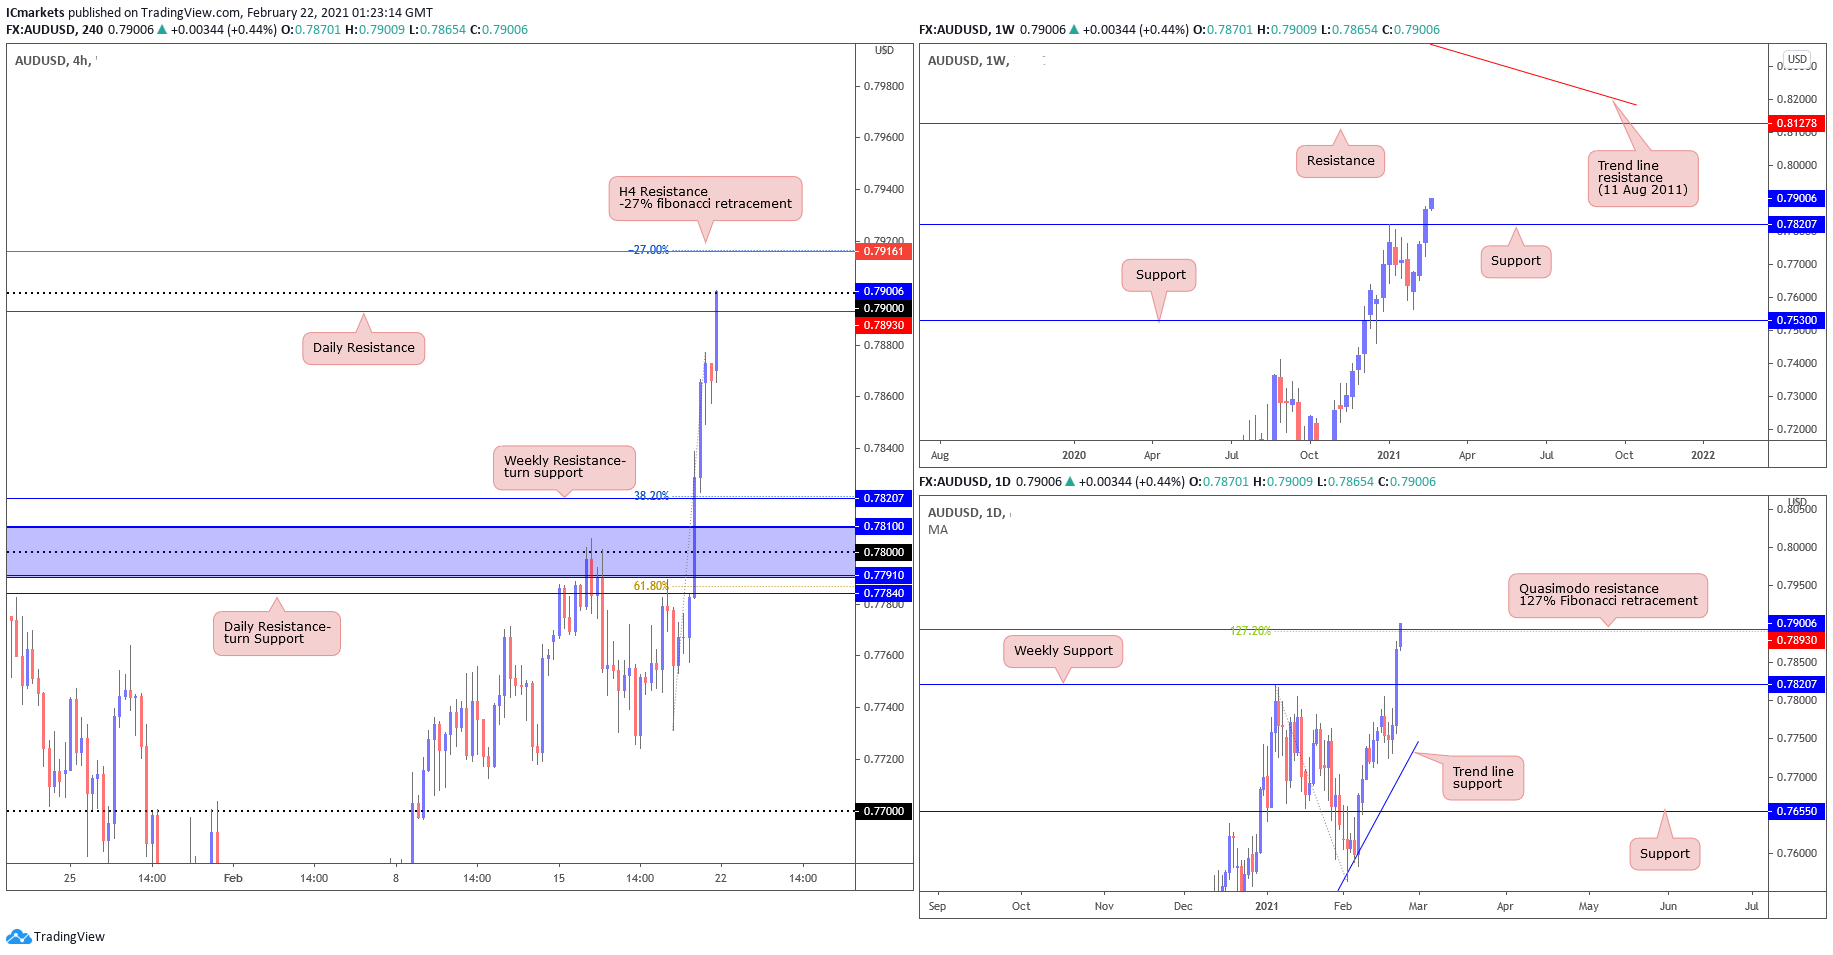
AUD/USD:
From the Weekly timeframe, we can see that the price has pushed passed the 0.78207 level where the previous high was made. We see the move closed above the level as a continuation of its bullish momentum. On the Daily timeframe, we are able to see price currently testing the Quasimodo resistance at 0.7893 which is also in line with the 127% fibonacci retracement level. On H4, we could see that AUDUSD has broken past the 0.7791 – 0.781 resistance zone, it has made its way towards major level 0.79 where we could expect a reaction to occur between this level and 0.79161, which is a -27% fibonacci retracement level. Price is still in a bullish momentum where we may witness new highs being made.
Areas of consideration:
- H4 testing Resistance area between 0.7893 – 0.79161, price could continue further North.
- Weekly and Daily time frame showing strong bullish momentum.
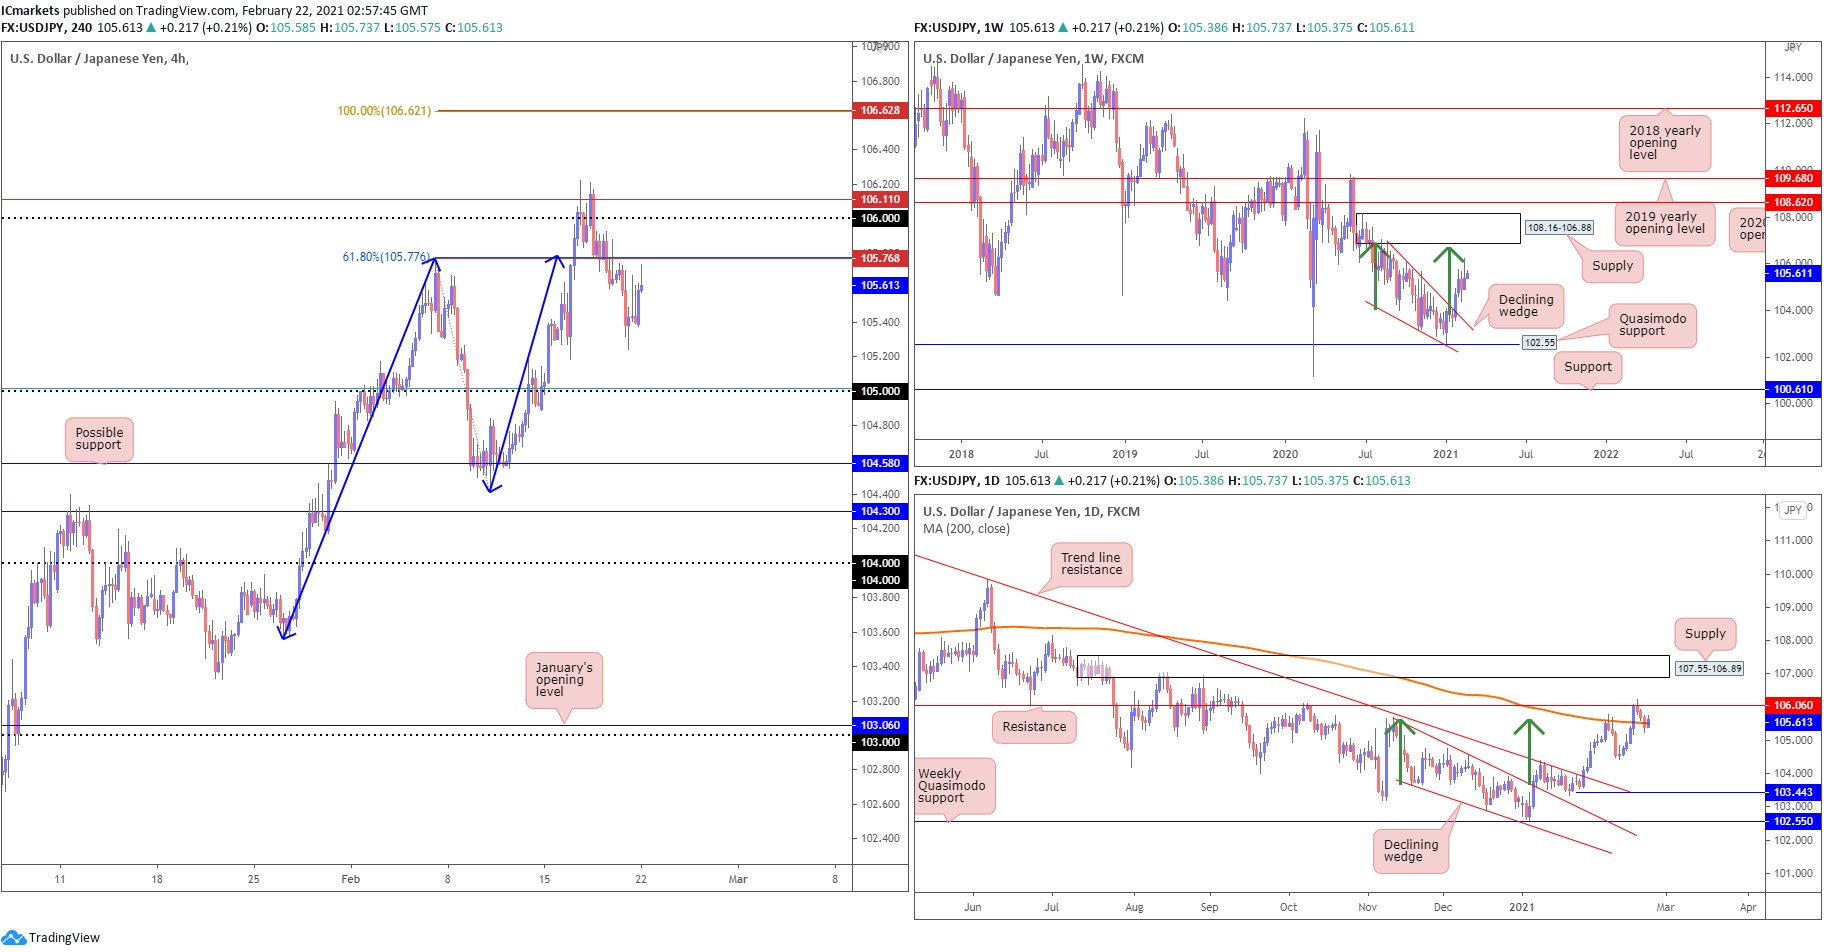
USD/JPY
The US dollar strengthened up on Monday morning, where it retested the 105.76 resistance and steadied there ( 61.8% fib extension ).If price broke above the 105.76 resistance level , we could see buyers step in further and push price higher again towards the 106.00 figure resistance level.
Against the backdrop of the H4 timeframe, price broke out of the weekly declining wedge (106.94/104.18) and saw a slight pullback, before pushing up higher again. On the daily chart, we see that price is now pushing up to test the MA (200) again after making a slight pullback. This shows us room for bullish momentum upwards to test the resistance level at 106.060 level. However, before that on the H4 chart, we couldn’t ignore the support at 104.58 where the horizontal pullback support is.
Areas of consideration:
- 06 resistance on the Daily timeframe is a possible upside target
- 76 resistance level on H4 in line with the 61.8% fib extension
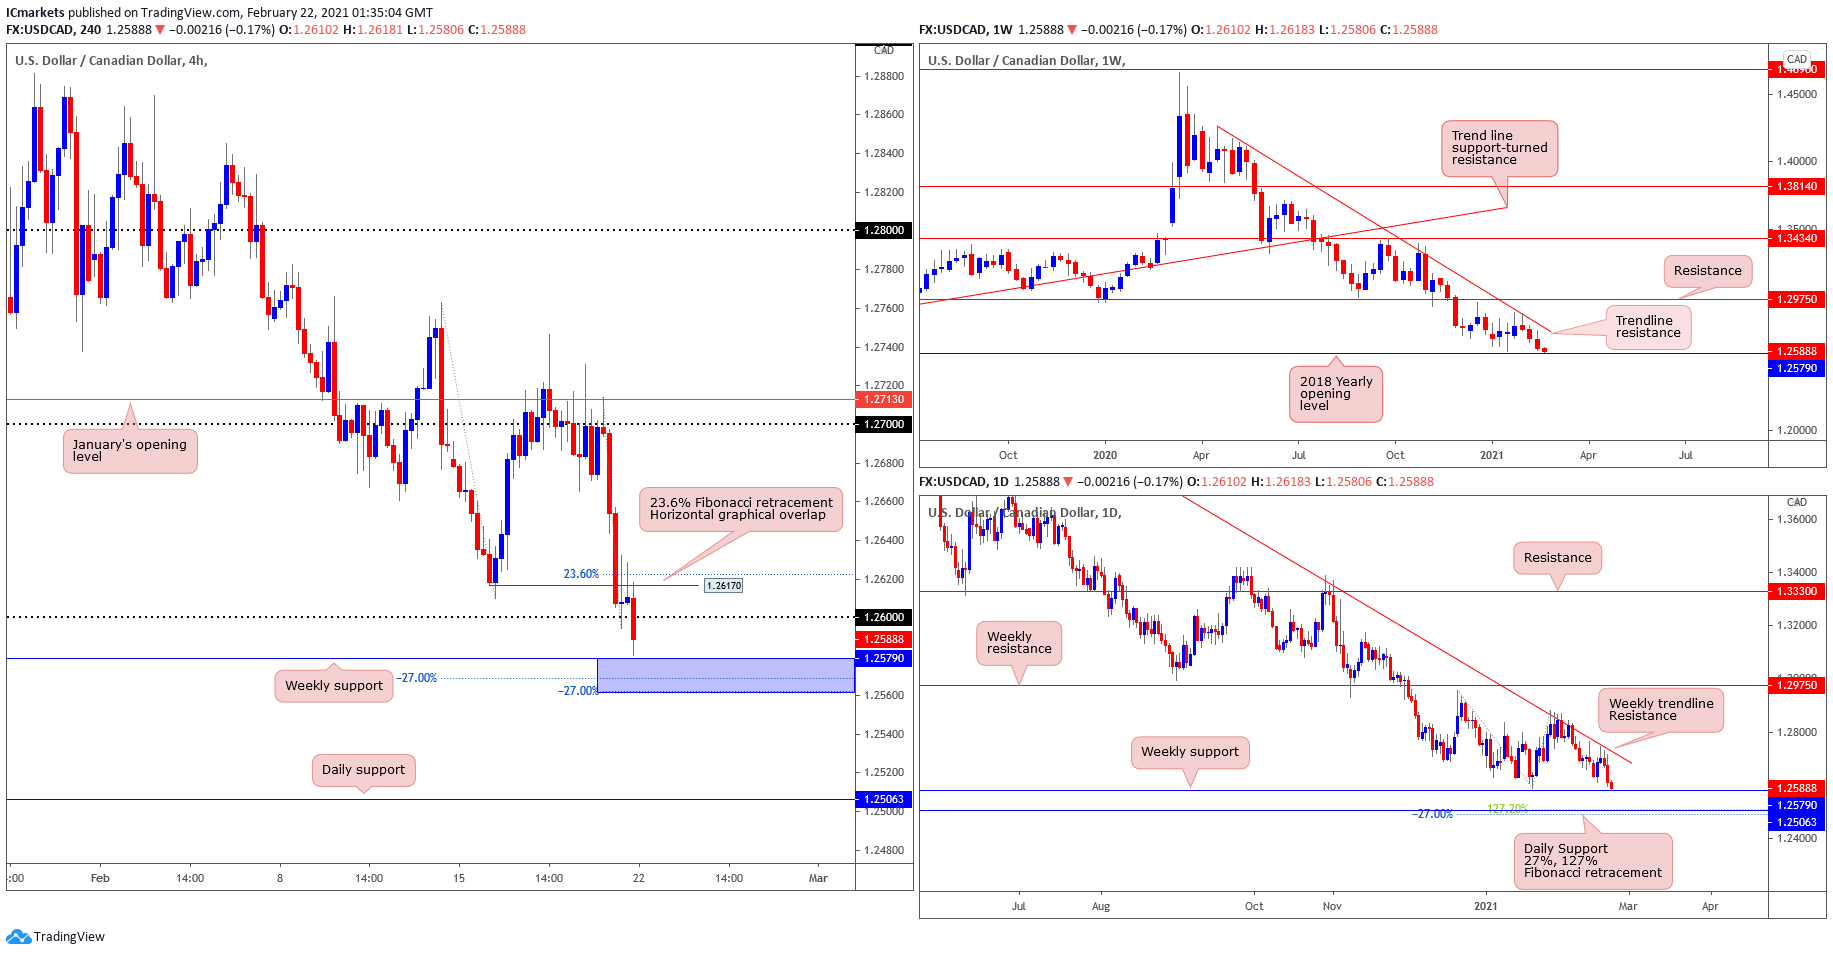
USD/CAD:
Looking at the weekly chart, price is approaching the 2018 Yearly Opening level of support at 1.2579, and is still respecting the descending trendline drawn from 13 April (2020) high. It is important to note that the long-term picture has pointed the direction down (trend) since March (2020). In the daily time frame,price is testing the previous low that was made. And on the H4 timeframe, we are seeing the combination of support levels between Weekly support at 1.2579, and the -27% fibonacci retracements. If price manages to break through the support level, we could potentially see a bigger move down South. A good stop level would be the 1.2617 level where the 23.6% fibonacci retracement and Horizontal graphical overlap are.
Areas of consideration:
- H4 may drop further from major figure 1.26, towards Weekly and H4 support levels towards 1.256
- Weekly and Daily both showing bearish momentum in the longer-term picture, in line with a bearish view.
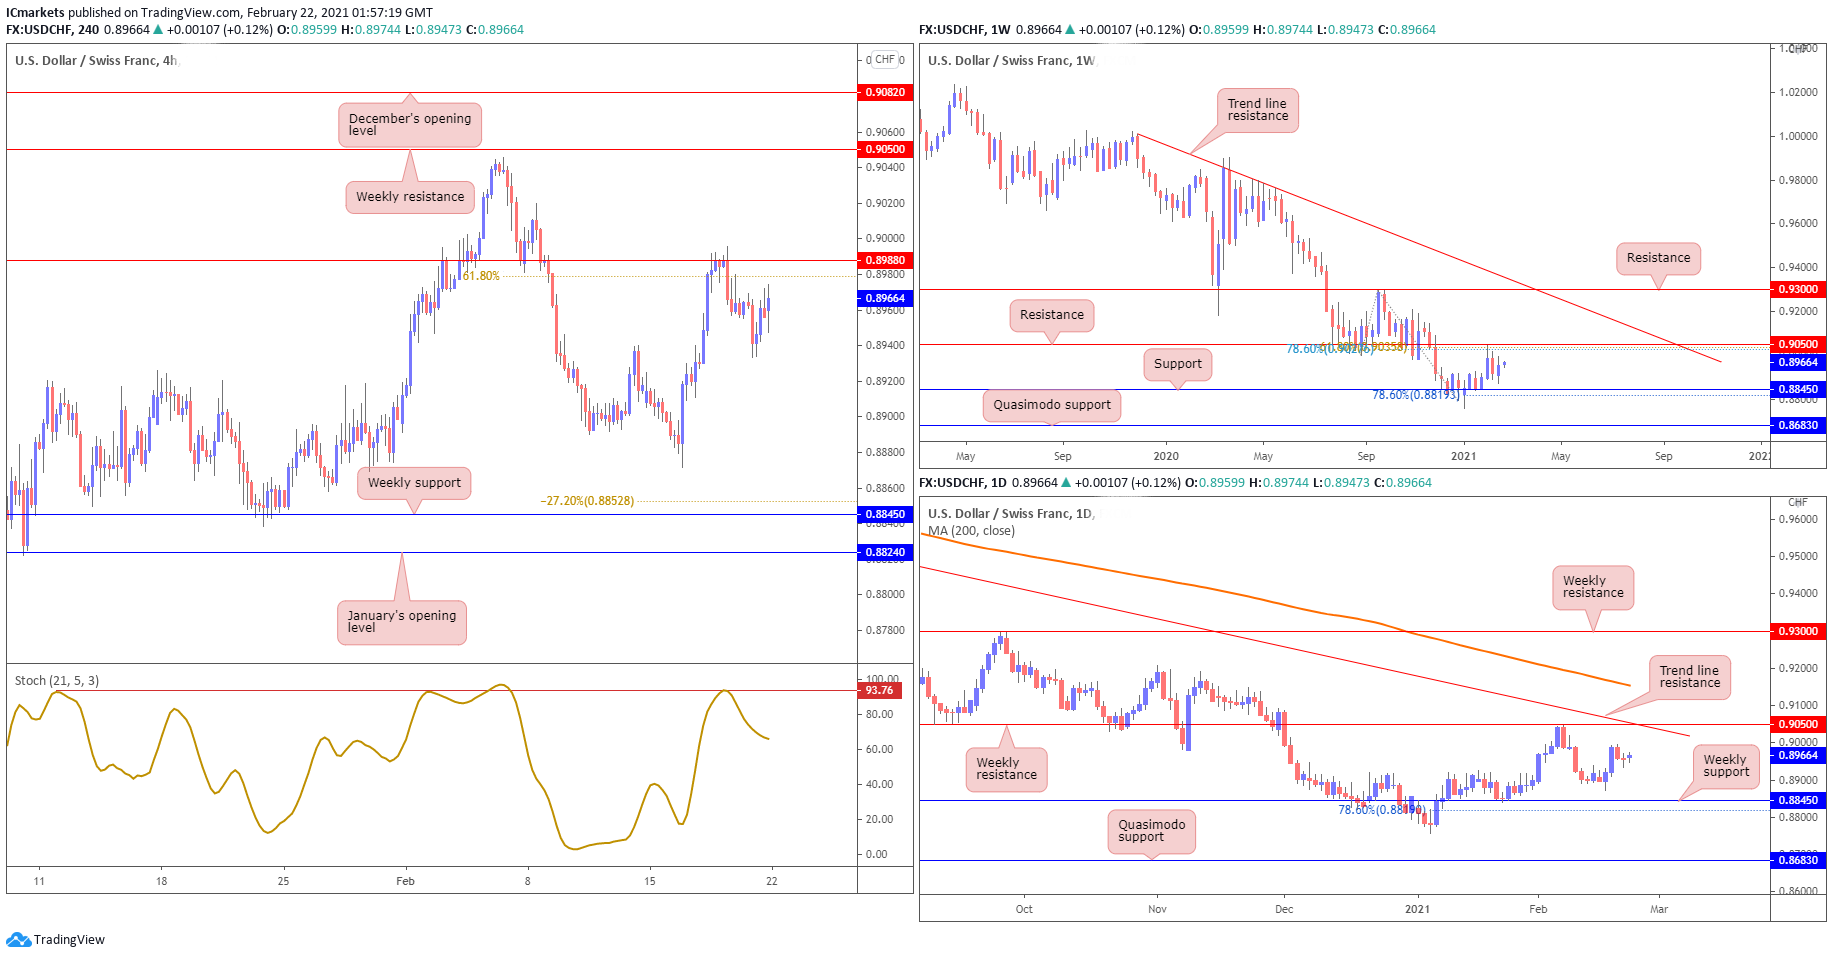
USD/CHF:
USD/CHF shows strong bearish pressure on the weekly chart, where we see it hold below both the descending trendline resistance and the major resistance at 0.90500, in line with our 78.6% Fibonacci extension and 61.8% Fibonacci retracement levels. The daily timeframe also shows a similar picture that signals a possible upcoming push down south, as price holds below the descending trendline and moving average resistances. It is possible for price to continue this week with further downside.
On the H4 timeframe, we see that price indeed held below the 0.90500 weekly resistance level, and is now holding below the 0.89880 level in line with our horizontal swing high resistance and 61.8% Fibonacci retracement level . With the Stochastic indicator reversing from the resistance level at 93.76 where it has reacted from in the past, we expect price to show further to the downside, with the weekly 0.88450 support level as a possible downside target. Otherwise, should price break above the 0.89880 level, we expect price to swing and test the 0.90500 weekly resistance level next.
Areas of consideration:
- USD/CHF continues to show strong bearish pressure, as price holds below the trendline and moving average resistances.
- 90500 level is an important weekly resistance level, and 0.89880 resistance level is a level to watch on the H4 timeframe.
- 88450 support level is a potential downside target for sellers.
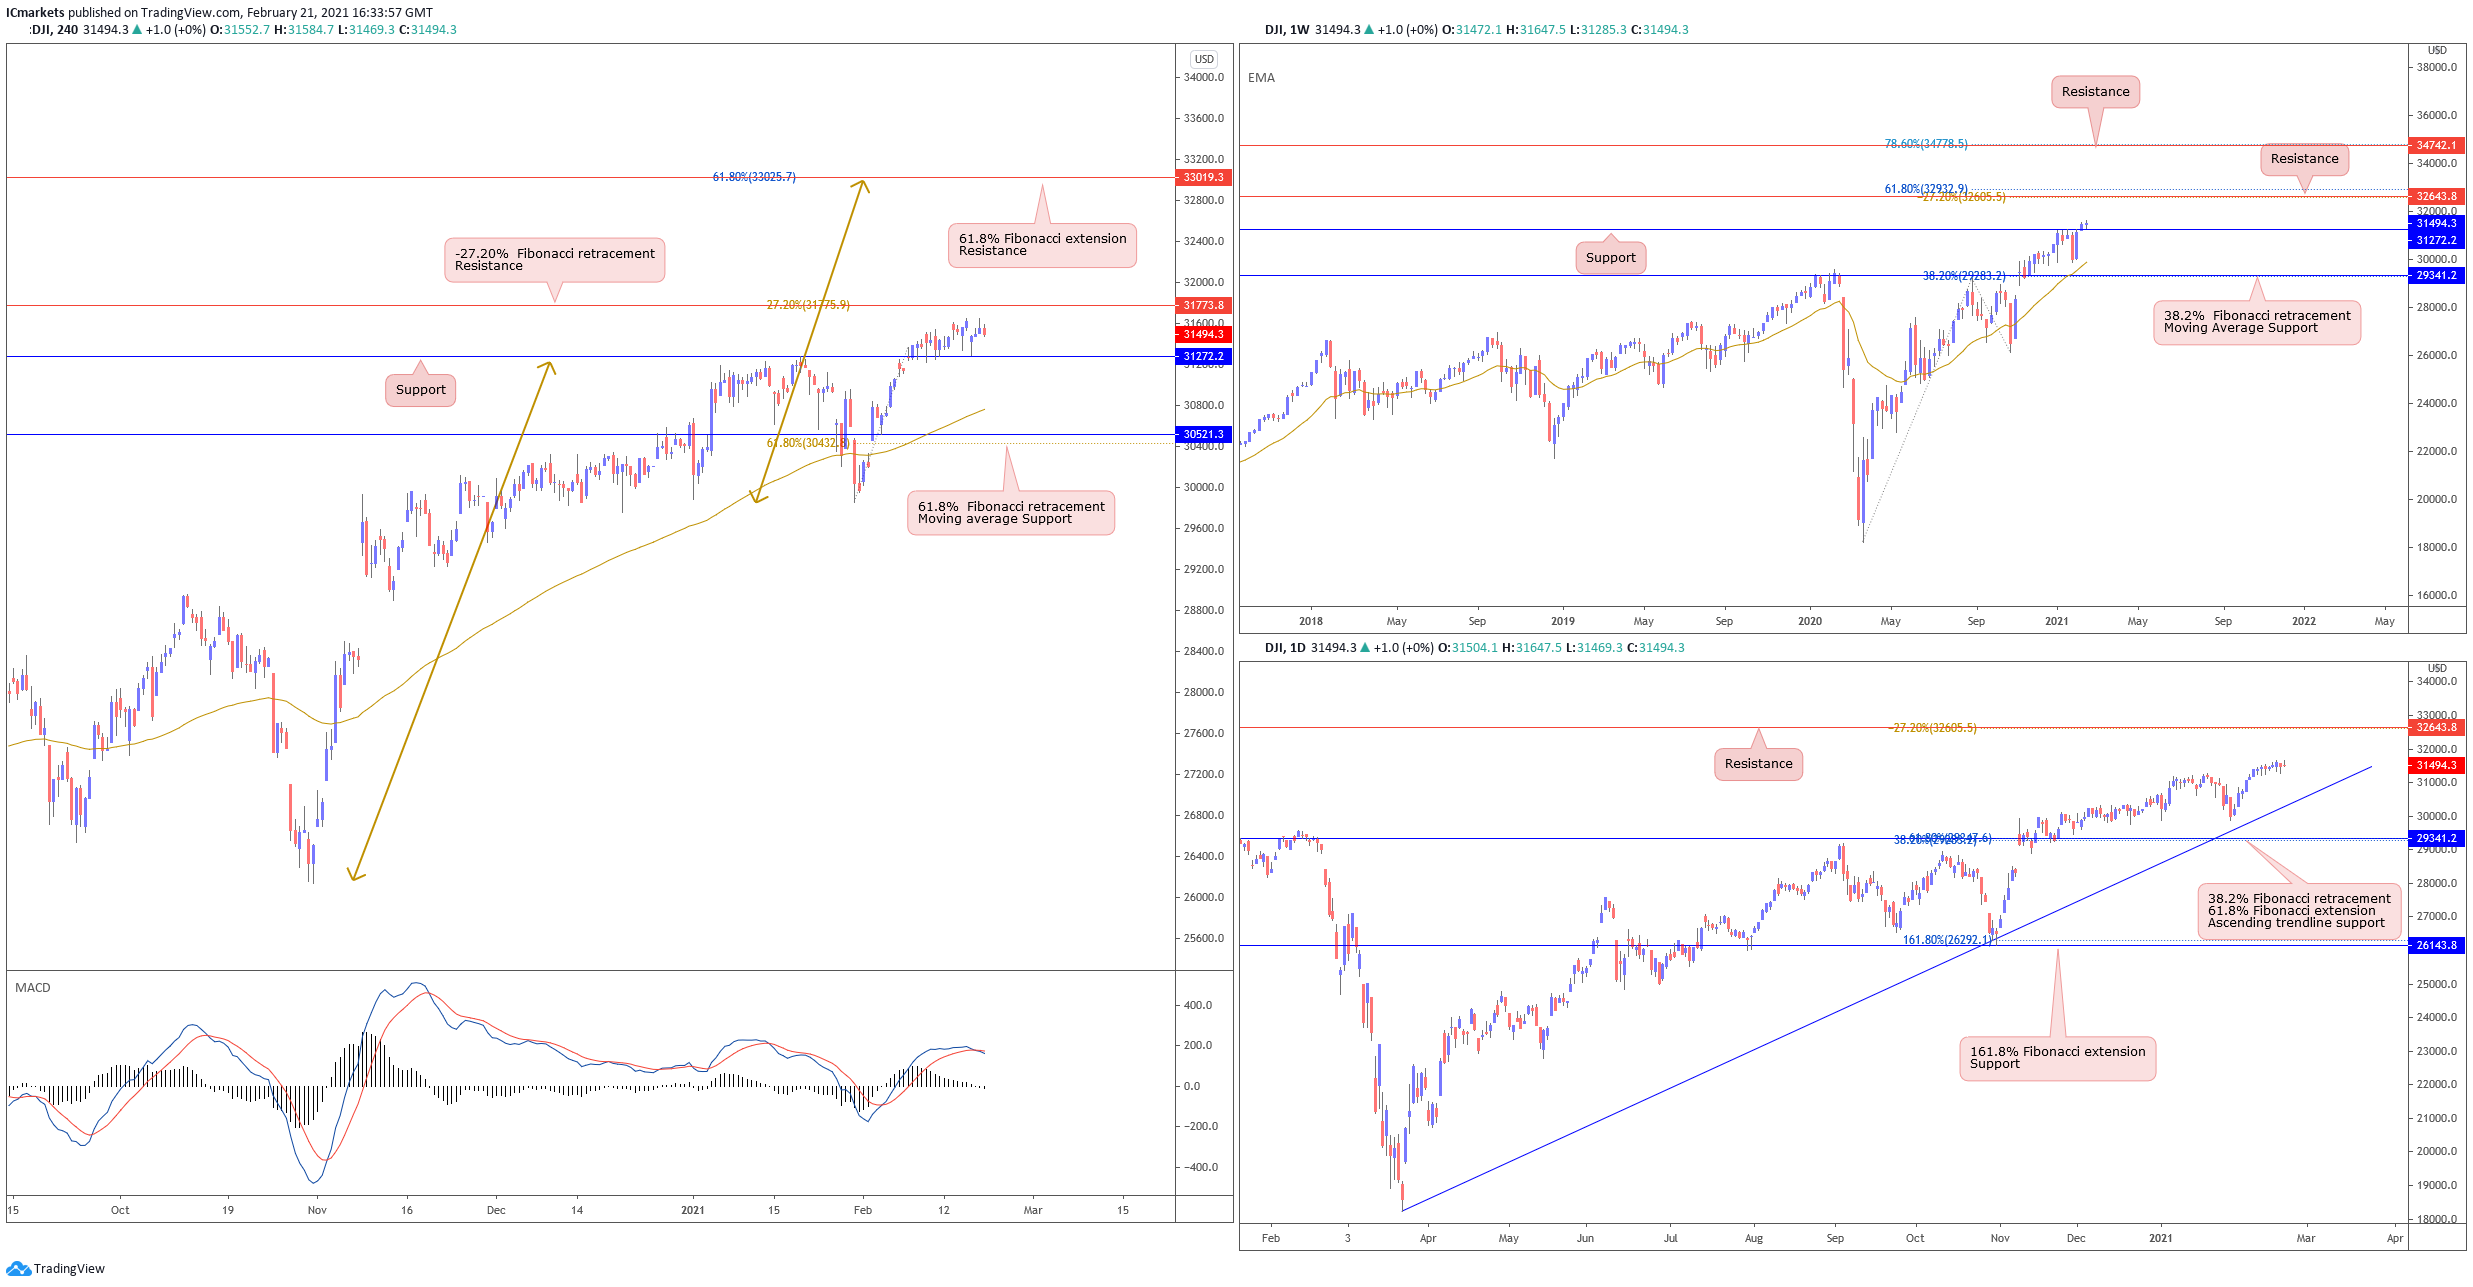
Dow Jones Industrial Average:
On the weekly chart, price continues to hold above 31272 resistance. Traders can expect to see price pushing even higher towards the next resistance at 32643. Otherwise, failure to hold above 31272 could mean that this is a fake out and probably pull back towards 29341 support. With no change for the Daily, price continues to hold very strongly above ascending trendline support. Traders should be careful when deciding to trade any short term pullbacks as the bullish momentum on the longer term is very strong.
On the H4, price drifted sideways holding between key support at 31272 and resistance at 31773. We note that Technical indicators continue to show room for further bullish upside. Watch resistance at 31773 closely as a break and close above would mean seeing more buyers entering with their longs to push price higher, possibly towards 33019. Otherwise, failure to hold above 31272 could see price swing back and come back to the 61.8% Fibonacci retracement level and moving average support at 30521.
Areas of consideration:
- Intraday resistance at 31773 level to watch
- Intraday support at 31272 level to watch
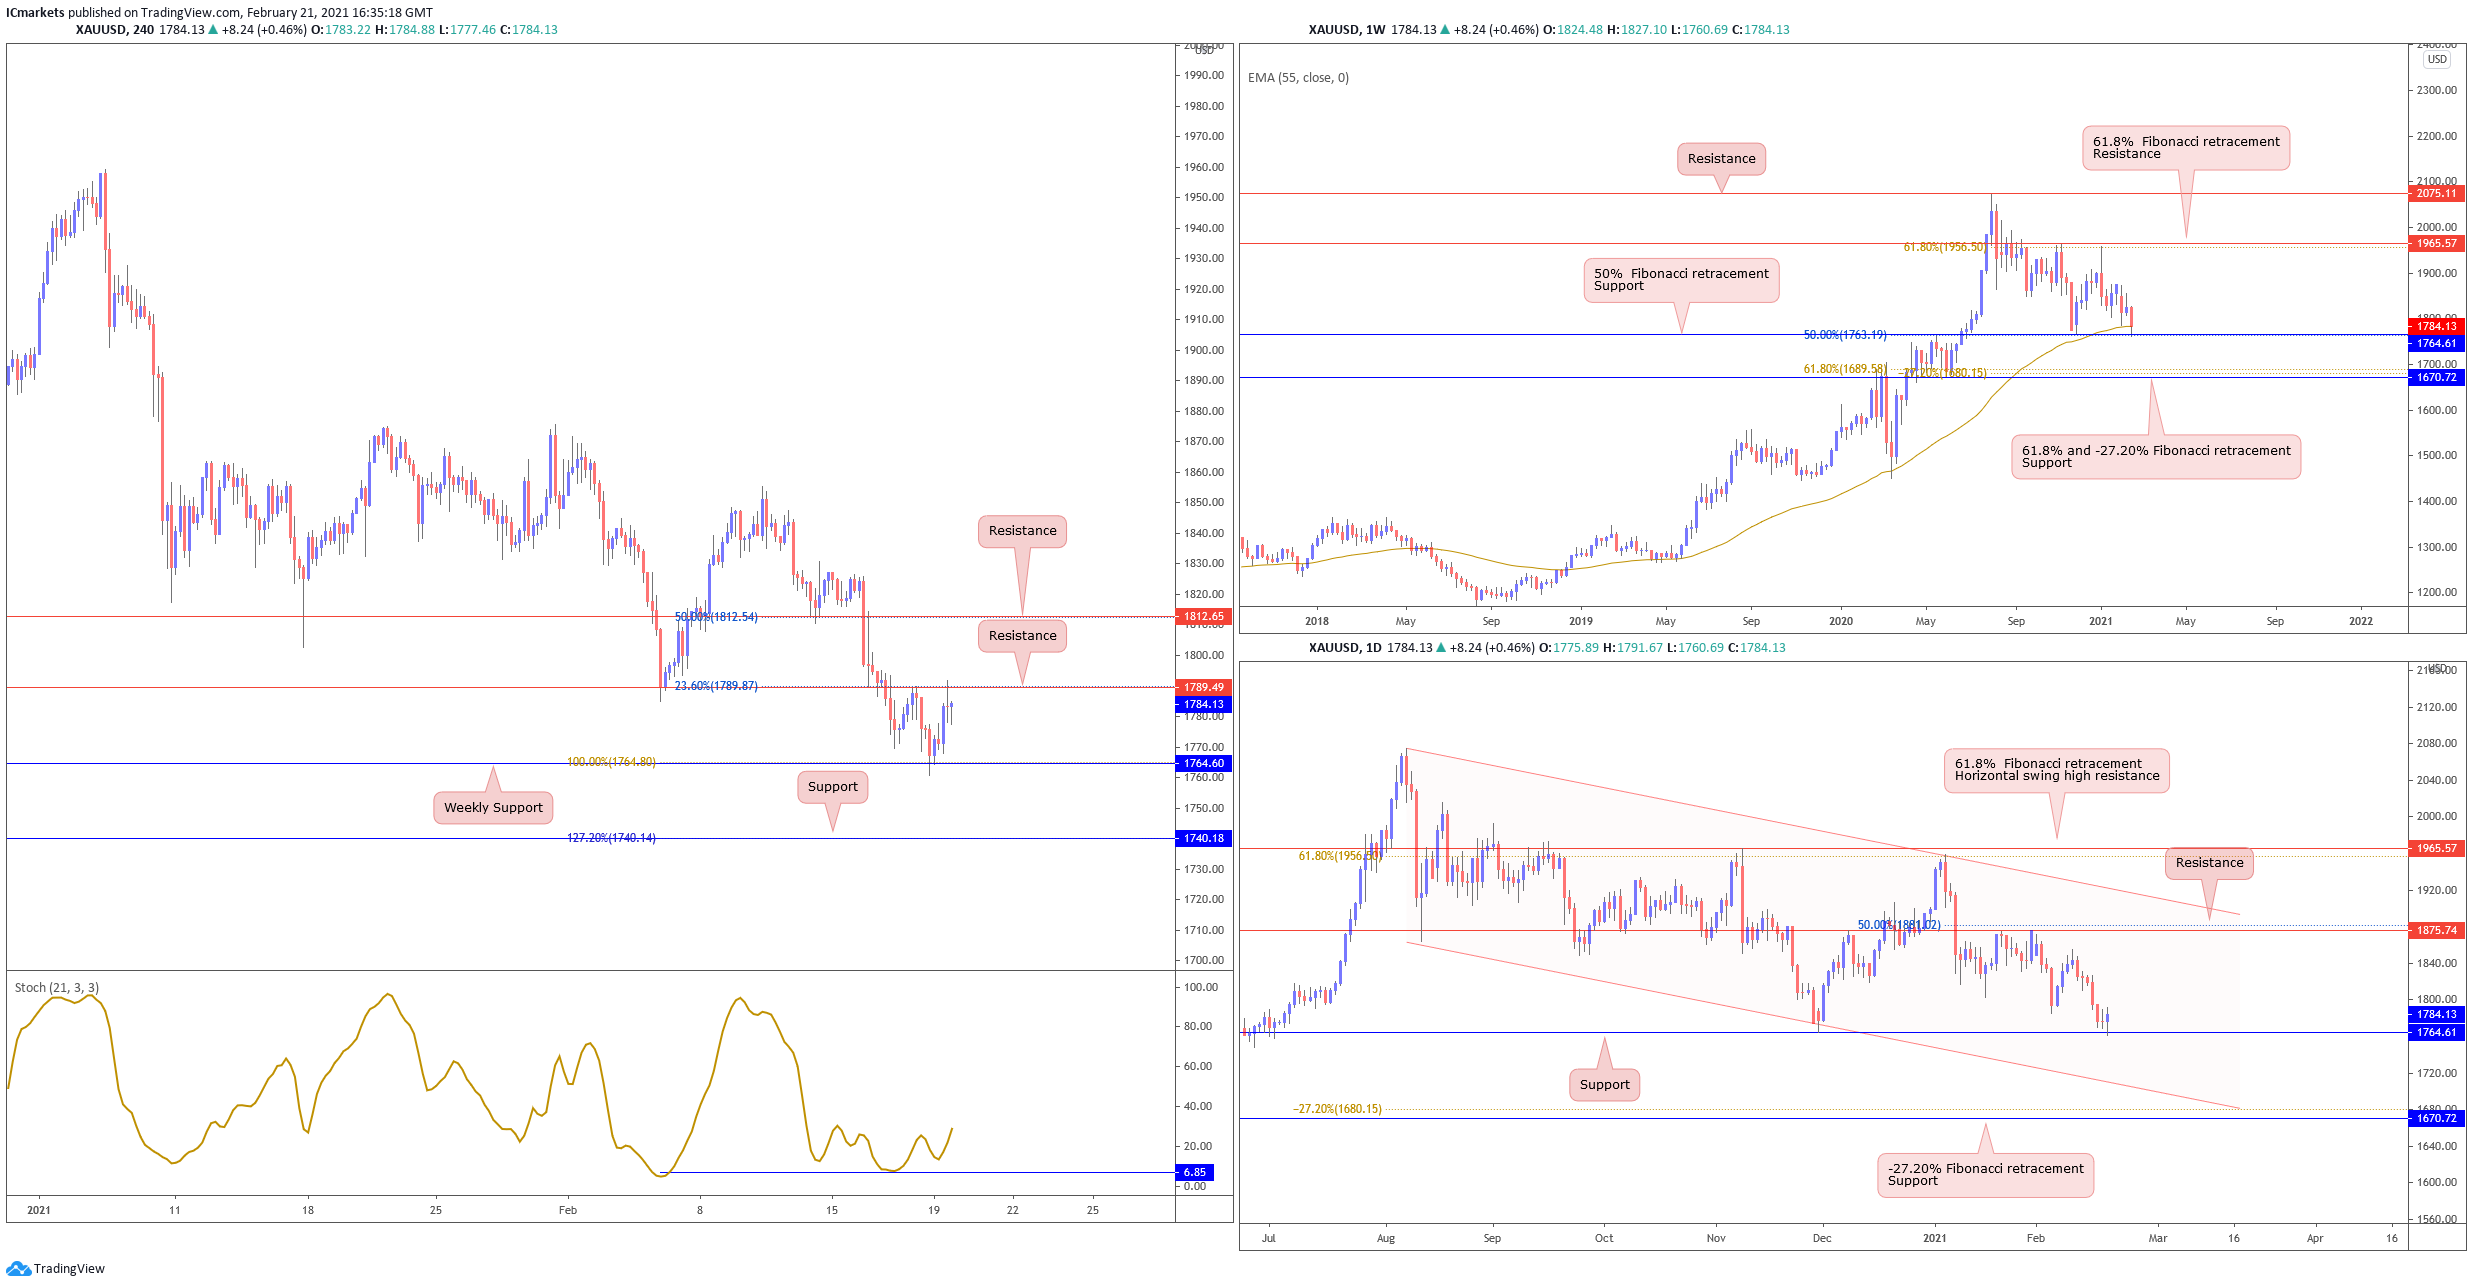
XAU/USD (GOLD):
On the weekly timeframe, gold is still holding above long term moving average support and tested 1764 support, above which there could be a possibility of a bounce reaction. On the daily chart, with price now testing and reacting above 1764 support, buyers could possibly consider this level and add to their longs while looking at 1875 resistance as a possible target. Otherwise, we could see price breaking below 1764 and push towards descending channel support at 1670..
On the 4H timeframe, price is now holding between weekly support at 1764 and near term resistance at 1789. With stochastics on support, we see a medium probability scenario where 1789 resistance could very well be surpassed as buyers continue to add buying pressure to push price towards 1812 resistance. Otherwise, failure to break and close above 1789 will see price come back down to test 1764 support.
Areas of consideration:
- Watch closely key weekly support at 1764
The accuracy, completeness and timeliness of the information contained on this site cannot be guaranteed. IC Markets does not warranty, guarantee or make any representations, or assume any liability regarding financial results based on the use of the information in the site.
News, views, opinions, recommendations and other information obtained from sources outside of www.icmarkets.com.au, used in this site are believed to be reliable, but we cannot guarantee their accuracy or completeness. All such information is subject to change at any time without notice. IC Markets assumes no responsibility for the content of any linked site.
The fact that such links may exist does not indicate approval or endorsement of any material contained on any linked site. IC Markets is not liable for any harm caused by the transmission, through accessing the services or information on this site, of a computer virus, or other computer code or programming device that might be used to access, delete, damage, disable, disrupt or otherwise impede in any manner, the operation of the site or of any user’s software, hardware, data or property.


