
EUR/USD:
Weekly gain/loss: -0.52%
Weekly close: 1.1240
Weekly perspective:
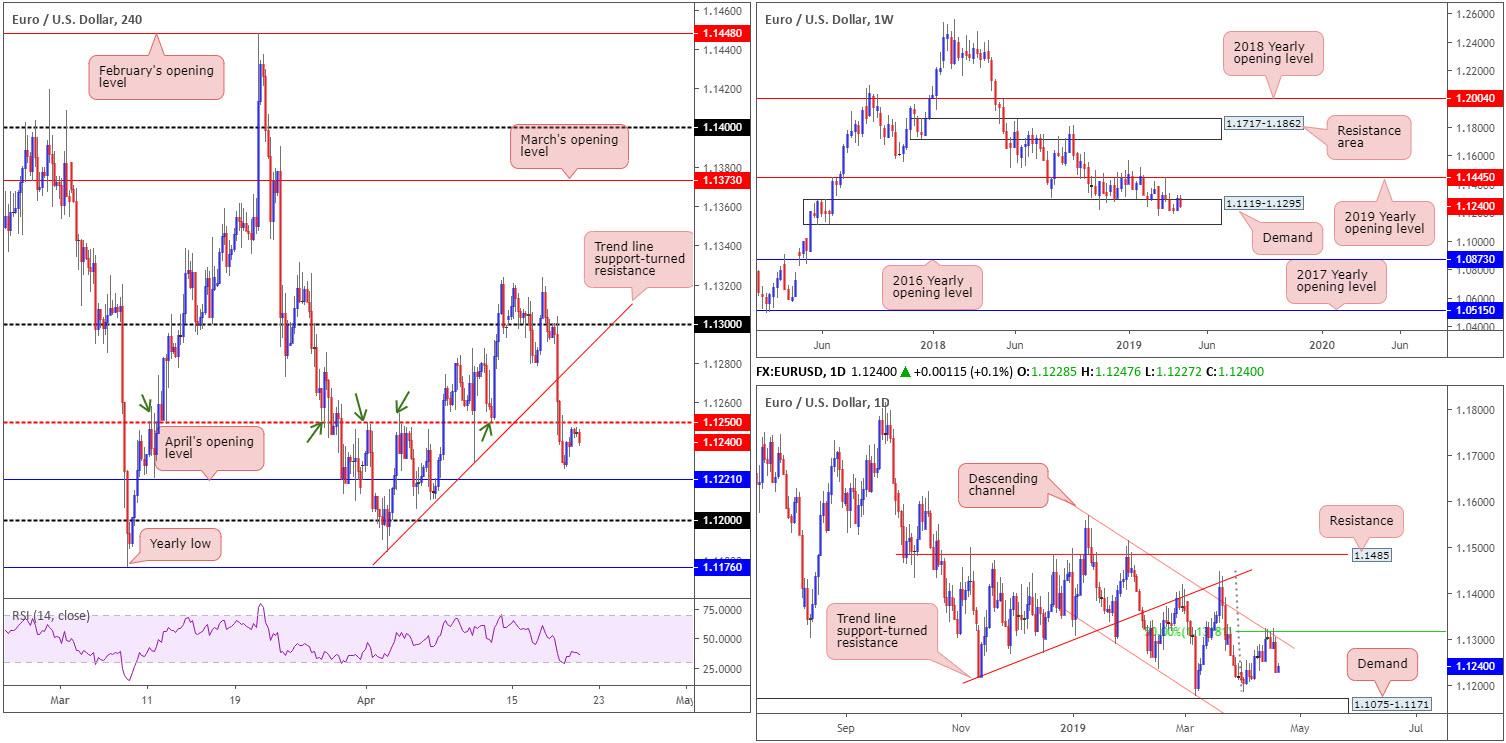
Overall it was a downbeat week for the shared currency, concluding trade closer to the lower end of the week’s 1.1323-1.1226 range. Structurally, buyers and sellers remain warring for position within the walls of a reasonably long-standing demand area at 1.1119-1.1295, though buyers appear fragile at this point.
A break of the current demand zone to the downside has the 2016 yearly opening level at 1.0873 to target, whereas a recovery higher may call for a retest of the 2019 yearly opening level at 1.1445.
Daily perspective:
Counter to weekly demand, price action on the daily timeframe shook hands with channel resistance (extended from the high 1.1569) and a merging 50.0% resistance value at 1.1318 last week. Thursday’s near-full-bodied response may spur additional selling this week, targeting the 1.1183 Apr 2 low, shadowed closely by demand at 1.1075-1.1171 (glued to the underside of the current weekly demand area).
H4 perspective:
A brief recap of Friday’s segment on the H4 timeframe witnessed thin trading volume amid Good Friday. Following a mild bottom a few points north of April’s opening level at 1.1221, the EUR/USD spent the remainder of the day fluctuating within a tight range just below 1.1250. A bulk of the pair’s weekly losses is attributed to Thursday’s dismal PMIs.
Areas of consideration:
Today’s activity is expected to remain quiet with the majority of Europe’s financial hubs observing Easter Monday.
Moving into Tuesday’s sessions, however, 1.1250 is likely to offer the market resistance, given its recent history (green arrows). Do bear in mind, though, the level houses limited confluence on either the H4 timeframe or the bigger picture. For that reason, a short-term bounce from here to 1.1221 might be all that’s offered.
Higher-timeframe structure unfortunately provides little in terms of meaningful direction. Despite the week’s losses, weekly price still may recover out of its demand zone. This, nevertheless, is opposed by daily action proposing further selling within in its current descending channel.
Today’s data points: Bank Closures In Observance Of Easter Monday.
GBP/USD:
Outlook unchanged due to lacklustre movement.
Weekly gain/loss: -0.55%
Weekly close: 1.2992
Weekly perspective:
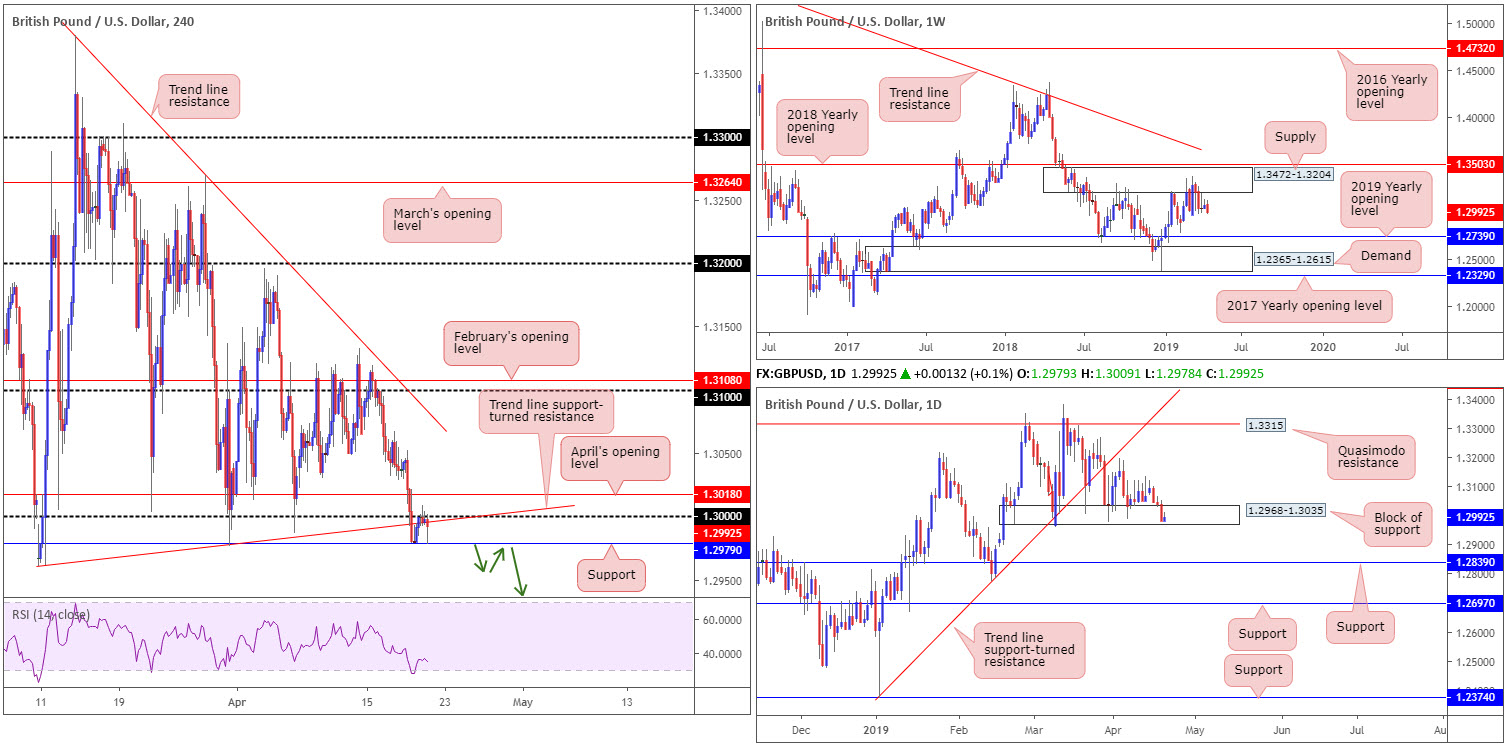
Since the end of February, the underside of supply at 1.3472-1.3204, situated a few points south of the 2018 yearly opening level at 1.3503, has been home to many traders. With the next obvious downside target not realised on this timeframe until the 2019 yearly opening level at 1.2739, followed by demand coming in at 1.2365-1.2615, sellers still have plenty of room to manoeuvre if they press lower.
Daily perspective:
Against the backdrop of weekly flow, daily activity remains teasing a block of support at 1.2968-1.3035. Buying from here, nevertheless, has dwindled over the past month, emphasising weakness each time the area has been tested (failed to print higher highs). In the event the current support zone fails, as weekly structure suggests, support coming in at 1.2839 is in sight, alongside another layer of support at 1.2697 (at this point we’ll be trading below the 2019 yearly opening level on the weekly timeframe).
H4 perspective:
Friday’s action traded lifeless on the H4 timeframe between support priced in at 1.2979 and key figure resistance 1.30 (along with merging trend line support-turned resistance [extended from the low 1.2960]), as many financial hubs closed in observance of Good Friday.
The odds of the H4 candles respecting the current support are low, according to our technical studies. Should we eventually press beneath 1.2979, the next downside target falls in at demand drawn from 1.2891-1.2926, which happens to house 1.29 within (not seen on the screen).
Areas of consideration:
On account of the above, sellers still appear to have the upper hand. Should the analysis turn out correct and H4 action closes beneath its current support at 1.2979, a retest to the underside of this level as resistance (green arrows) could serve as an ideal platform for shorts today/early week, targeting the H4 demand highlighted above at 1.2891-1.2926.
Traders looking to add a little more confirmation to the mix from 1.2979 might look for a H4 bearish candlestick to form on the retest. Not only will this help confirm seller intent from this angle, it’d provide entry/risk levels to work with.
Today’s data points: Bank Closures In Observance Of Easter Monday.
AUD/USD:
Outlook unchanged due to lacklustre movement.
Weekly gain/loss: -0.33%
Weekly close: 0.7147
Weekly perspective:
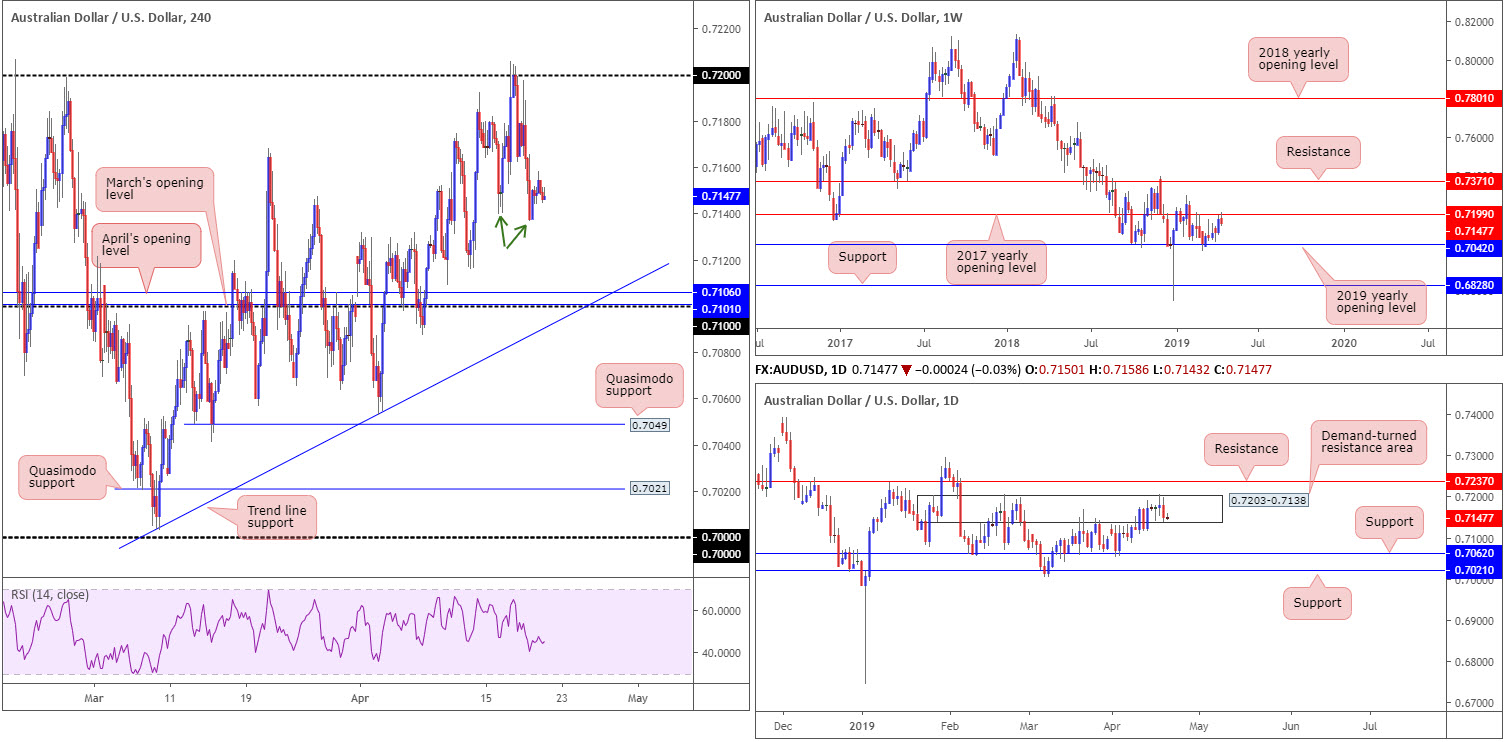
Since mid-February, the weekly candles have been carving out a reasonably tight consolidation between the 2017/2019 yearly opening levels at 0.7199/0.7042. As you can see, last week’s movement concluded fading the upper limit of this range, therefore the outlook on this scale potentially bodes well for sellers this week.
Daily perspective:
In conjunction with weekly flow, a daily demand-turned resistance zone at 0.7203-0.7138 is in motion, potentially setting the stage for a run in the direction of support priced in at 0.7062 this week, trailed closely by another film of support at 0.7021.
H4 perspective:
In light of Friday’s lacklustre performance, owing to holiday-thinned volume, much of today’s briefing will echo thoughts put forward in Friday’s report…
Wednesday’s failure to sustain gains beyond 0.72 on the H4 timeframe saw the commodity-linked currency extend its downside presence Thursday, largely in response to healthy USD demand.
A closer reading of price action on the H4 timeframe witnessed the candles break 0.7139 to the downside Thursday (the April 16 low – green arrows). In response to the research team noting this as an important move (largely due to 0.7139 being the last obvious low preceding Wednesday’s 0.7205 high), further selling could be on the cards to 0.71. Note this psychological number is closely associated with April and March’s opening levels at 0.7106/0.7101 and a trend line support (taken from the low 0.7003).
Areas of consideration:
A H4 bullish candlestick signal printed from 0.71 (entry/risk levels can be determined according to this structure) is, according to local confluence highlighted above, a high-probability support level. Whether or not this number will enter the mix today, though, is difficult to judge given the possibility of below-average volume on account of Easter Monday.
As for selling at current price, aside from a retest of 0.72, the research team notes limited resistance to base a sell from. This is unfortunate considering both weekly and daily timeframes indicate seller intent.
Today’s data points: Bank Closures In Observance Of Easter Monday.
USD/JPY:
Outlook unchanged due to lacklustre movement.
Weekly gain/loss: -0.08%
Weekly close: 111.91
Weekly perspective:
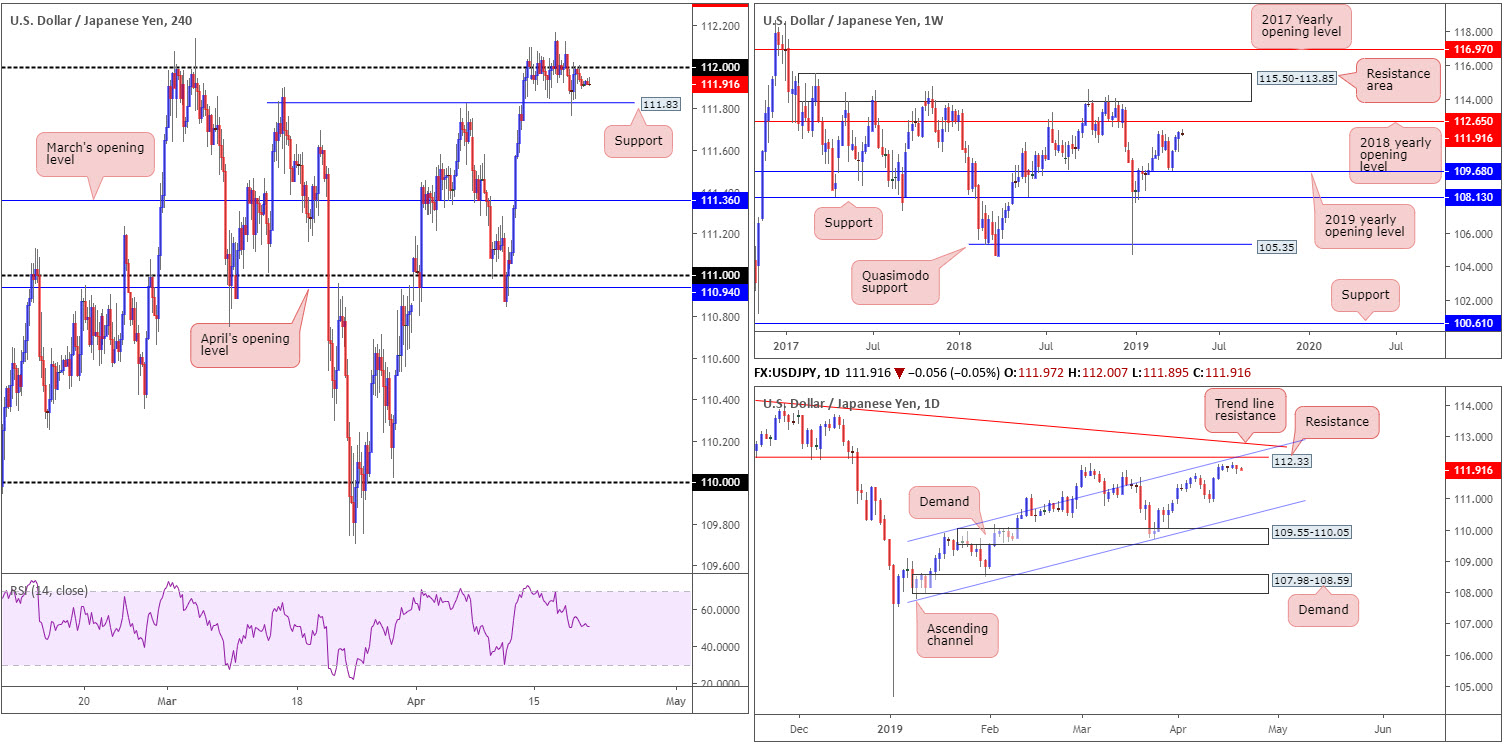
Since the beginning of the week, the USD/JPY has stressed somewhat of a subdued tone, wrapping up in the shape of a clear-cut indecision candle.
The unit currently has the candles facing the March 4 high at 112.13, shadowed closely by the 2018 yearly opening level priced in at 112.65.
Daily perspective:
Crossing over to daily structure, the research team notes the 112.33 resistance level, which happens to fuse with a channel resistance (drawn from the high 109.88), and a nearby trend line resistance (etched from the high 114.54).
H4 perspective:
According to H4 flow, price action spent the week narrowly flipping between gains/losses around 112, with the unit concluding trade marginally beneath the psychological mark. As today’s activity is expected to remain quiet with the majority of Europe’s financial hubs observing Easter Monday, traders are reminded support remains situated nearby at 111.83: a Quasimodo resistance-turned support. Above 112, traders’ crosshairs are likely fixed on daily resistance coming in at 112.33 (not visible on the H4 timeframe).
Areas of consideration:
Daily resistance at 112.33 appears a prime location for shorts in this market, according to our technical reading, with stop-loss orders plotted beyond the daily trend line resistance highlighted above. The only caveat to this, aside from a reasonably strong trending market at the moment (clearly visible on the daily timeframe), is weekly price threatening to press as far north as 112.65. For that reason, before pulling the trigger on a sell from 112.33, traders are recommended to wait for additional confirmation. This could be anything from a moving average crossover, a H4 bearish candlestick signal or even drilling down to the lower timeframes and trading local structure.
Today’s data points: Bank Closures In Observance Of Easter Monday.
The accuracy, completeness and timeliness of the information contained on this site cannot be guaranteed. IC Markets does not warranty, guarantee or make any representations, or assume any liability with regard to financial results based on the use of the information in the site.
News, views, opinions, recommendations and other information obtained from sources outside of www.icmarkets.com.au, used in this site are believed to be reliable, but we cannot guarantee their accuracy or completeness. All such information is subject to change at any time without notice. IC Markets assumes no responsibility for the content of any linked site. The fact that such links may exist does not indicate approval or endorsement of any material contained on any linked site.
IC Markets is not liable for any harm caused by the transmission, through accessing the services or information on this site, of a computer virus, or other computer code or programming device that might be used to access, delete, damage, disable, disrupt or otherwise impede in any manner, the operation of the site or of any user’s software, hardware, data or property.


