
Key risk events today:
Fed Chair Powell Speaks.
(Previous analysis as well as outside sources – italics).
EUR/USD:
Weekly gain/loss: -0.05%
Weekly close: 1.1837
Weekly perspective:
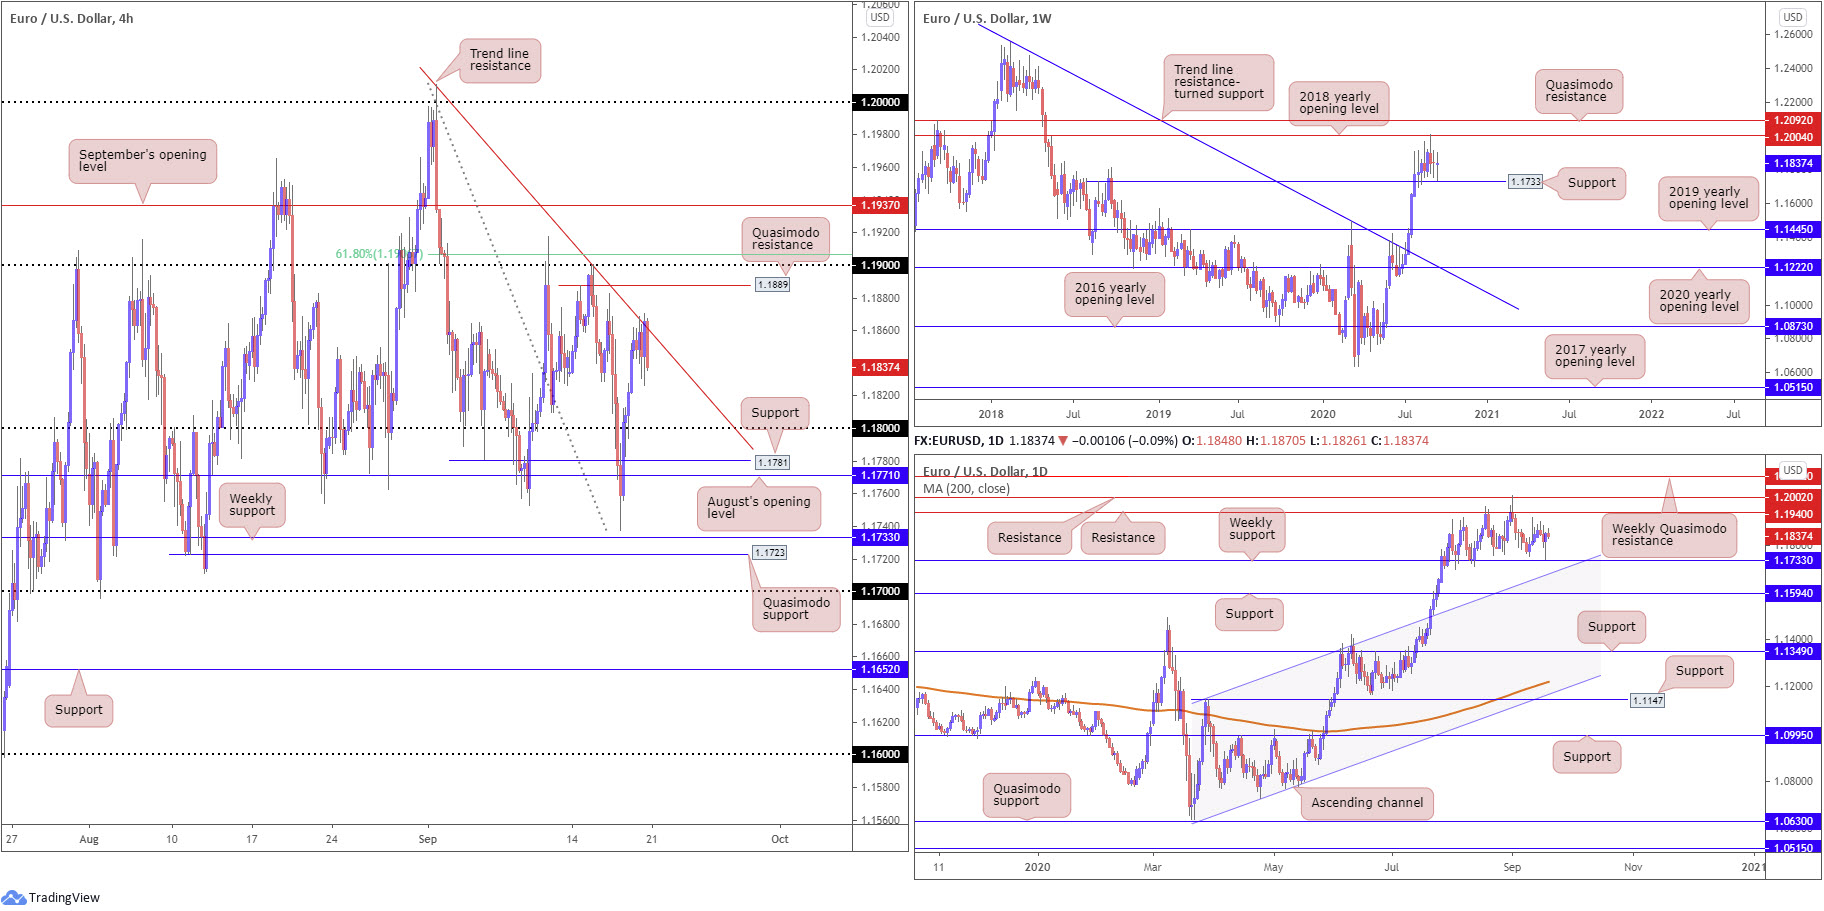
July, as you can see, witnessed vigorous upside, movement that ousted trend line resistance, taken from the high 1.2555, and the 2019 yearly opening value at 1.1445.
Since then we’ve seen momentum noticeably slow, despite dipping a toe in waters above Quasimodo resistance at 1.1733. The latter has served well as support, with price also recently taking on resistance at 1.2004, the 2018 yearly opening value sited just south of Quasimodo resistance priced in at 1.2092.
Consequently, 1.1733 and 1.2004 remain two prominent areas worth monitoring this week.
Daily perspective:
Since transitioning into the month of August, weekly support (1.1733) has proven effective, as has daily resistance coming in at 1.1940 and 1.2002.
Passing 1.2002 shifts focus to the weekly Quasimodo resistance stated above at 1.2092, whereas dipping sub 1.1733 on the daily scale welcomes channel resistance-turned support, extended from the high 1.1147.
Candlestick supporters will also acknowledge price movement pencilled in a hammer candlestick pattern a few pips ahead of the weekly support level on Thursday (bullish indication), though Friday lacked follow-through momentum. An opposite picture is visible on the DXY’s daily timeframe, generating a shooting star candle pattern on Thursday with limited downside seen thereafter.
H4 perspective:
Europe’s single currency entered an indecisive phase Friday, following Thursday’s move higher, which as we know finished in the shape of a daily hammer candlestick formation.
Trading north of 1.18, Friday directed focus to trend line resistance, extended from the high 1.2010. Buyers, as you can see, failed to muster enough strength to overthrow the trend line, suggesting a retreat to 1.18 this week. Absorbing selling pressure here, nevertheless, moves Quasimodo resistance at 1.1889 in sight, as well as the psychological band 1.19 and a 61.8% Fibonacci retracement ratio at 1.1906.
Areas of consideration:
- Similar to Friday’s outlook, H4 Quasimodo resistance at 1.1889 may appeal to sellers this week. Not only is the level arranged a few pips south of the 1.19 handle and 61.8% resistance, the pair recently came off fresh lows on the H4 scale (1.1737), proposing strength to the downside. Furthermore, any stops consumed above the H4 trend line resistance and minor swing high at 1.1882 (September 16) is likely to provide sellers liquidity (buy stops).
- September’s opening value at 1.1937 on the H4 is also interesting. Buy-stop liquidity above 1.19, together with daily resistance merging at 1.1940, is likely to see 1.1937 command attention should we reach this far north.
GBP/USD:
Weekly gain/loss: +0.93%
Weekly close: 1.2913
Weekly perspective:
Sterling finished the week up 120 pips, making a stand just north of support at 1.2739, a 2019 yearly opening value at 1.2739, alongside trend line resistance-turned support, extended from the high 1.5930.
Reclaiming a portion of the prior week’s near-500-pip decline and snapping a two-week bearish phase, technical studies project room to advance as far north as the 2020 yearly opening value at 1.3250.
Crossing through 1.2739 this week, however, unseals a potential bearish scenario, targeting the 1.2251 June 29 low, closely shadowed by Quasimodo support priced in at 1.2163.
Daily perspective:
Four out of five sessions concluded in positive territory last week, deriving impetus from support at 1.2769, fixed just ahead of the 200-day SMA (orange – 1.2729).
Price, as you can see, topped a few pips beneath resistance at 1.3017, with Friday pulling across a bearish close. Reaching for higher territory this week shines the spotlight on resistance around 1.3200, yet further dips elbows 1.2769 back into view.
H4 perspective:
Last week’s technical writing highlighted the possibility of resistance emerging from the 1.30 handle, a widely watched psychological level. What was also technically appealing here was additional H4 resistance at 1.3009 and daily resistance seen at 1.3017.
Mid-week onwards, 1.3017/1.30 attracted healthy selling interest, withstanding a number of upside attempts and forcing 100-pip moves to 1.29.
As we transition into a fresh week, 1.3017/1.30 remains in focus. Any sustained move above the area positions resistance at 1.3064 on the hit list, a prior Quasimodo support level, and August’s opening value at 1.3078. Cutting through 1.29, on the other hand, throws 1.28 into the pot as the next possible support target.
Areas of consideration:
- 1.3017/1.30 (H4 red) remains active on account of its neighbouring confluence. Therefore, additional bearish scenarios may form from this zone this week.
- Rupturing the aforementioned area, however, signals H4 buyers may attempt to approach resistance at 1.3064, closely shadowed by August’s opening level at 1.3078 and the 1.31 handle. This, of course, is in line with weekly structure which displays room to advance.
- Pushing through 1.29 sends across an intraday bearish signal, indicating weakness from weekly buyers and strength from daily sellers south of 1.3017. As such, a H4 close beneath 1.29 this week may be enough to draw in breakout sellers to pull to 1.28.

AUD/USD:
Weekly gain/loss: +0.10%
Weekly close: 0.7289
Weekly perspective:
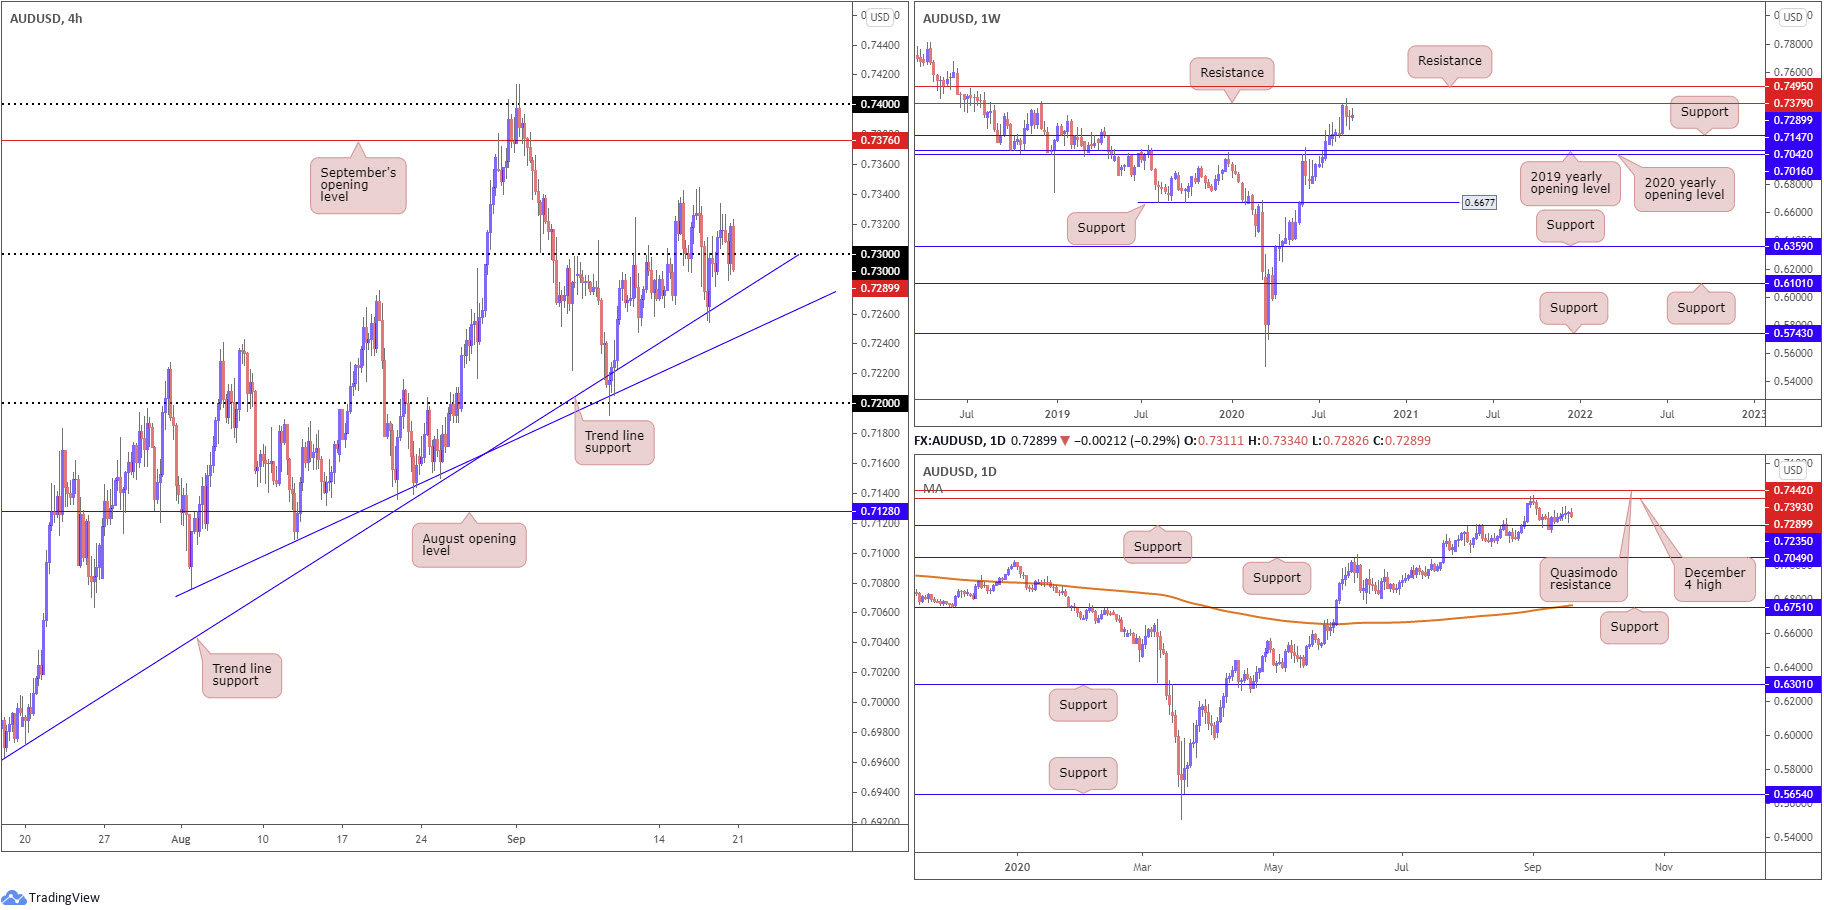
Sellers south of resistance at 0.7379 demonstrate fragile posture, recently failing to sustain momentum past 0.7191 and consequently leaving support from 0.7147 unchallenged.
Having seen this market trend higher since bottoming at 0.5506 in March, the odds of price eventually surging through current resistance and heading for another layer of resistance at 0.7495 remain high. Exploring under 0.7147, however, shines focus on the 2020 and 2019 yearly opening values at 0.7016 and 0.7042, respectively.
Daily perspective:
Heading into September has seen price glean moderate support from 0.7235, though recent movement slowed considerably, echoing uncertainty.
Resistance at 0.7393 (December 4 high) commands attention in the event further buying develops this week, a level that capped YTD peaks. Note we also have Quasimodo resistance plotted close by at 0.7442.
Overthrowing 0.7235 shifts attention to as far south as support at 0.7049.
H4 perspective:
0.73 played a key technical role last week, delivering both support and resistance. Another level that demanded attention was trend line support, extended from the low 0.6963, a barrier placed just north of another trend line support, etched from the low 0.7076.
Aside from peaks around 0.7342, September’s opening value at 0.7376 is marked as the next obvious resistance, followed by weekly resistance noted above at 0.7379 along with daily resistance (Dec 4 high) from 0.7393, and then 0.74.
Areas of consideration:
- A decisive H4 close above 0.73 is likely on watchlists this week, targeting September’s opening value at 0.7376.
- The trend line support, taken from the low 0.7076, may also draw attention, given the reasonably close relationship it has with daily support at 0.7235.
- Should a rally develop, movement that reaches September’s opening value at 0.7376, active selling may emerge from this region having noted its close connection with higher timeframe resistances.
USD/JPY:
Weekly gain/loss: -1.50%
Weekly close: 104.55
Weekly perspective:
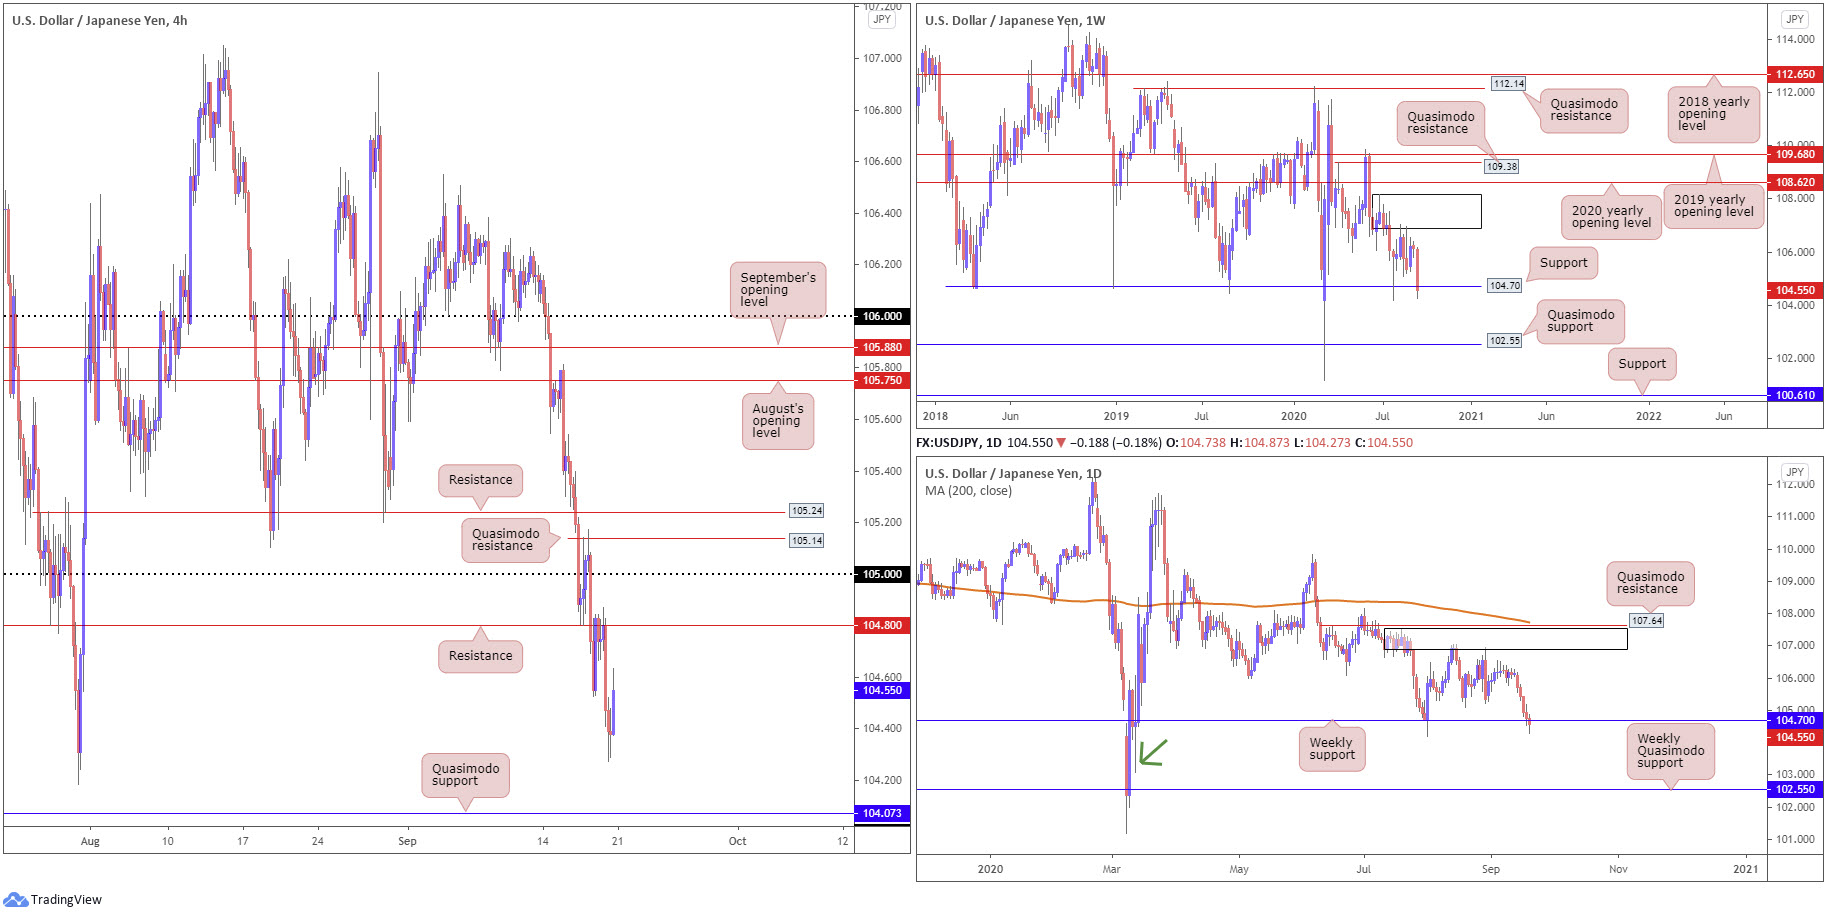
Supply at 108.16-106.88 remains prominent, capping upside since price made its way off support at 104.70 at the end of July.
As evident from the weekly chart, the pair fell sharply last week, retreating more than 150 pips. This manoeuvred price into support at 104.70, clocking fresh lows at 104.27. Should sellers maintain control this week, Quasimodo support at 102.55 offers a feasible target.
Daily perspective:
Supply at 107.55/106.89, an area housed within the lower boundary of weekly supply mentioned above at 108.16-106.88, has proved tough to overthrow.
The steep decline, shaped by five consecutive daily bearish candles, over the course of last week conquered lows around 105.20 to address weekly support underlined above at 104.70. A relatively clear path is seen beyond 104.70 on the daily scale to the weekly Quasimodo formation at 102.55, though the 103.08 spike formed March 12 could offer some support (green arrow).
H4 perspective:
Friday scaled lower from resistance at 104.80 going into European trading and bottomed at lows from 104.27, a touch north of Quasimodo support at 104.07. The second half of the US session witnessed the pair reclaim a portion of earlier losses, redirecting action to within shouting distance of 104.80.
105 is seen as the next port of resistance above 104.80, with a break exposing Quasimodo resistance at 105.14 and another layer of resistance close by at 105.24.
Areas of consideration:
- Despite last week’s downward pressure, weekly support at 104.70 may offer some respite this week. A daily bullish candlestick pattern printed from the support is likely to stimulate buyer intent.
- Buyers will likely meet resistance around 104.80 on the H4, followed by 105. Some traders may interpret 105/104.80 as a sell zone, in view of the current downtrend; others, however, will be watching for a breach of 105 to seek bullish scenarios to tackle H4 resistances seen at 105.14/105.24.
USD/CAD:
Weekly gain/loss: +0.19%
Weekly close: 1.3198
Weekly perspective:
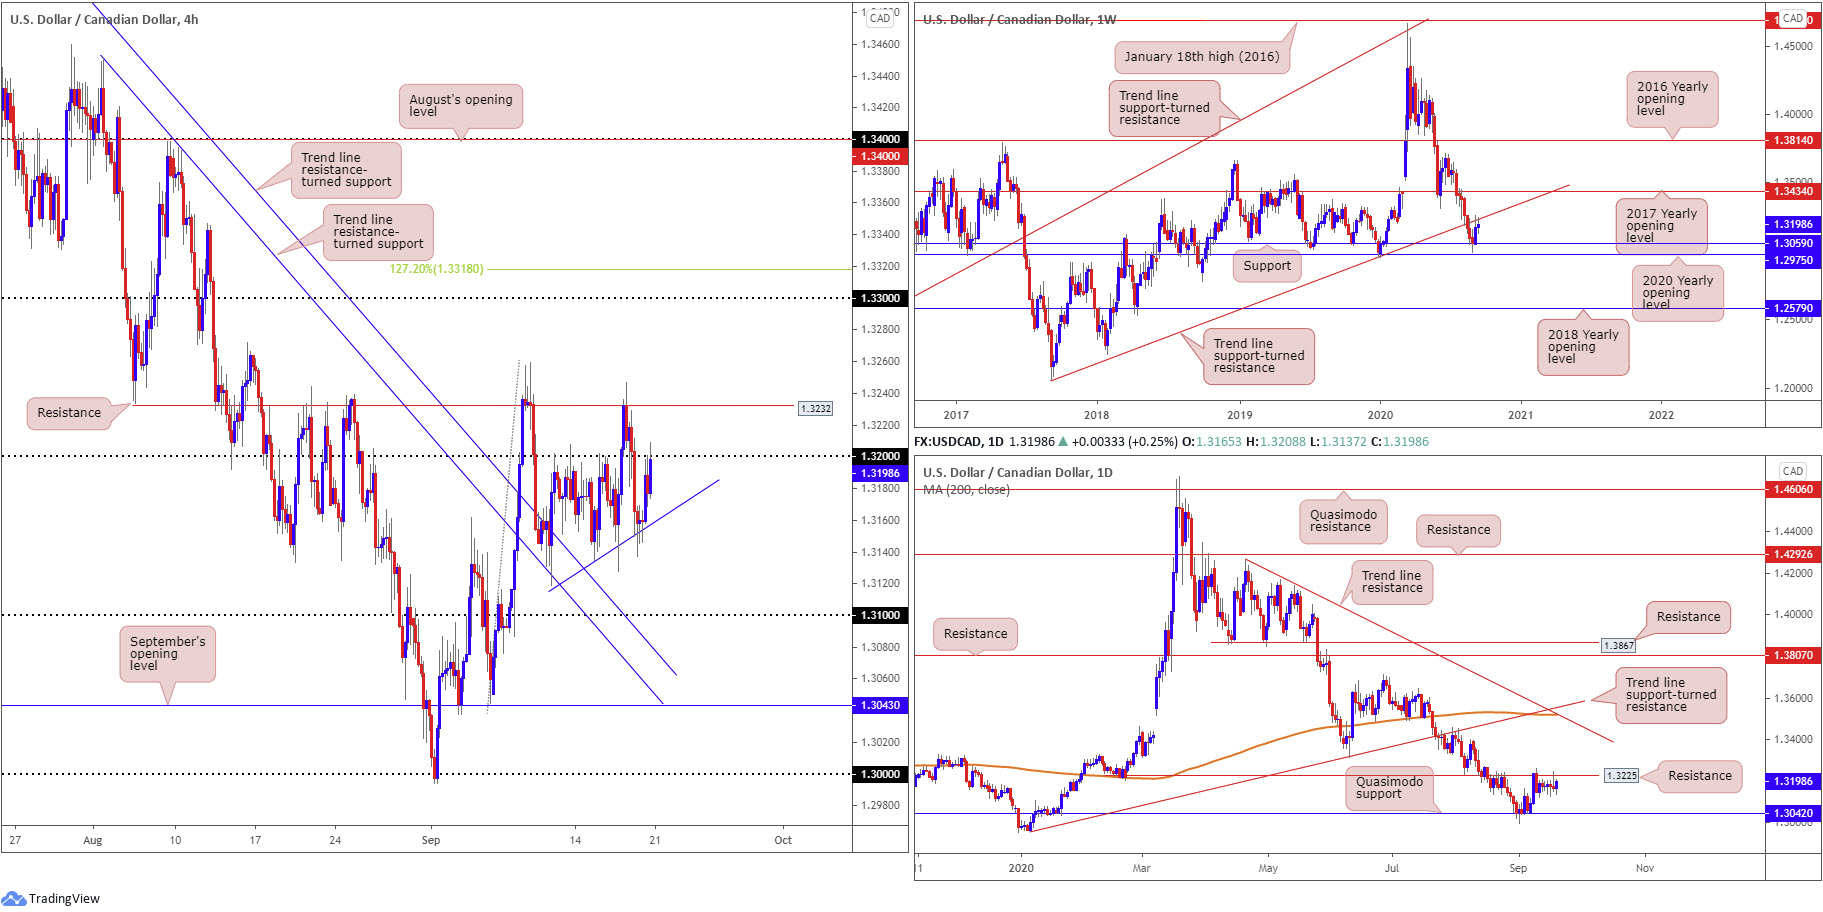
Following the prior week’s stronger-than-expected recovery off support at 1.3059, pinned just north of the 2020 yearly opening level at 1.2975, trend line support-turned resistance, taken from the low 1.2061, arrived on the scene. Although upside momentum has noticeably slackened here, recent trading managed to hold gains into the close.
Continued upside this week highlights the 2017 yearly opening level at 1.3434 as possible resistance.
Daily perspective:
Joining weekly support at 1.3059, Quasimodo support at 1.3042 on the daily timeframe added additional technical impetus. Resistance at 1.3225, a prior Quasimodo support, entered the fight shortly after the advance and has remained a relatively prominent feature on the daily scale since. Interest from the aforementioned resistance was expected, having seen the level merge with weekly trend line resistance.
In terms of resistance beyond 1.3225 this week, we do not see much to hang our hat on until crossing swords with trend line resistance, etched from the high 1.4265, which happens to align closely with the 200-day SMA (orange – 1.3518). Also in close view is trend line support-turned resistance, taken from the low 1.2957.
However, before reaching the said daily levels, we must contend with weekly resistance around 1.3434.
H4 perspective:
For those who read recent technical briefings you may recall the following (italics):
Seeking bullish scenarios above 1.32 on the H4 could prove frustrating, hindered by daily resistance from 1.3225 and H4 resistance at 1.3232. A sell-off from 1.3232/1.32, therefore, could EVENTUALLY take hold, bolstered by weekly price recently engaging trend line resistance (taken from the low 1.2061) and the market trending lower since mid-March. H4 sellers may be waiting for a close to form beyond local trend line support, drawn from the low 1.3119.
Areas of consideration:
Breakout buyers, as you can see, did indeed find difficulty above 1.32 last week, with 1.3232/1.32 establishing a ceiling. At the same time, though, local trend line support (H4 1.3119) proved stubborn, rejecting price action on Friday and fuelling a 1.32 retest.
- Beyond 1.3232 this week, buyers will likely be fixed on 1.33, followed closely by a 127.2% Fibonacci extension point at 1.3318.
- Breaking beyond H4 trend line support, nonetheless, may pull in fresh shorts to target 1.31.
USD/CHF:
Weekly gain/loss: +0.28%
Weekly close: 0.9112
Weekly perspective:
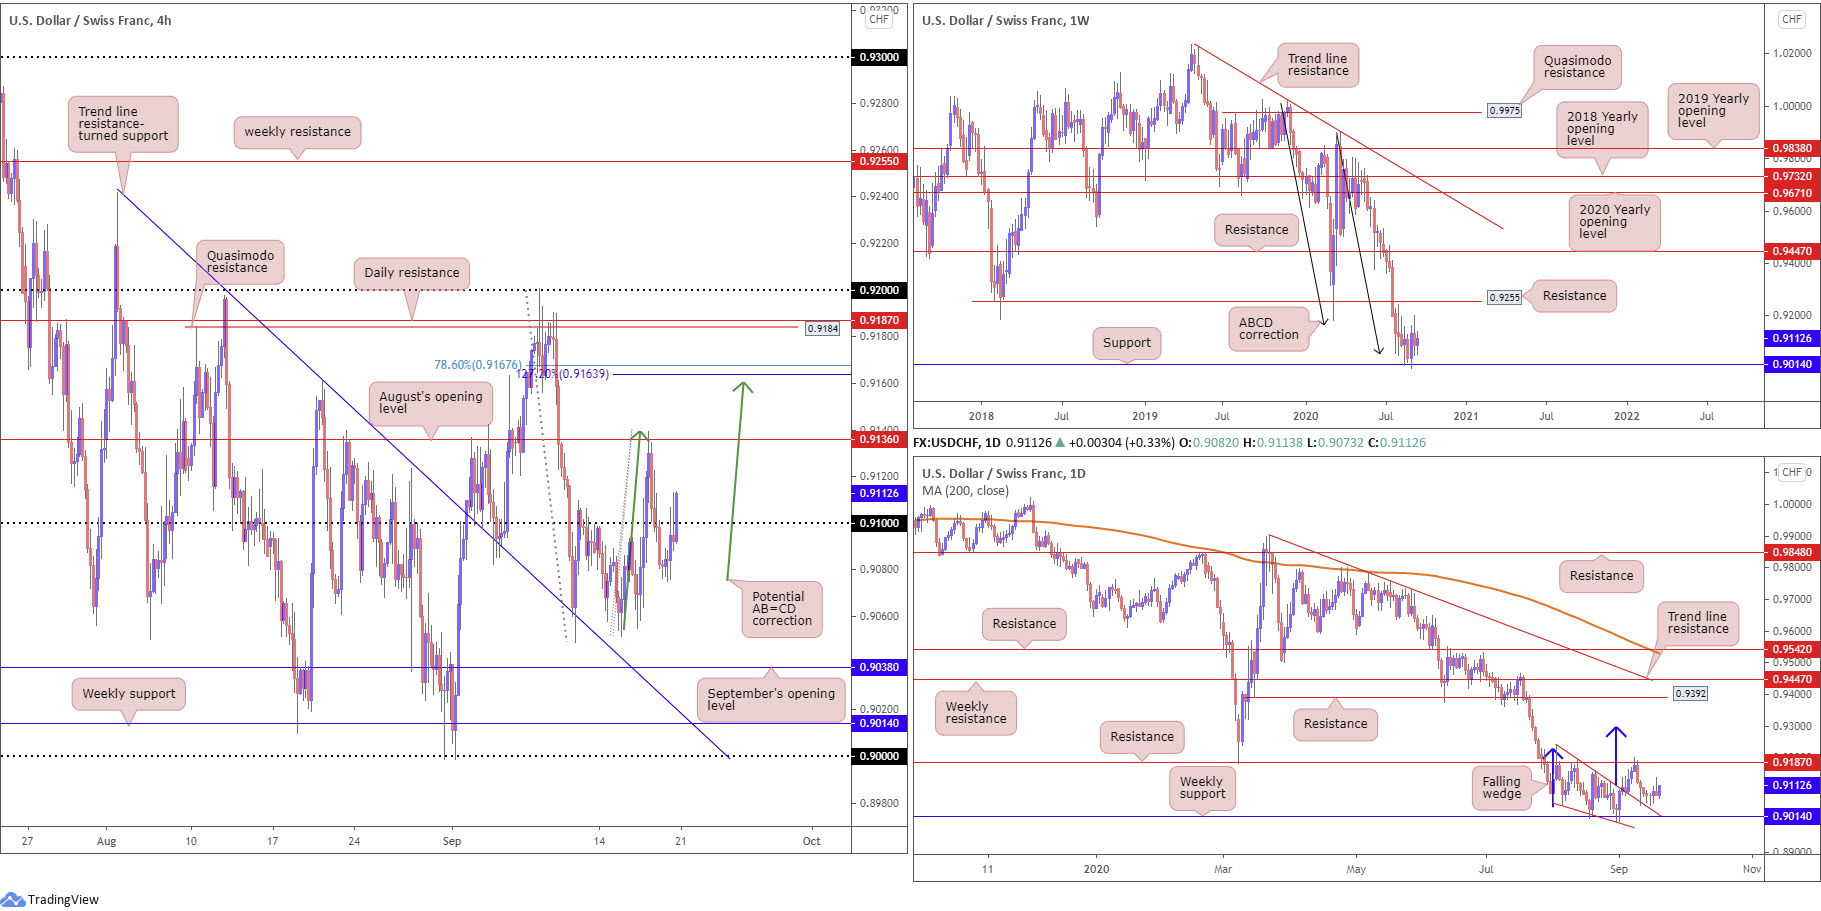
Technical movement on the weekly timeframe reveals buyers and sellers continue to battle for position north of support at 0.9014, potentially gleaning additional impetus from ABCD support at 0.9051 (black arrows).
Resistance at 0.9255, a previous Quasimodo support level, calls for attention should we transition north this week, whilst stepping through current support underscores 0.8799, another layer of support.
Daily perspective:
The beginning of September observed the upper border of a falling wedge pattern (drawn from the high 0.9241 and a low of 0.9056) give way, consequently unlocking a bullish reversal signal. Resistance at 0.9187 swiftly put a lid on gains, however, directing moves to just north of the falling wedge. Aside from Friday putting forward mild gains, the majority of the week fashioned indecisive daily candles.
Lifting from current price this week targets the aforementioned resistance; dips, nonetheless, brings in weekly support highlighted above at 0.9014.
H4 perspective:
Sellers failed to sustain downside momentum following 0.91 giving way Thursday, bottoming around the 0.9075 mark. Heading into the closing hours Friday, buyers secured position back above 0.91 in relatively dominant fashion, directing August’s opening value at 0.9136 back into sight.
Harmonic traders will acknowledge that a break of 0.9136 unlocks the possibility of an AB=CD bearish completion (green arrows) around 0.9160, closely shadowed by a 127.2% Fibonacci extension point at 0.9163 and a 78.6% Fibonacci retracement ratio at 0.9167.
Although closing above 0.91 signals bullish intent, prudent traders might still mark off support around lows at 0.9055, followed by September’s opening level at 0.9038.
Areas of consideration:
- H4 dipping a toe above 0.91 signals intraday strength and implies August’s opening value at 0.9136 could make an appearance today/early week. Should a 0.91 retest form, this may lure conservative buyers into the fight.
- If buyers push through August’s opening value this week, additional intraday buying could be seen to the H4 AB=CD completion around 0.9160ish.
- Longer term, the trend remains lower, though it would be unwise to overlook weekly support at 0.9051 and associated ABCD support.
Dow Jones Industrial Average:
Weekly gain/loss: +0.30%
Weekly close: 27727
Weekly perspective:
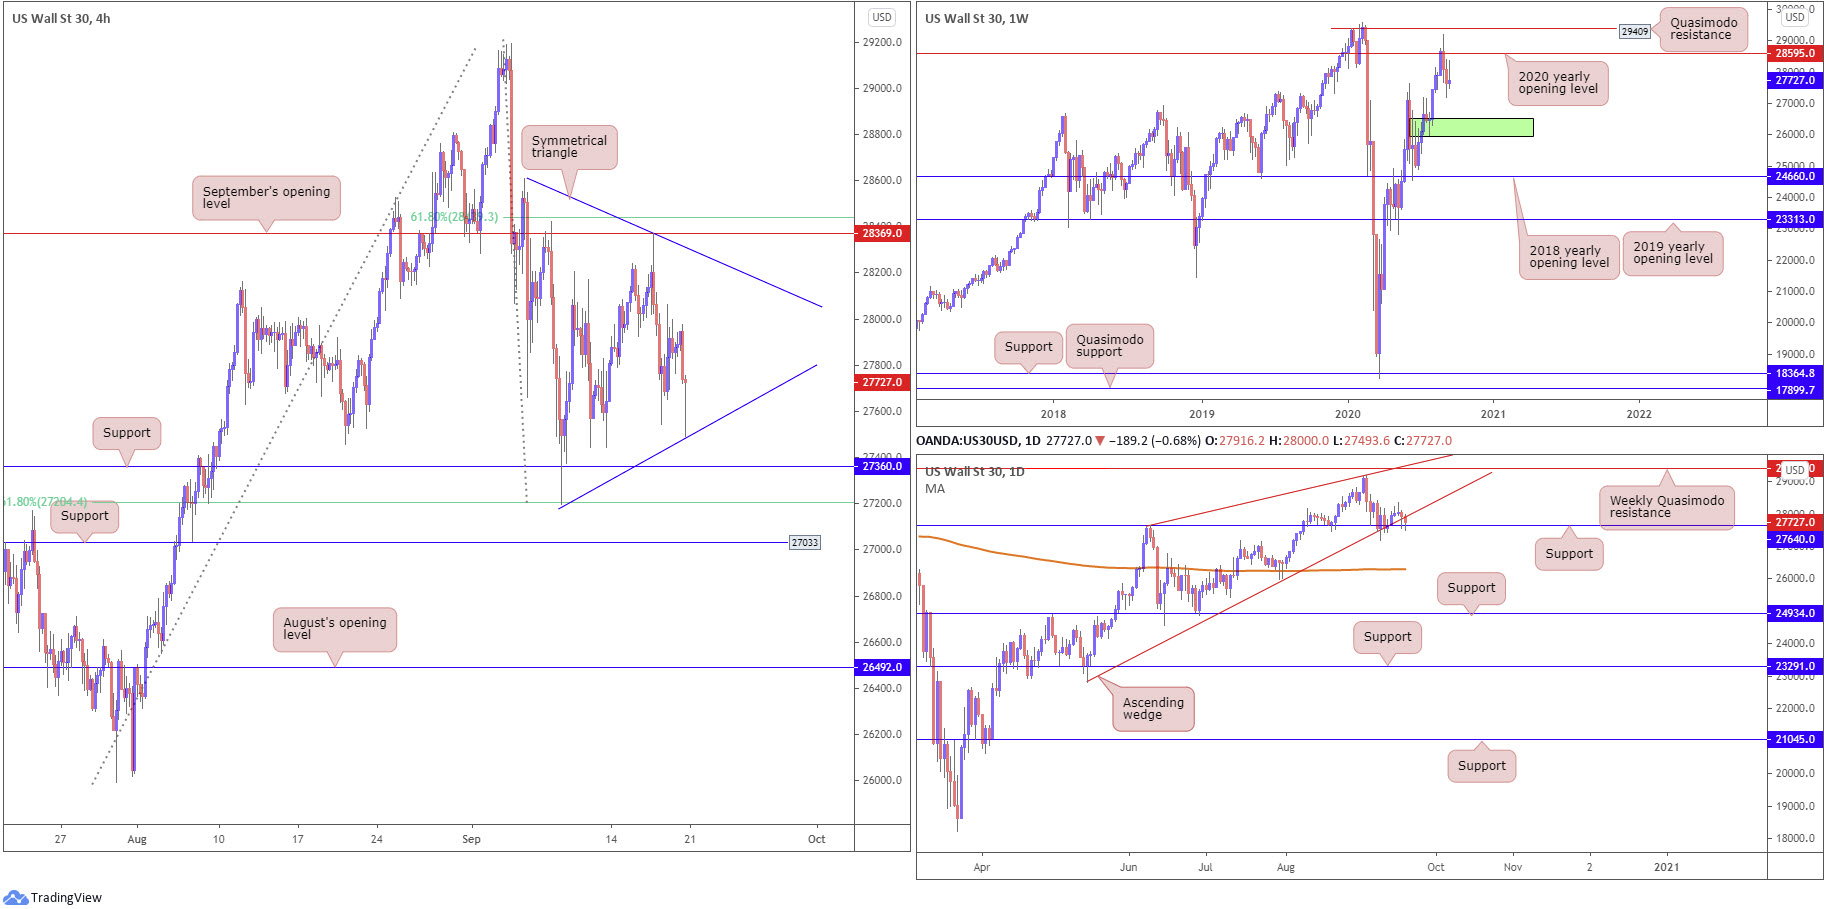
Price continues to languish south of the 2020 yearly opening value at 28595 (sited just under Quasimodo resistance at 29409), with last week finishing considerably off session peaks and establishing a notable selling wick.
Additional bearish sentiment this week advertises demand (green) at 25916-26523, an area active buyers may try and defend.
Daily perspective:
Recent trading saw price action elbow through the lower limit of an ascending wedge, taken from the low 22803.
Nearby support from 27640, however, remains in the frame.
Rupturing the aforementioned support could lead to price crossing paths with the 200-day SMA (orange – 26297), followed by a possible run to support priced in at 24934, while a recovery positions the 2020 yearly opening level at 28595 (weekly timeframe) in range.
H4 perspective:
US equities finished lower for a second straight day Friday as technology stocks weighed. The Dow Jones Industrial Average declined 244.56 points, or 0.88%; the S&P 500 dropped 37.54 points, or 1.12% and the Nasdaq traded lower by 117.00 points, or 1.07%.
Technically, Wednesday rejected September’s opening value at 28369, joined closely by a 61.8% Fibonacci retracement ratio at 28436, with sellers extending losses into the week’s end. To the downside, support is visible at 27360, also sharing space with a 61.8% Fibonacci retracement ratio at 27204.
Also interesting on the H4 chart is a symmetrical triangle forming between 28609/27195. Here, we can see neither buyers nor sellers are pushing price far enough to generate a clear trend.
Areas of consideration:
- With the lower limit of the daily ascending wedge giving way, sellers could take on daily support at 27640 this week and force a H4 close outside of the symmetrical triangle. This may produce strong downside.
- September’s opening value at 28369 and the 61.8% Fibonacci retracement at 28436 on the H4 represents a resistance zone to keep eyes on.
- Support at 27360 and the 61.8% Fibonacci retracement ratio at 27204 on the H4 scale might also offer a floor for buyers, and possibly halt downside out of the symmetrical triangle.
XAU/USD (GOLD):
Weekly gain/loss: +0.52%
Weekly close: $1,950
Weekly perspective:
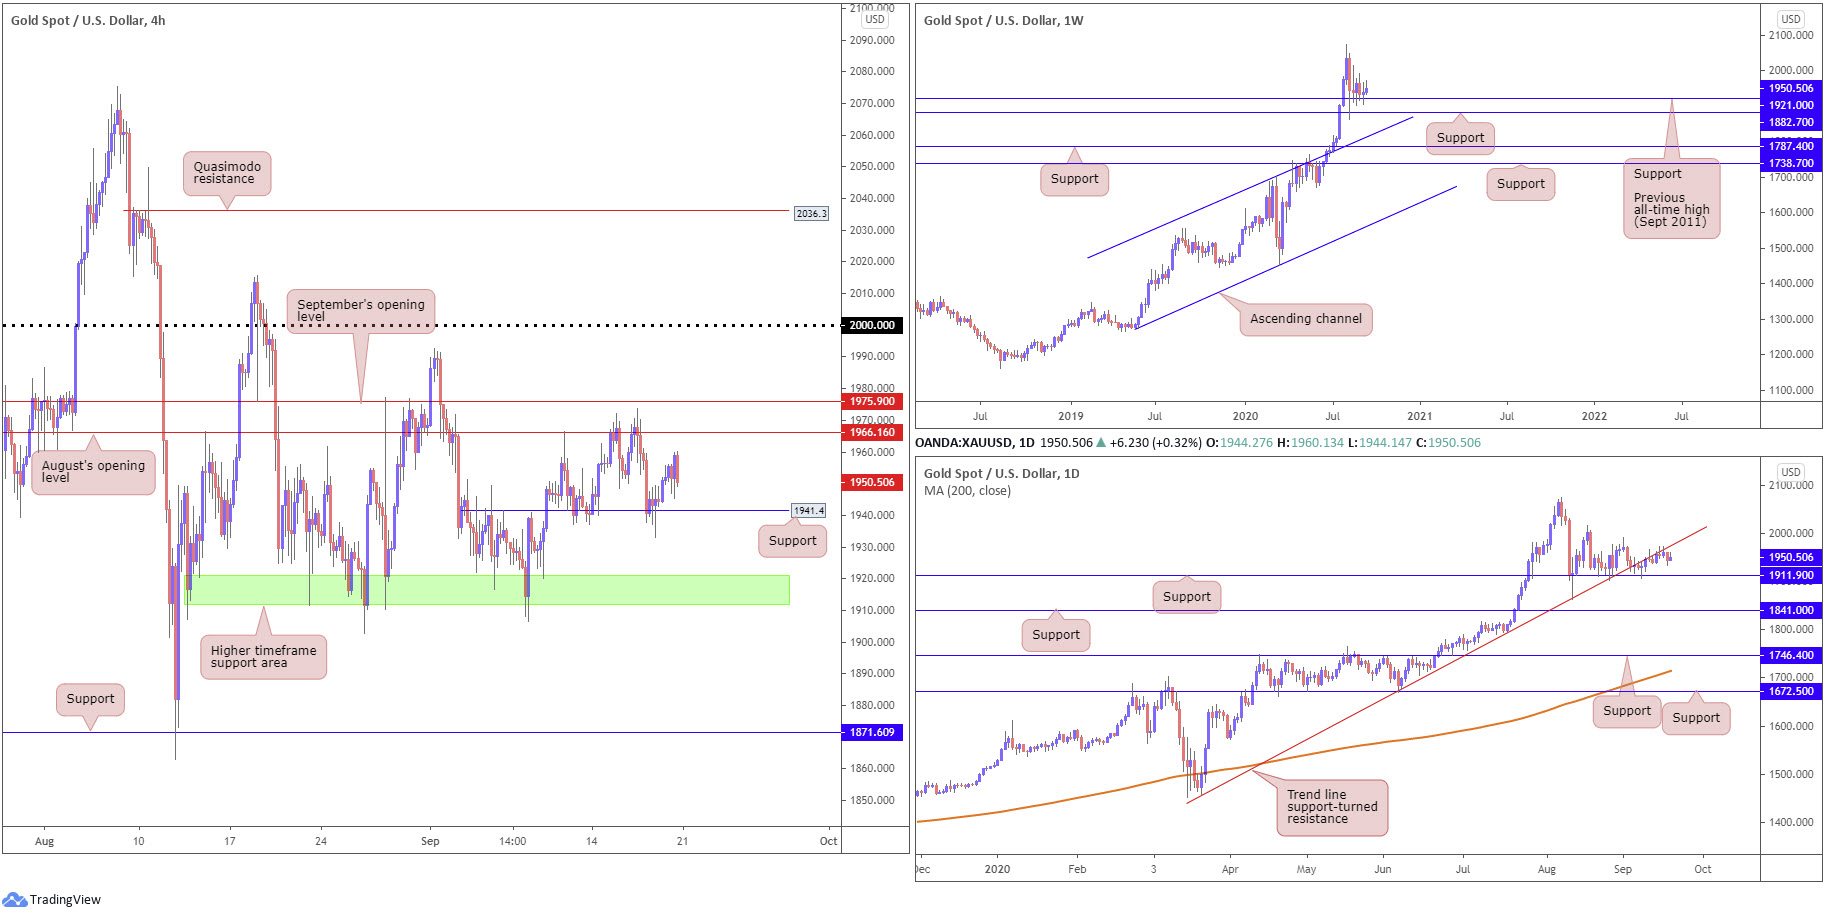
Since mid-August, technical action has been somewhat uncertain, though remains buoyed by $1,921 support (located ahead of support at $1,882), the previous major all-time high (September 2011). With the current trend trekking north since 2016, the support combination between $1,882 and $1,921 may be enough to encourage additional buying, with most targeting all-time peaks at $2,075 as the initial point. Failure to hold gains could see channel resistance-turned support, etched from the high $1,703, enter view this week.
Daily perspective:
Candle activity continues to hold gains north of support at $1,911, currently grinding along the underside of a trend line support-turned resistance, taken from the low $1,455.
Further buying this week targets the $1,992 September 1 high followed by the $2,015 August 18 high.
A dip sub $1,911 will draw weekly support mentioned above at $1,882 into the frame.
H4 perspective:
Thursday crossed swords with support at $1,941, following a dip from August’s opening value at $1,966, a line drawn just ahead of September’s opening value at $1,975.
Friday had bullion put up modest gains against the buck, yet ended the session off best levels. Follow-through buying this week could overrun $1,975 in favour of approaching $2,000.
Areas of consideration:
- Buyers from $1,941 support on the H4 are likely watching $1,966/$1,975 as an initial target this week. Breaching $1,975 offers buyers another opportunity to secure fresh positions towards $2,000.
- Should we fail to hold support, traders’ crosshairs are likely to drop back to the higher timeframe support zone at $1,911.90-$1,921.00 (green H4), an area which has plugged downside since August and recently (September 8) offered a solid buy signal.
The accuracy, completeness and timeliness of the information contained on this site cannot be guaranteed. IC Markets does not warranty, guarantee or make any representations, or assume any liability regarding financial results based on the use of the information in the site.
News, views, opinions, recommendations and other information obtained from sources outside of www.icmarkets.com.au, used in this site are believed to be reliable, but we cannot guarantee their accuracy or completeness. All such information is subject to change at any time without notice. IC Markets assumes no responsibility for the content of any linked site.
The fact that such links may exist does not indicate approval or endorsement of any material contained on any linked site. IC Markets is not liable for any harm caused by the transmission, through accessing the services or information on this site, of a computer virus, or other computer code or programming device that might be used to access, delete, damage, disable, disrupt or otherwise impede in any manner, the operation of the site or of any user’s software, hardware, data or property.


