
Key risk events today:
Limited.
EUR/USD:
Weekly gain/loss: +1.22%
Weekly close: 1.1169
Weekly perspective:
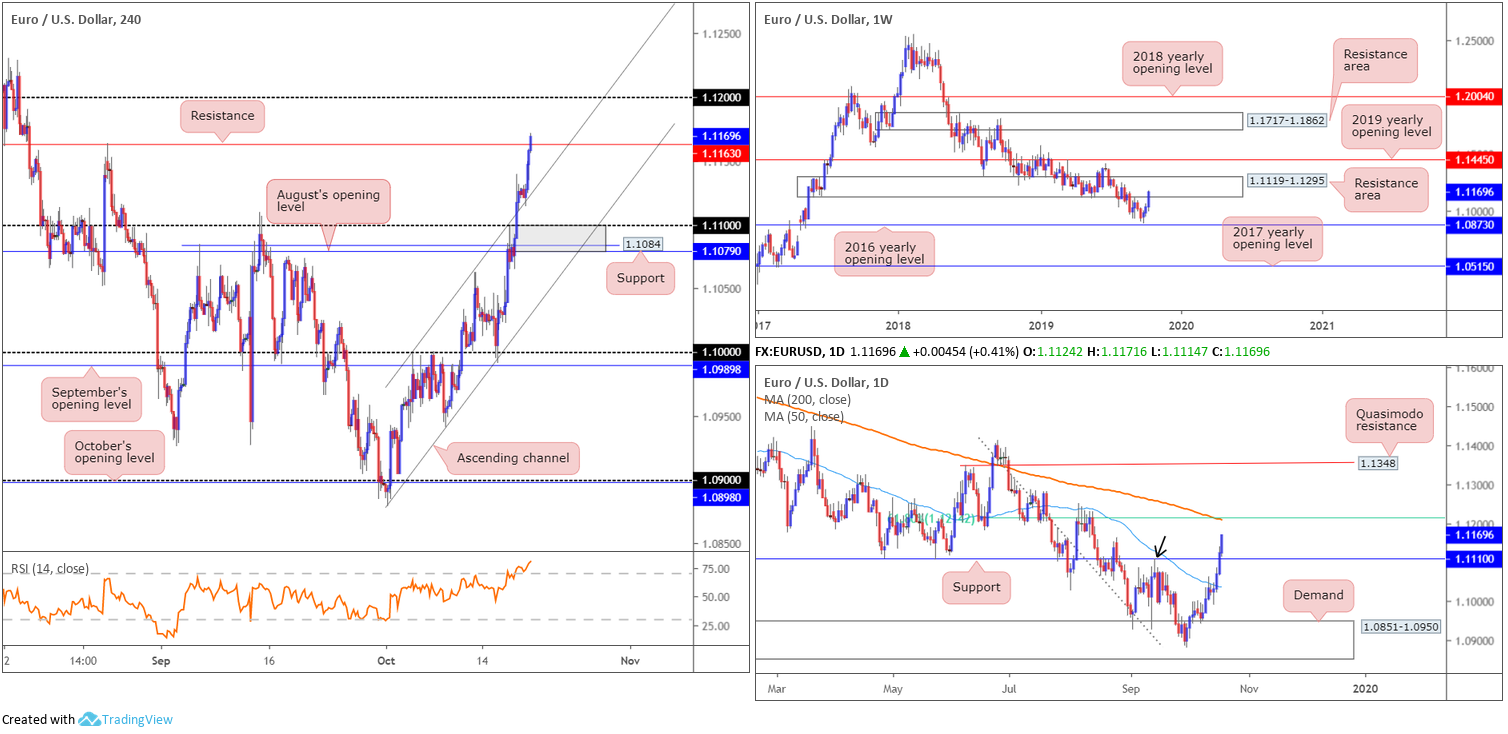
EUR/USD bulls remained on the offensive last week, extending October’s recovery a further 134 points. Aiding the move was the US dollar index, or DXY, crossing below notable weekly support at 97.72 and long-term trend line support extended from the low 88.25.
Although buyers remain strong this month, EUR/USD flow is testing a resistance area coming in at 1.1119-1.1295. Also, concerning trend direction, the primary downtrend has been (and remains) in motion since topping in early 2018 at 1.2555. Therefore, the recent recovery could merely be a correction within the overall trend.
Daily perspective:
Resistance at 1.1110 gave way Thursday and was, according to the M30 chart, retested as support shortly after. 1.1109 also marks an important swing high on the daily chart (black arrow). The breaking of this level suggests an easing of the primary trend may be on the cards.
The 200-day SMA (orange – 1.1209), however, remains pointing south, though the 50-day SMA (blue – 1.1036) shows signs of rotating north. In terms of the next daily resistance points to be aware of this week, chart studies have the 61.8% Fibonacci retracement ratio at 1.1214 in sight, which happens to intersect with the aforementioned 200-day SMA.
H4 perspective:
In the early hours of Europe Friday, buyers strengthened their grip following a retest of channel resistance-turned support taken from the high 1.0999. The downbeat tone in the dollar propelled Europe’s shared currency north, consequently testing and marginally overthrowing resistance plotted at 1.1163. This could see the H4 candles knock on 1.12’s door this week, which, according to the daily timeframe, merges closely with the 61.8% Fibonacci retracement ratio at 1.1214 and 200-day SMA. Indicator-based traders may also want to acknowledge the relative strength index is currently testing 80.50, signifying strongly overbought conditions.
Areas of consideration:
Upbeat sentiment surrounding the euro at the moment, coupled with a possible trend change on the daily timeframe, may be sufficient enough to test at least 1.12 on the H4 scale this week/the 61.8% Fibonacci resistance on the daily timeframe at 1.1214. The only downside to further buying, of course, is weekly price testing its resistance area and the overall trend.
Potential support on the H4 timeframe may develop off the recently submerged resistance at 1.1163, though a retest at the H4 channel support highlighted above is the more likely route. Alternatively, a deeper pullback to daily support at 1.1110 might be in store. Note 1.1110 also converges closely with a H4 support area in grey between 1.1079/1.11. All three zones represent possible buy zones this week. Despite October’s strong uptrend, nevertheless, traders are still urged to consider waiting for additional candlestick confirmation to form (entry and risk levels can be calculated based on this structure) before pulling the trigger at either of the above said supports.
GBP/USD:
Weekly gain/loss: +2.61%
Weekly close: 1.2973
Weekly perspective:
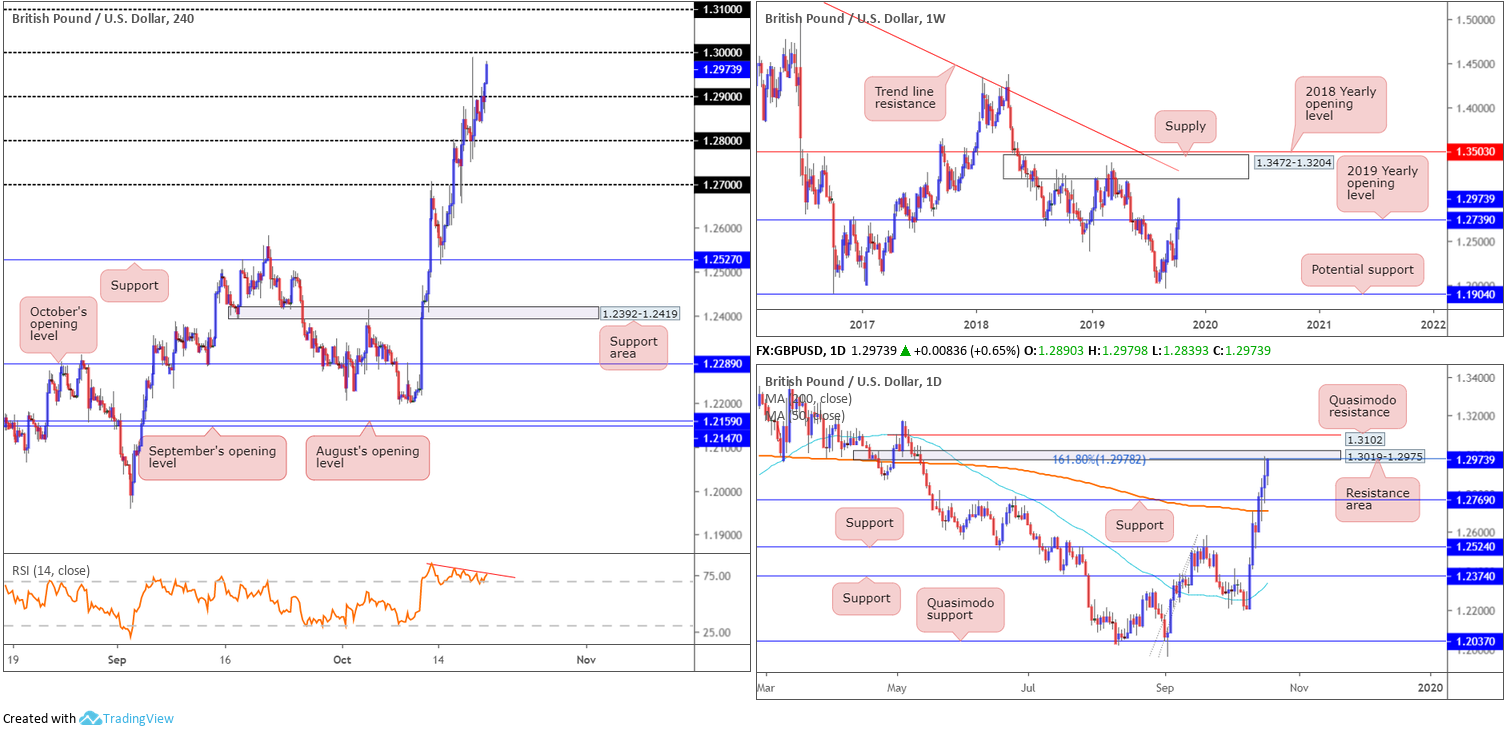
Sterling savoured another stellar week, notching gains in excess of 300 points and closing not too far off session highs at 1.2989.
Technically, focus has shifted to supply at 1.3472-1.3204 and long-term trend line resistance (etched from the high 1.5930), following last week’s dominant push through the 2019 yearly opening level at 1.2739. Before reaching 1.3472-1.3204, nevertheless, a pullback to retest 1.2739 is certainly a possibility.
Daily perspective:
Interestingly, price action on the daily timeframe shook hands with a resistance area coming in at 1.3019-1.2975 in the later stages of last week, which aligns with a 161.8% Fibonacci ext. point at 1.2978 (pencilled in from the low 1.1958).
Beyond 1.3019-1.2975, Quasimodo resistance at 1.3102 is visible as the next port of call. A pullback, on the other hand, could witness support at 1.2769 enter the fray, closely shadowed by the 200-day SMA (orange – 1.2717) which is currently showing signs of flattening (the 50-day SMA [blue – 1.2338] is pointing north).
H4 perspective:
Sterling continued to tempt buying Friday in response to UK media reports stating Prime Minister Boris Johnson secured enough backing to support his Brexit deal.
Technically the candles remain firm north of 1.29, having cleared three psychological levels last week, with 1.30 eyed as the next upside hurdle. Given this level offering strong support through March and early April this year, active sellers likely reside around this neighbourhood as a possible resistance, backed by the relative strength index (RSI) displaying signs of bearish divergence within overbought territory (red line). Note 1.30 occupies a portion of the daily resistance area highlighted above at 1.3019-1.2975.
Areas of consideration:
From a technical perspective, buyers are likely to take a run at 1.30 this week, though with hefty resistance in motion on the daily timeframe this is likely to be a difficult level to overturn, despite weekly price suggesting further upside.
Politically, the outcome of Saturday’s meaningful vote is likely to be tight which makes it more probable the market will see a tumultuous open. For that reason, this makes for a difficult task to set technical trading levels until the pair settles.
AUD/USD:
Weekly gain/loss: +0.98%
Weekly close: 0.6856
Weekly perspective:
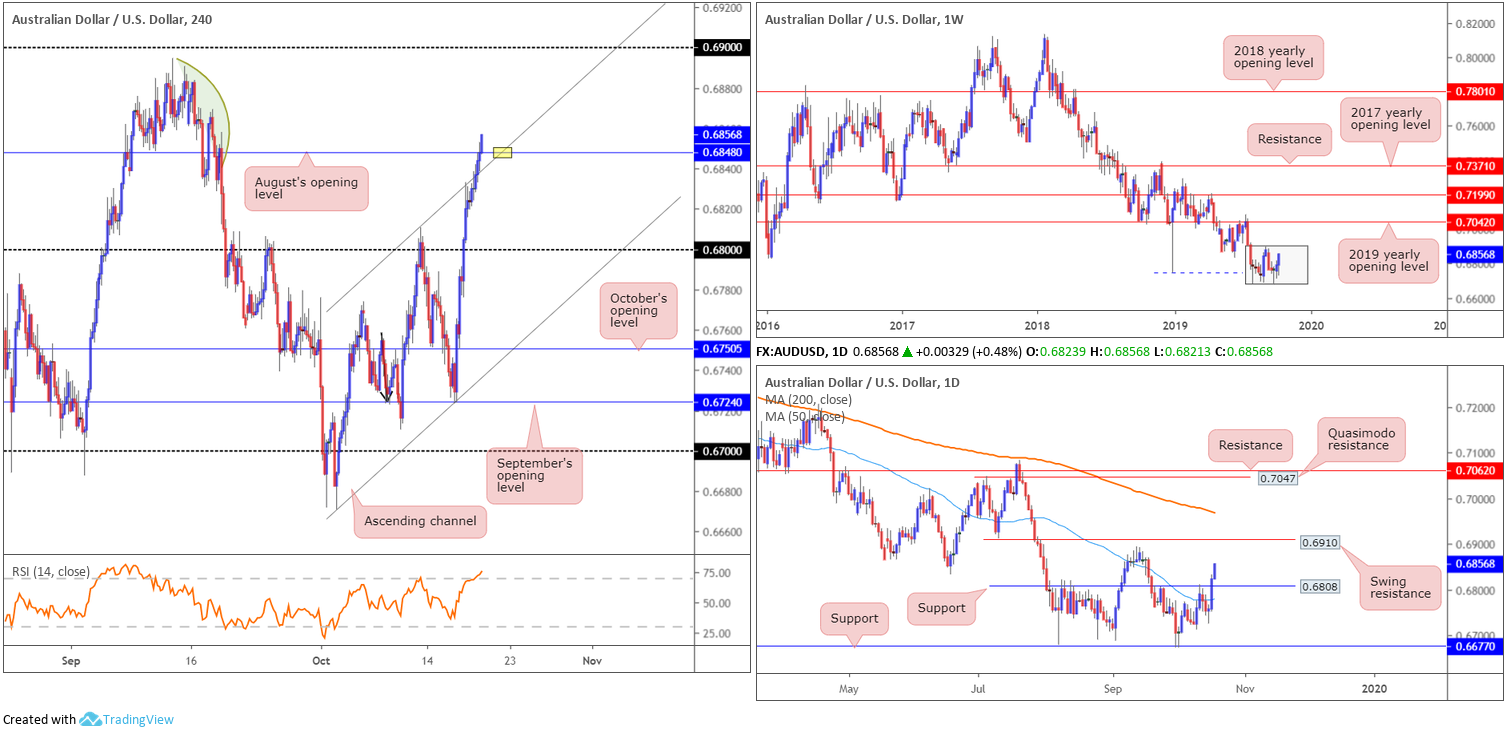
Since engulfing 0.6744 (blue dashed) in early August, the AUD/USD has been busy carving a consolidation zone between 0.6894/0.6677 (grey).
With the primary downtrend in play since early 2018, the current consolidation may eventually breakout to the downside, despite recent buying. A decisive push lower likely clears the runway to as far south as 0.6359 (not visible on the screen).
Daily perspective:
After dethroning the 50-day SMA (blue – 0.6779) late last week, resistance at 0.6808 also gave way. Battle lines going forward, therefore, rest at swing resistance drawn from 0.6910, set just north of the September 12th high 0.6894, with a potential retest scenario at 0.6808 also a possibility.
H4 perspective:
Friday observed additional buying, extending Thursday’s strong advance on the back of upbeat job’s data. Shrugging off softer Chinese GDP for the third quarter, the H4 candles engulfed channel resistance (extended from the high 0.6773) as well as August’s opening level at 0.6848. With limited supply evident to the left of current price (green), a test of 0.6894 could be in store, closely followed by the 0.69 handle.
Areas of consideration:
According to H4 and daily structure, additional medium-term buying could emerge. A retest at the point H4 channel support and August’s opening level at 0.6848 unite (yellow) is a possibility this week for potential longs. Failure here could imply a dip to daily support at 0.6808 and the 0.68 handle on the H4.
As underscored above, the 0.69ish region represents a logical upside target off 0.6848, whereas buying from 0.6808, in the event of a dip lower, 0.6848 would then be considered the initial take-profit target.
Irrespective of the support area selected, conservative traders threatened by the overall downtrend might opt to wait for additional confirmation before committing funds to a long position. This could be as simple as a bullish candlestick pattern forming, or even drilling down to the lower timeframes and attempting to trade local structure, a trend line break/retest formation, for example.
USD/JPY:
Weekly gain/loss: -0.05%
Weekly close: 108.38
Weekly perspective:
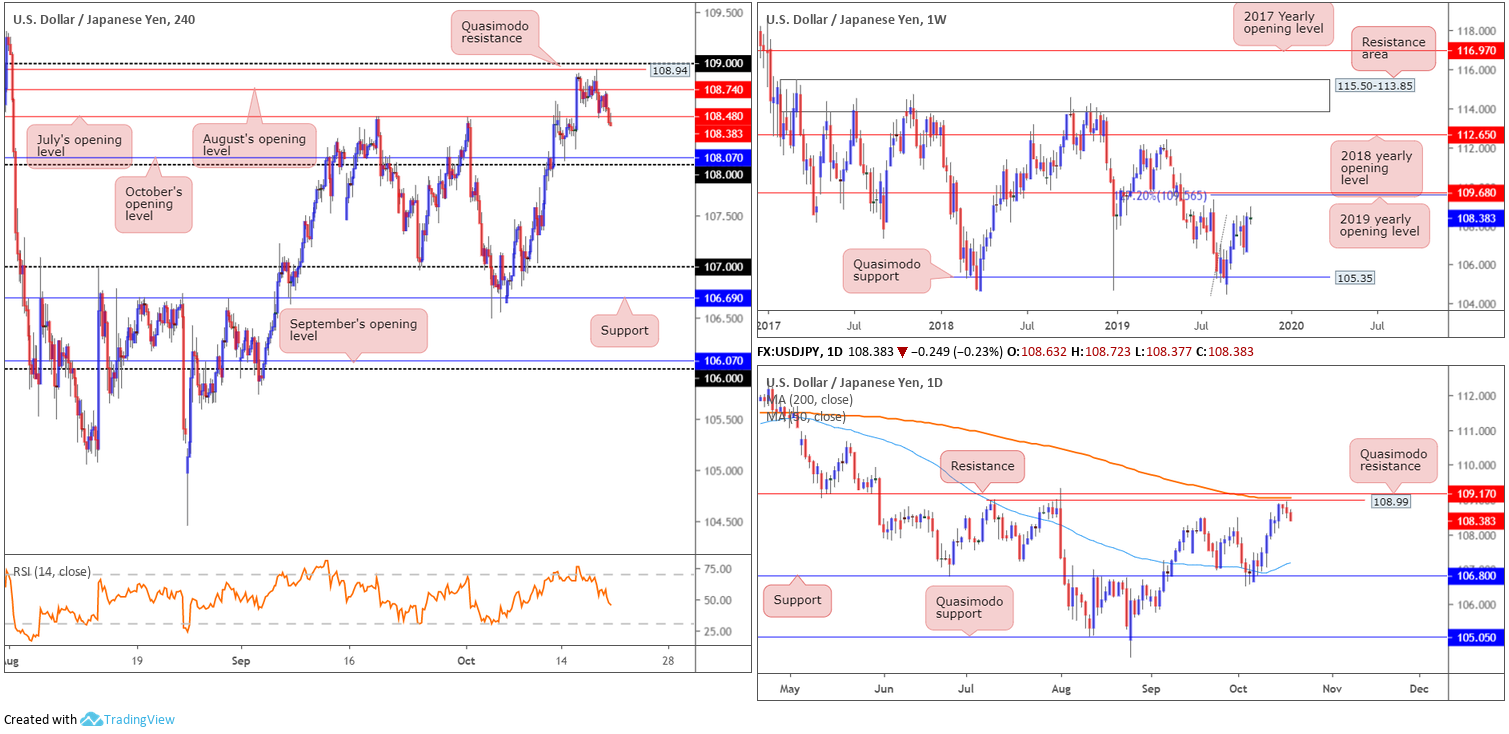
USD/JPY prices concluded unmoved last week, despite ranging more than 90 points (108.94/108.03). In terms of areas to keep an eye on this week, Quasimodo support at 105.35 remains the next obvious downside target, while to the upside, the 2019 yearly opening level falls in as the next resistance at 109.68, merging closely with a 127.2% Fibonacci ext. point at 109.56 (taken from the low 104.44).
Daily perspective:
Thursday came within touching distance of connecting with a Quasimodo resistance at 108.99 before turning lower. Note directly above 108.99, chart studies display the 200-day SMA (orange – 109.06), which appears to be flattening out, and resistance coming in at 109.17.
Assuming further selling is seen, support at 106.80 is in sight, set just south of the 50-day SMA (blue – 107.19) which is currently facing north.
H4 perspective:
The upbeat performance of major counterparts along with sub-standard macroeconomic data out of the US this week weighed on the buck. USD/JPY movement found willing sellers at the underside of Quasimodo resistance 108.94 Thursday and closed beneath August’s opening level at 108.74. Friday continued to extend losses, consequently marginally overthrowing July’s opening level at 108.48. October’s opening level at 108.07, set a few points ahead of 108, falls in as the next downside target on this scale.
Driving through stops at 108 this week, however, could lead to a run towards 107. This is certainly a move to keep an eye out for, given both weekly and daily timeframes display limited support – the closest is set at the 50-day SMA (107.19).
Areas of consideration:
Friday’s closing H4 candle formed a reasonably strong selling wick that attacked the underside of 108.48. This – coupled with higher-timeframe action showing room to press lower – entry on the back of this candle formation could be an option, targeting 108 as the initial take-profit zone.
A break of 108, as highlighted above, likely clears the river south to 107. A decisive breakout beneath 108, on a H4 closing bases, therefore, might be considered a sell for some traders, likely positioning protective stop-loss orders above the candle’s upper shadow. For more conservative traders, nevertheless, waiting for a retest of 108 to occur, preferably in the shape of a bearish candlestick pattern, might be the way forward. This not only signals seller intent, it also provides traders entry and risk levels to work with.
USD/CAD:
Weekly gain/loss: -0.52%
Weekly close: 1.3123
Weekly perspective:
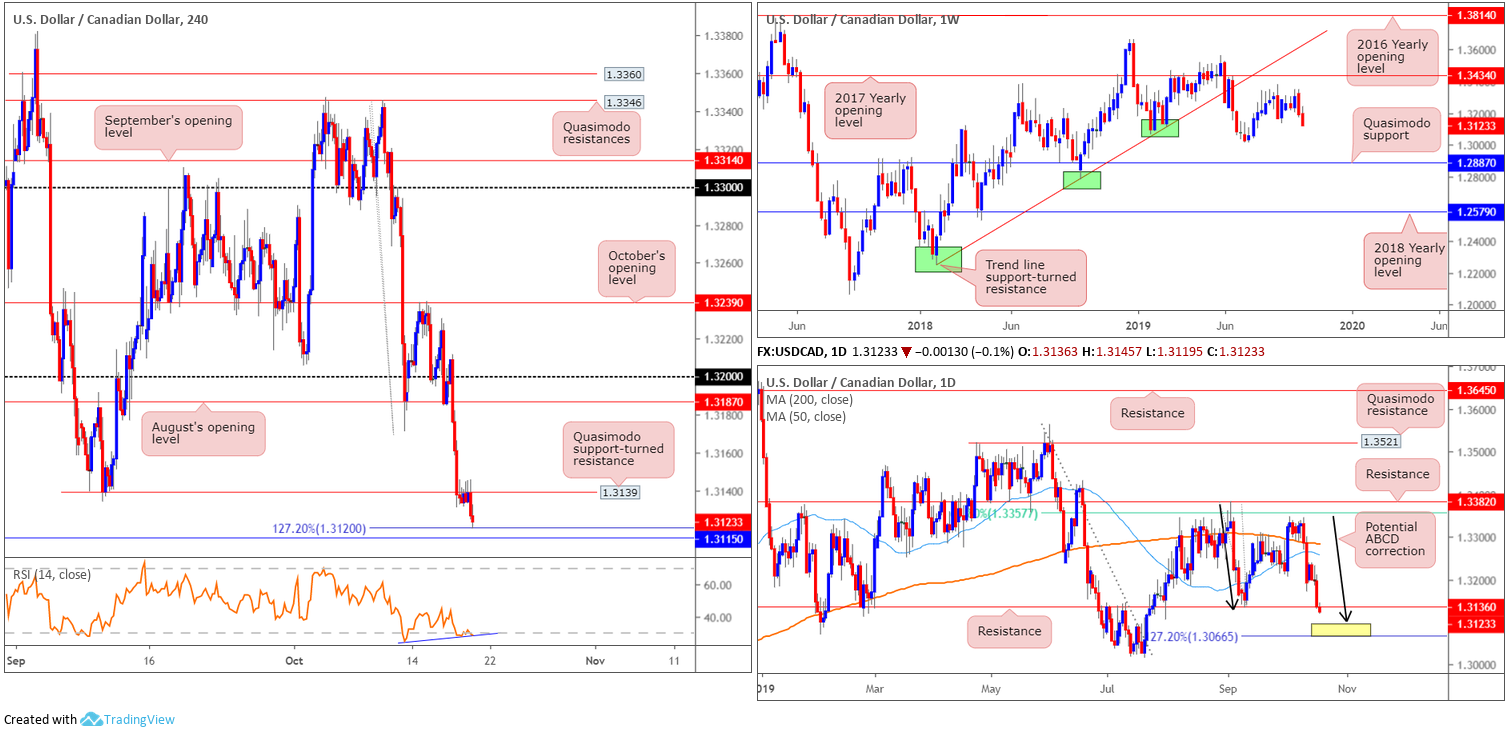
In the wake of a robust bearish engulfing candle sited just south of the 2017 yearly opening level at 1.3434, favour tilted to the sell side of this market last week. Support on this timeframe is not expected to emerge until the 1.3015 July 15 low, followed by Quasimodo support stationed at 1.2887.
The primary trend has remained north since bottoming in September 2017 (1.2061). Currently, though, the candles appear to be in a secondary downtrend, with its peak at 1.3661.
Daily perspective:
Support at 1.3136 – boasts reasonably strong historical significance – failed to offer much of a floor last week, with price finishing mildly lower. Is this enough to draw in the nearby ABCD (black arrows) reversal zone (yellow) between the 127.2% Fibonacci extension point at 1.3066 and the tip of the ABCD correction at 1.3096 this week?
With respect to the moving averages, the 200-day SMA (orange – 1.3284) appears to be flattening, while the 50-day SMA (blue – 1.3258) currently faces south.
H4 perspective:
Resistance at 1.3139 – shaped in the form of a Quasimodo support-turned resistance – elbowed its way into the spotlight Friday, withstanding a number of upside attempts. Buyers eventually yielded ground late in the session, permitting a run to fresh monthly lows at 1.3119, though was mildly supported by a 127.2% Fibonacci ext. point at 1.3120.
Beyond 1.3120, Quasimodo support at 1.3115 is visible, closely trailed by the 1.31 handle. Interestingly, the relative strength index (RSI) displays signs of bullish divergence out of oversold territory (blue line), considered an early warning signal momentum to the downside is slowing and an upturn may emerge.
Areas of consideration:
The area between 1.31 and the 127.2% Fibonacci ext. at 1.3120 provides a support area to work with today. However, traders may be drawn to the lower edge of this zone: 1.31, knowing the psychological threshold boasts a close connection with the top edge of the daily potential reversal zone at 1.3066/1.3096.
An ideal scenario would be for H4 candles to whipsaw beneath 1.31, trip sell stops and draw in daily buyers from 1.3066/1.3096, and culminate in a close back above 1.31. This is likely enough to lure buying back up to at least 1.3139/daily resistance 1.3136, with a break likely sponsoring further buying to August’s opening level at 1.3187.
USD/CHF:
Weekly gain/loss: -1.26%
Weekly close: 0.9840
Weekly perspective:
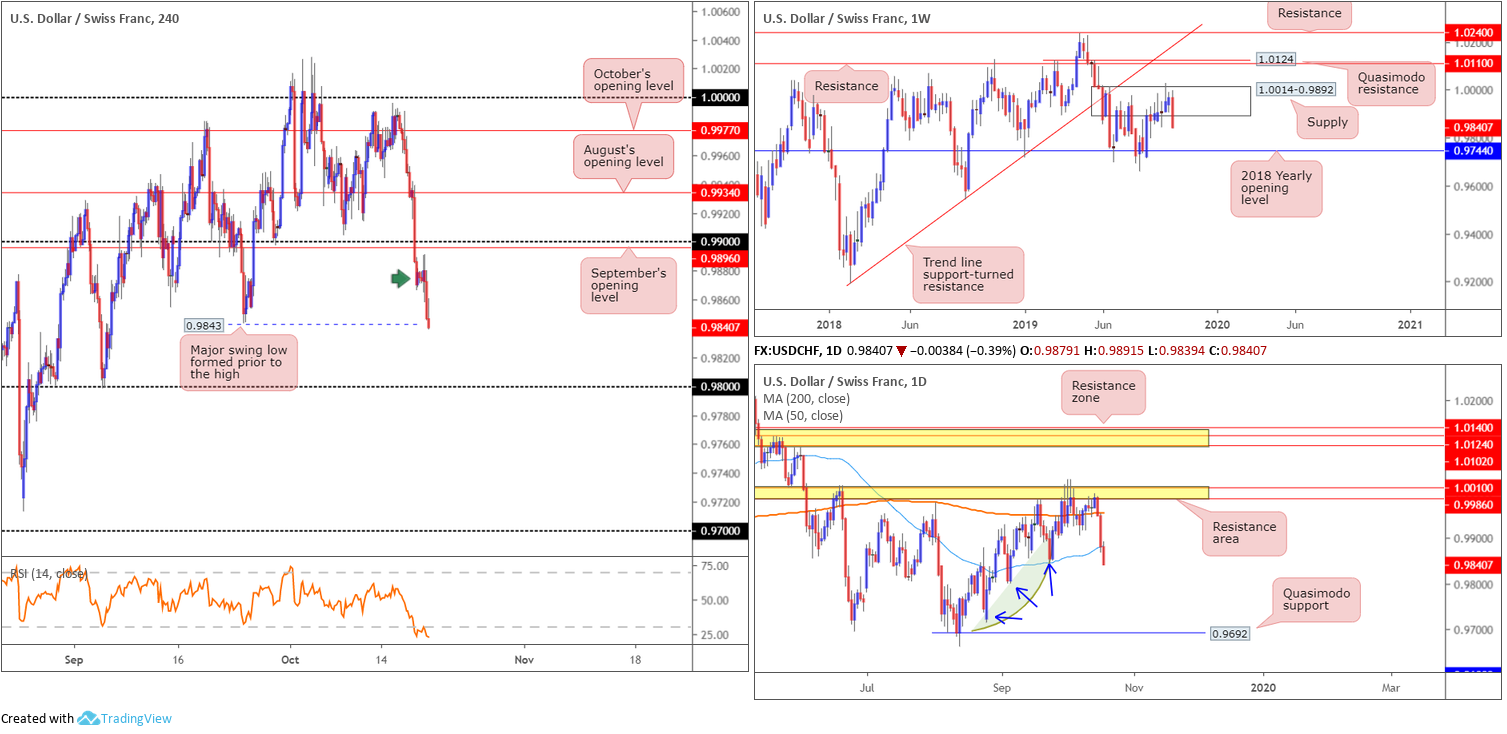
By way of a dominant bearish engulfing candle, the USD/CHF fell sharply out of supply coming in at 1.0014-0.9892 over the course of last week. down more than 120 points, this positions the 2018 yearly opening level at 0.9744 in the firing range as possible support this week.
According to the primary trend, price reflects a somewhat bullish tone. However, do remain aware we have been rangebound since the later part of 2015 (0.9444/1.0240).
Daily perspective:
The resistance area marked yellow at 1.0010/0.9986, formed within the upper limit of the noted weekly supply, held ground last week. Buyers lost their flavour Wednesday, allowing a minor close beneath the 200-day SMA (orange – 0.9955) to be seen. Further downside occurred Thursday and Friday, guiding the candles beneath the 50-day SMA (blue – 0.9883).
Technically, room to continue pressing lower is evident on the daily timeframe. Demand to the left of price appears fragile (green zone), with lows seen filling buy orders as price rallied (blue arrows), consequently exposing Quasimodo support at 0.9692 as the next support in line.
H4 perspective:
The US dollar continued to sag against the Swiss franc Friday, refreshing monthly lows at 0.9839. Weighed by a persistent USD selling bias, the major swing low marked at 0.9843 gave way into the close. The move beneath here places 0.98 in view this week representing a possible support sellers may work toward. Sidestepping 0.98 this week may unlock further selling towards 0.97 on the H4 scale, though before this region enters the mix, the 2018 yearly opening level at 0.9744 may step in.
Areas of consideration:
All three timeframes exhibit scope to explore lower ground this week.
A pullback to 0.99 is certainly a possible scenario, taking out buy stops above supply at 0.9890 (green arrow). A retest at 0.99, shaped in the form of a H4 bearish candle is, therefore, something to keep an eye out for this week, targeting 0.98 as the initial port of call.
For the more aggressive trader, entry at current price might be an idea, with a protective stop-loss order plotted above Friday’s closing candle (0.9860). This is effectively a breakout trade, targeting 0.99.
Another theme to watch for this week is a H4 close beneath 0.98, opening downside to weekly support at 0.9744. Traders may simply sell the breakout from here and locate stops above the breakout candle’s high point, or more conservatively, we may see some traders wait and see if a retest forms before pulling the trigger.
Dow Jones Industrial Average:
Weekly gain/loss: -0.06%
Weekly close: 26771
Weekly perspective:
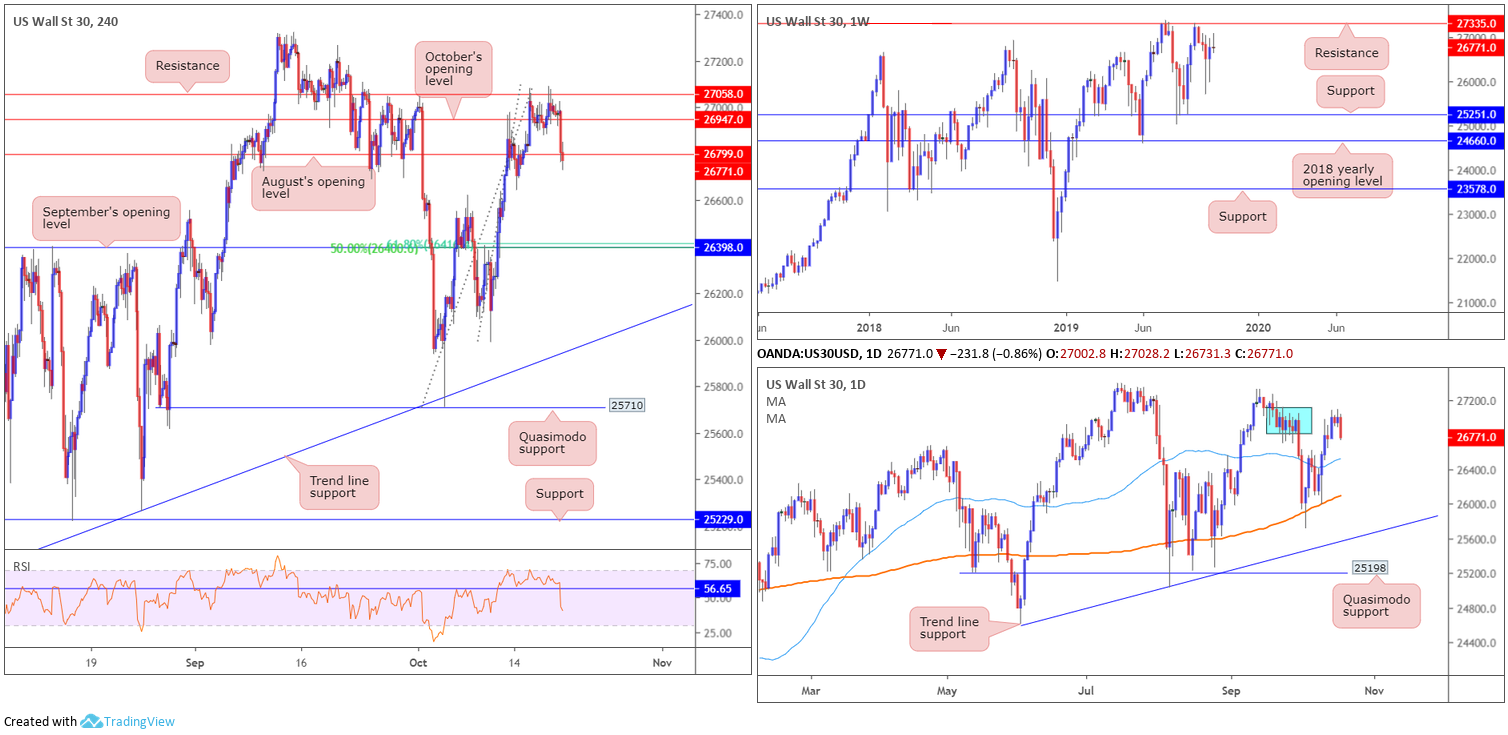
US stocks finished the week mildly lower after flirting with the possibility of bringing in notable resistance at 27335, sited only a few points south of the all-time high 27388. Levels of support remain fixed at 25251 and the 2018 yearly opening level at 24660.
Despite a minor setback to 21452 and the current consolidation between 27335/25251, the primary trend in this market remains facing northbound.
Daily perspective:
Research on the daily timeframe shows supply between 27110-26813 (blue – positioned just south of weekly resistance at 27335) regained consciousness Friday, after a week of limited downside. Friday pencilled in a robust bearish candle, closing not too far off its lows at 26731 and focusing the spotlight on a potential test of the 50-day SMA (blue – 26521). Both the 50-day SMA and the 200-day SMA (orange – 26097) face north.
H4 perspective:
Optimism surrounding Brexit gave stocks a boost last week, though in one fell swoop, Friday’s losses wiped out the Dow’s gains for the week as Boeing and Johnson & Johnson plunged lower.
H4 resistance at 27058, a notable barrier by and of itself with a reasonably long serving history, contained upside and threw the H4 candles back beneath October and August’s opening levels at 26947 and 26799, respectively. The next downside hurdle to be aware of on the H4 timeframe can be seen at September’s opening level at 26398, crowded by a 50.0% support value and a 61.8% Fibonacci ratio at 26419.
Areas of consideration:
Assuming the H4 candles remain in the driving seat sub 26799 this week, knowing we’re coming from daily supply at 27110-26813, a sell could be on the cards.
Entry at current price is certainly an option, though given the close beneath 26799 was not much to get excited about, traders may consider waiting for additional downside to materialise before considering this market. A retest at 26799 is the ideal scenario, preferably formed in the shape of a H4 bearish candlestick pattern (entry and risk can then be set according to this formation).
XAU/USD (GOLD):
Weekly gain/loss: +0.10%
Weekly close: 1490.1
Weekly perspective:
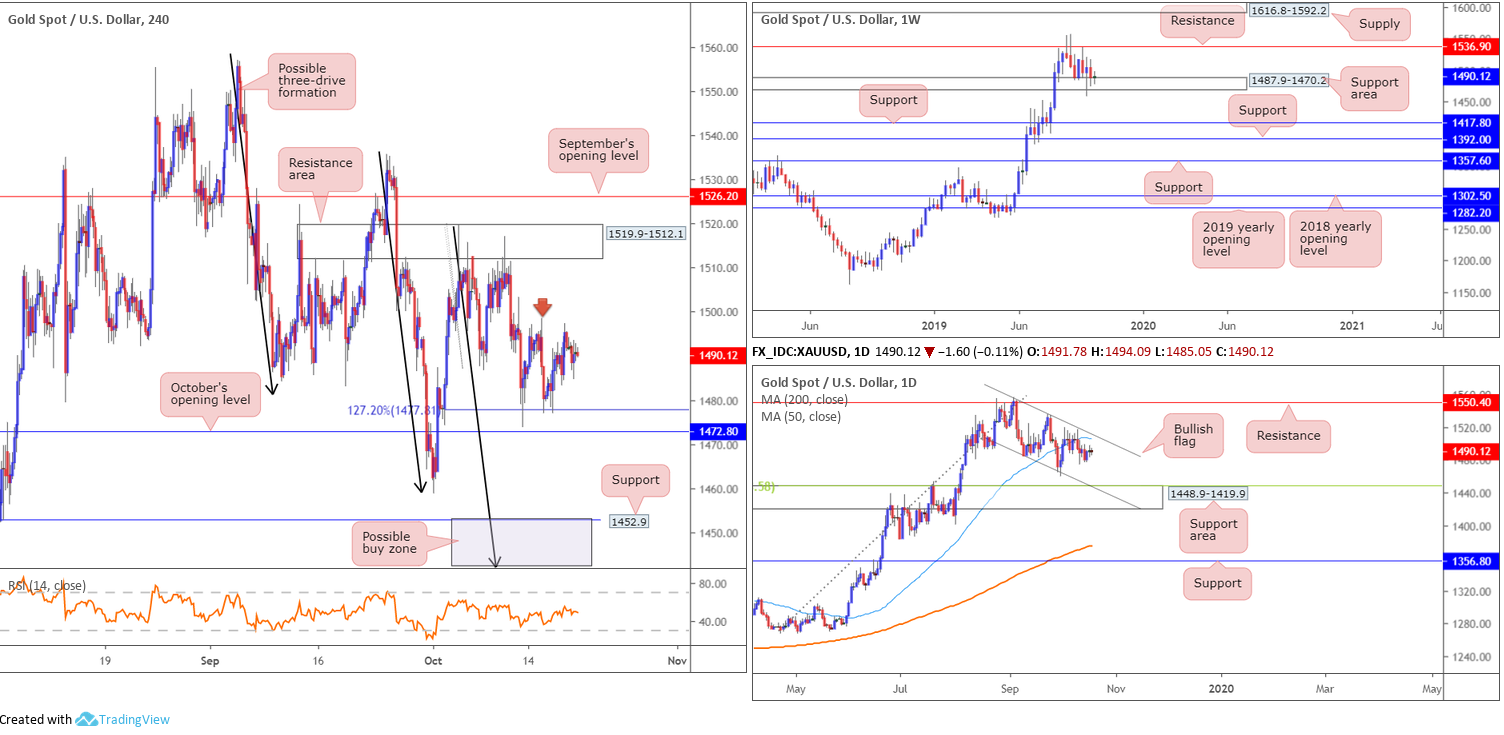
Gold, in $ terms, concluded the week mostly unchanged, with much of the action seen at the lower edge of the prior week’s range (1517.0/1474.2).
Despite having its lower edge breached three weeks back, the support area at 1487.9-1470.2 remains in the fight. To the upside, resistance is seen at 1536.9, whereas two layers of support are visible at 1392.0 and 1417.8, in the event we push for lower ground. In terms of the longer-term primary trend, gold has been trading northbound since the later part of 2015 (1046.5).
Daily perspective:
Daily flow shows a bullish flag has been in motion since early September (1557.1/1485.3). Recently, the unit crossed beneath its 50-day SMA (blue – 1506.7), consequently opening downside to a possible test of a support area coming in at 1448.9-1419.9 (bolstered by a 38.2% Fibonacci ratio 1448.5 and the lower edge of the daily flag [1485.3]).
H4 perspective:
Since the beginning of last week, bullion has been entrenched within a reasonably tight range (1498.4/1477.0). H4 structure found support off the 127.2% Fibonacci extension point at 1477.8, which is closely shadowed by October’s opening level at 1472.8. Beyond here, the October 1st low 1458.9 is in sight, followed by support coming in at 1452.9 as well as a possible three-drive formation (black arrows) at 1442.1 (grey zone). To the upside, a familiar resistance zone is present at 1519.9-1512.1, seen just south of September’s opening level at 1526.2.
Areas of consideration:
Outlook unchanged.
In essence, the unit remains entrenched within a long-term uptrend, though shows signs of weakness at the current weekly support area, particularly following the breach of its lower edge three weeks ago.
Daily price demonstrates room to press lower until reaching a support area at 1448.9-1419.9.
H4 price remains buoyant above the Fibonacci (ext.) support at 1477.8, with October’s opening level at 1472.8 sited as the next point of interest. The grey zone between 1442.1/1452.9 is considered a potential buy zone, given it is formed by reasonable H4 support and a possible three-drive formation (black arrows), as well as being located within the said daily support area.
Should H4 price remain defensive north of 1477.8, however, and we break through 1498.4 (red arrow), further upside towards 1519.9-1512.1, and possibly September’s opening level at 1526.2, could be in store. A long on the break, therefore, is perhaps a theme worthy of exploring this week.
The accuracy, completeness and timeliness of the information contained on this site cannot be guaranteed. IC Markets does not warranty, guarantee or make any representations, or assume any liability regarding financial results based on the use of the information in the site.
News, views, opinions, recommendations and other information obtained from sources outside of www.icmarkets.com.au, used in this site are believed to be reliable, but we cannot guarantee their accuracy or completeness. All such information is subject to change at any time without notice. IC Markets assumes no responsibility for the content of any linked site.
The fact that such links may exist does not indicate approval or endorsement of any material contained on any linked site. IC Markets is not liable for any harm caused by the transmission, through accessing the services or information on this site, of a computer virus, or other computer code or programming device that might be used to access, delete, damage, disable, disrupt or otherwise impede in any manner, the operation of the site or of any user’s software, hardware, data or property.


