
Lower timeframe confirmation: is something we use a lot in our analysis. All it simply means is waiting for price action on the lower timeframes to confirm direction within a higher timeframe area. For example, some traders will not enter a trade until an opposing supply or demand area has been consumed, while on the other hand, another group of traders may only need a trendline break to confirm direction. As you can probably imagine, the list is endless. We, however, personally prefer to use the two methods of confirmation mentioned above in our trading.
EURUSD:
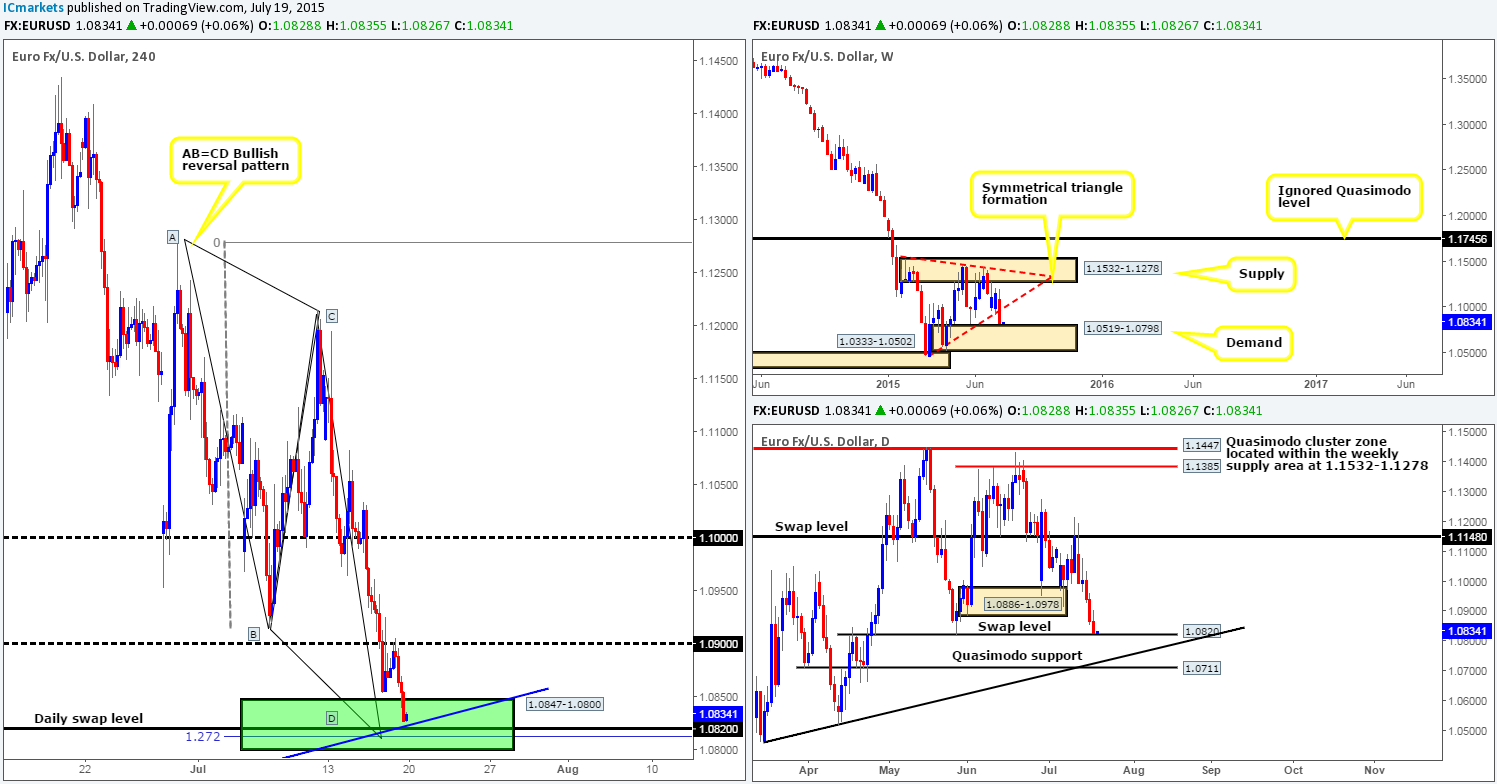
Weekly recap: The EUR currency plunged a whopping 326 pips last week. This saw price slice through the weekly ascending trendline (forms lower limit of recent symmetrical triangle formation) taken from the low 1.0468 and close on its lows at 1.0827 just above weekly demand coming in at 1.0519-1.0798. Alongside this, we also saw daily action take out daily demand at 1.0886-1.0978 and close the week seven pips above a daily swap level at 1.0820.
Moving down to the 4hr scale, Friday’s sessions reveal price rallied from a low of 1.0854 and crossed swords with round number resistance at 1.0900, which hammered the Euro home south to end the week deep within a 4hr Harmonic AB=CD potential reversal zone (PRZ) at 1.0847-1.0800.
Going forward, Sunday’s open 1.0828 shows little change was seen over the weekend. As a result, price is still sitting within the aforementioned 4hr Harmonic AB=CD (PRZ), which so happens to converge with the following structures:
- Encapsulates the daily swap level 1.0820.
- The lower limit of our AB=CD pattern has been expanded slightly to include the 1.0800 round number which also represents the top-side of a weekly demand area at 1.0519-1.0798.
- 4hr trendline convergence from the low 1.0461.
- Fibonacci extension value 1.272%.
Therefore, as long as our analysis is correct, the EUR currency should appreciate today/this week. Nevertheless, as tasty as this zone may look, there may still be a fakeout below the 1.0800 handle to accumulate liquidity to push this market higher. For this reason, we are not going to be entering at market; we’re going to WAIT for the lower timeframes (15 min/60 min) to confirm buying strength exists within this highly confluent 4hr Harmonic structure before risking capital to this idea.
Levels to watch/live orders:
- Buys: 1.0847/1.0800 [Tentative – confirmation required] (Stop loss: 1.0785).
- Sells: Flat (Stop loss: N/A).
GBP/USD:
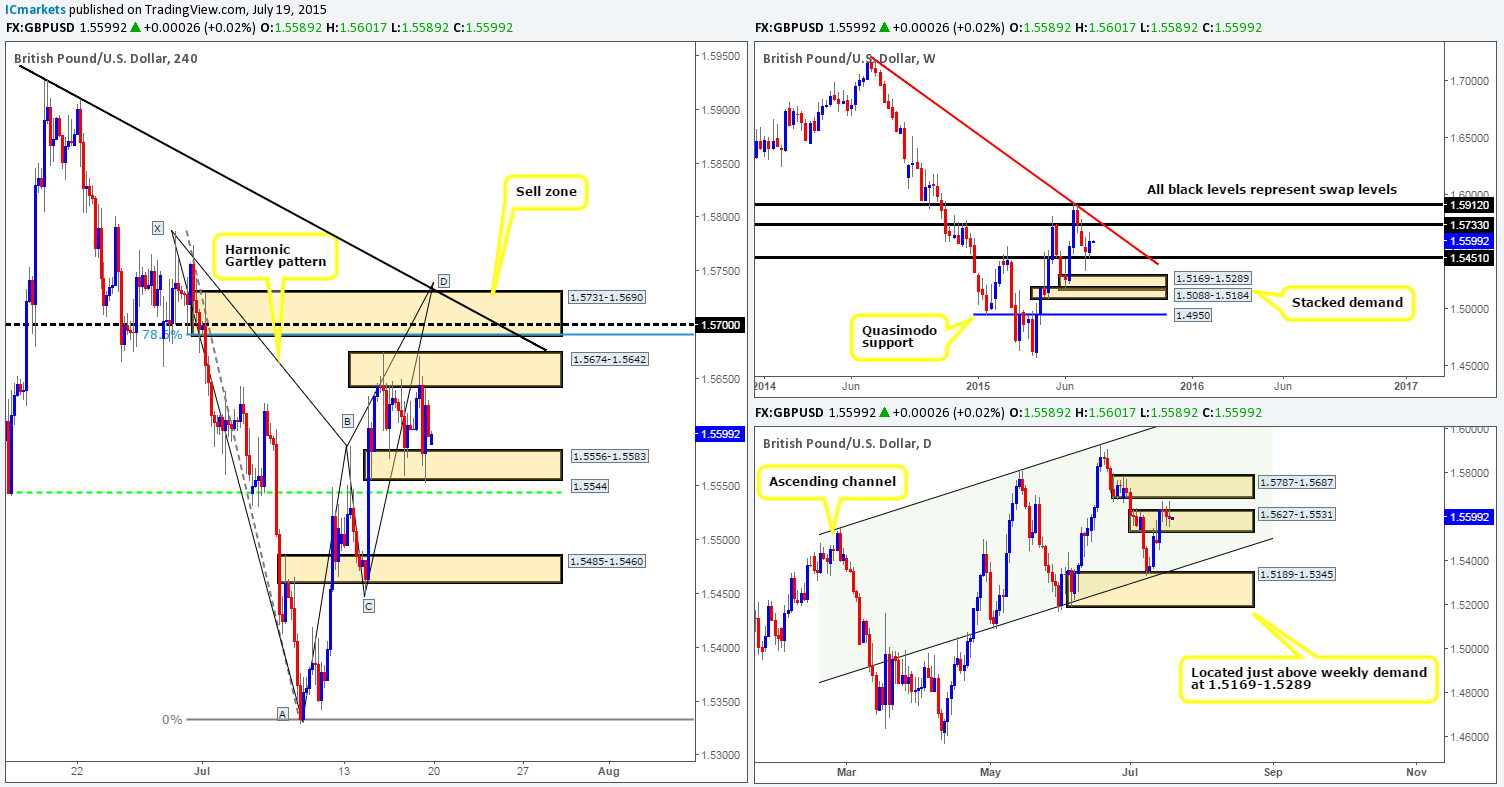
Weekly recap: Pound Sterling managed to recoup some of its recent losses last week, as strong bids came in from the top-side of a weekly swap level at 1.5451, consequently printing a higher high and closing 85 pips above the prior week’s close 1.5511 at 1.5596. Looking at the daily timeframe, however, we can see there was little movement in this market from Wednesday onwards following the break above daily supply at 1.5627-1.5531.
This somewhat ranging action on the daily scale becomes more apparent as we zoom down to the 4hr timeframe. A flurry of buying and selling between 4hr demand at 1.5556-1.5583 and 4hr supply at 1.5674-1.5642 formed a very distinct 4hr consolidation zone which continued to hold going into the weekly close.
Moving forward, we can see that Sunday’s open 1.5589 gapped seven pips lower than Friday’s close. This, as you can see, has not made much of a change to the overall 4hr range (see above) we saw during Friday’s sessions. We personally have no interest in attempting to fade the limits of this consolidation. What we are interested in today/this week though is the 4hr supply area sitting just above it at 1.5731-1.5690 (pending sell order has been set at 1.5686), since it converges beautifully with the following:
- Bearish Harmonic Gartley pattern which completes just above this 4hr supply area at 1.5739.
- The weekly swap level at 1.5733 is seen two pips above this area of 4hr supply.
- Positioned nicely within daily supply coming in at 1.5787-1.5687.
- Round number resistance seen at 1.5700.
- 4hr downtrend line from the high 1.5928.
However, before a rally higher is seen, we have to be prepared for the possibility that price may fakeout below the current 4hr range and connect with the 4hr swap level sitting at 1.5544. This will likely stop out any traders attempting to play the lower limits of this range, and also give well-funded traders the liquidity they require to push this market up to the offers sitting around the aforementioned 4hr supply area. This could also be a tradable move today as long as lower timeframe confirmed buying strength is seen following the fakeout.
Levels to watch/ live orders:
- Buys: Flat (Stop loss: N/A).
- Sells: 1.5686 (Stop loss: 1.5778).
AUD/USD:
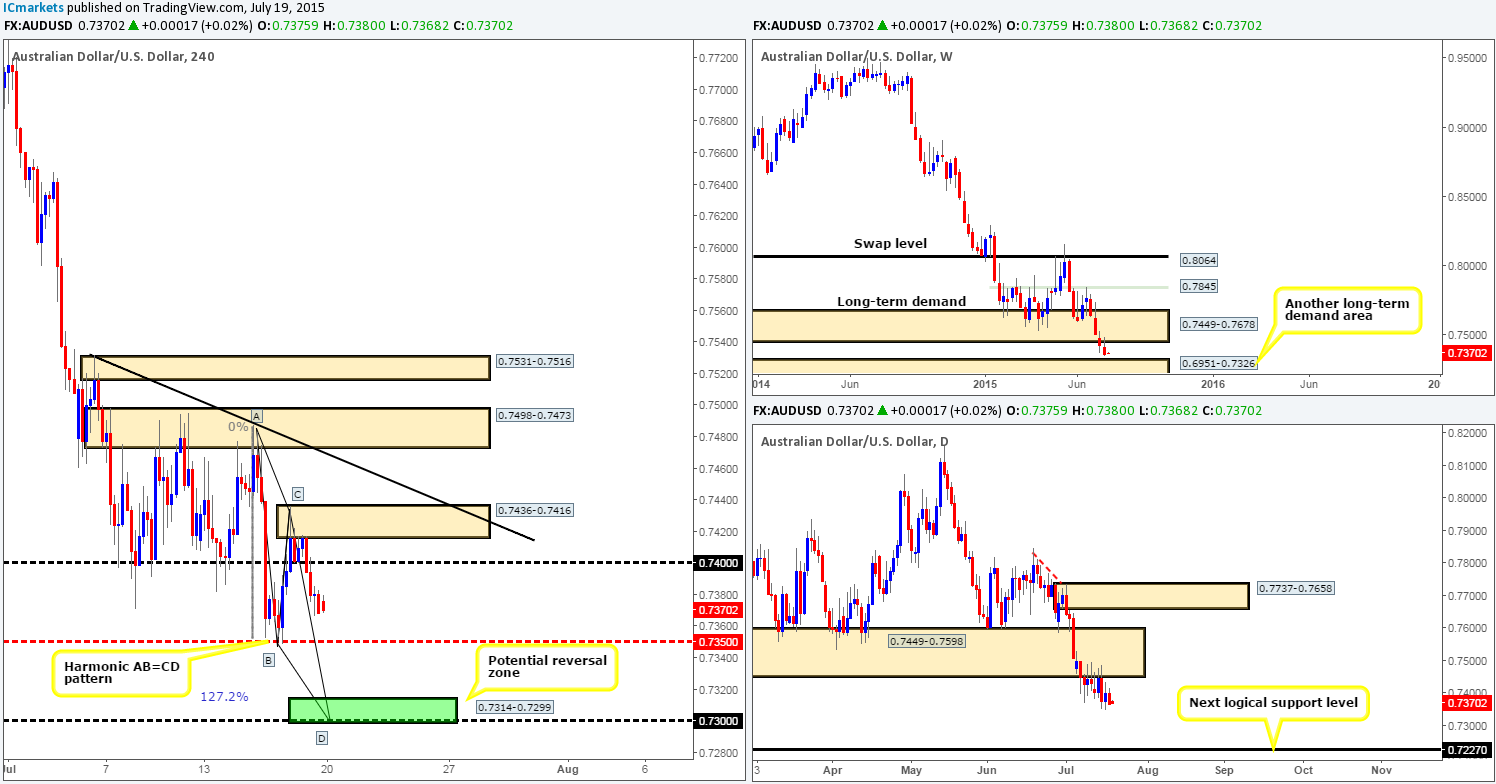
Weekly recap: The Aussie pair suffered further losses last week, as price retested and held the underside of the recently engulfed weekly demand area at 0.7449-0.7678. From here, price closed near its lows at 0.7368 erasing close to 65 pips of value to end the week. The next supportive barrier to keep an eye on in the higher timeframe picture comes in from the weekly timeframe at 0.7326, the top-side of a long-term weekly demand.
Lower down on the 4hr scale, we can see price sold off from 0.7417 during Friday’s sessions. This potentially formed a C-leg of a bearish Harmonic AB=CD pattern which completes (green area 0.7314-0.7299) around the round number support at 0.7300.
This morning’s open 0.7375 saw price gap seven pips south from Friday’s close, which technically made very little difference to the overall structure of this pair. As such, our analysis is relatively straightforward.
We’re looking for the 4hr Harmonic AB=CD pattern to complete (see above for levels) today/this week, due to this reversal zone converging with not only round-number support at 0.7300, but also a long-term weekly demand area at 0.6951-0.7326 as well. Therefore, it may be worth placing this beauty on your watch lists!
Just to be clear here guys, we’re not expecting the market just to dive south to our area of interest, that would be nice don’t get us wrong, but highly unlikely. Therefore, from a technical standpoint, here is our take on where price may move today and possibly into the week:
- Price could retrace back up to 0.7400 to collect any unfilled sell orders lurking in this vicinity, and maybe even fakeout above this number to connect up with the newly-formed 4hr supply area at 0.7436-0.7416. This move is certainly tradable in our opinion as long as lower timeframe resistance is also seen holding firm too. Take profit targets come in at: 0.7350 –0.7317.
- We could see further selling down to 0.7350. If this mid-level hurdle should break, intraday traders could look to take advantage of any retest seen here and target 0.7317. Stop-loss orders will need be tight here to achieve favorable risk/reward. Therefore, we would strongly advise waiting for lower timeframe action to confirm that offers are coming into the market before risking capital here.
Any shorts taken at the above levels by us WILL be liquidated at 0.7317, since this is the point at which our team will begin looking for longs into this market (the 4hr Harmonic AB=CD base).
Levels to watch/ live orders:
- Buys: 0.7314-0.7299 [Tentative – confirmation required] (Stop loss: dependent on where one confirms this zone).
- Sells: 0.7400 [Tentative – confirmation required] (Stop loss: 0.7501).
USD/JPY:
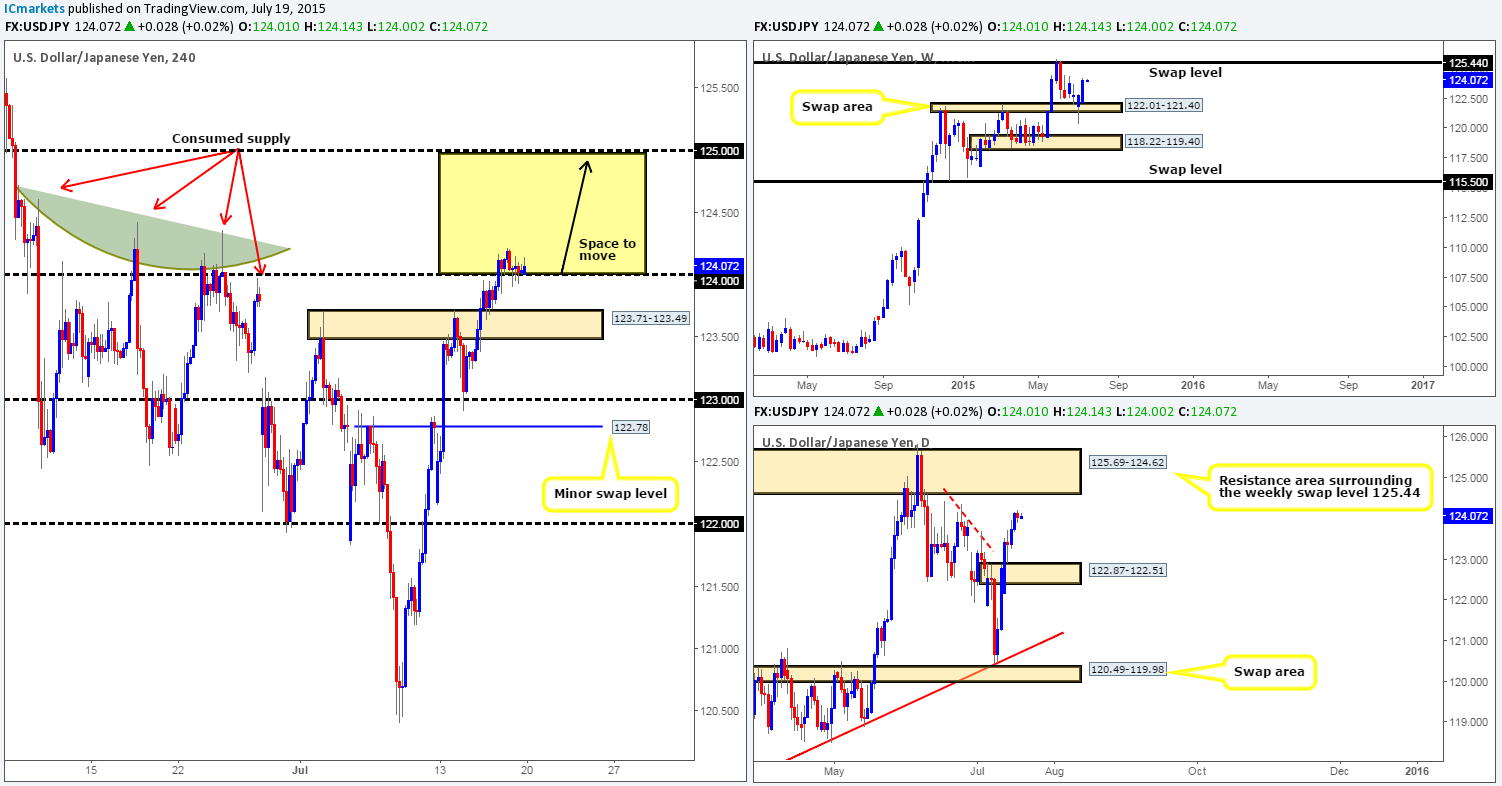
Weekly recap: Following the pin-bar reaction seen off of the weekly swap area at 122.01-121.40, last week’s activity saw further buying come into the market, gaining close to 130 pips on the week and closing relatively near its highs at 124.04. The next resistive barrier to keep an eye on is the weekly swap level coming in at 125.44. From the pits of the daily timeframe, however, it is clear that there is still room for this market to appreciate further going into this week at least until price connects with a daily resistance zone seen at 125.69-124.62 (surrounds the aforementioned weekly swap level). Take a look to the left of current price, the red-dashed trendline represents what we believe to be consumed supply (seen much clearer on the 4hr timeframe).
Friday’s movement on the 4hr timeframe shows price continued to tease the 124.00 number, which held firm going into the weekend. From this angle, we see very little active supply left above 124.00 until 125.00. Check out the potential supply consumption wicks seen marked with red arrows at: 123.97/124.36/124.43/124.61.
Going into this morning’s open 124.01 shows very little happened over the weekend, thus our original analysis from Friday remains legit.
This makes our objective today relatively simple – watch for lower timeframe confirmed price action around the 124.00 region. Should our team manage to spot an entry at this handle, we’ll likely enter long and target the 125.00 region for reasons stated above in bold.
Levels to watch/ live orders:
- Buys: 124.00 [Tentative – confirmation required] (Stop loss: depending on where one confirms this level).
- Sells: Flat (Stop loss: N/A).
USD/CAD:
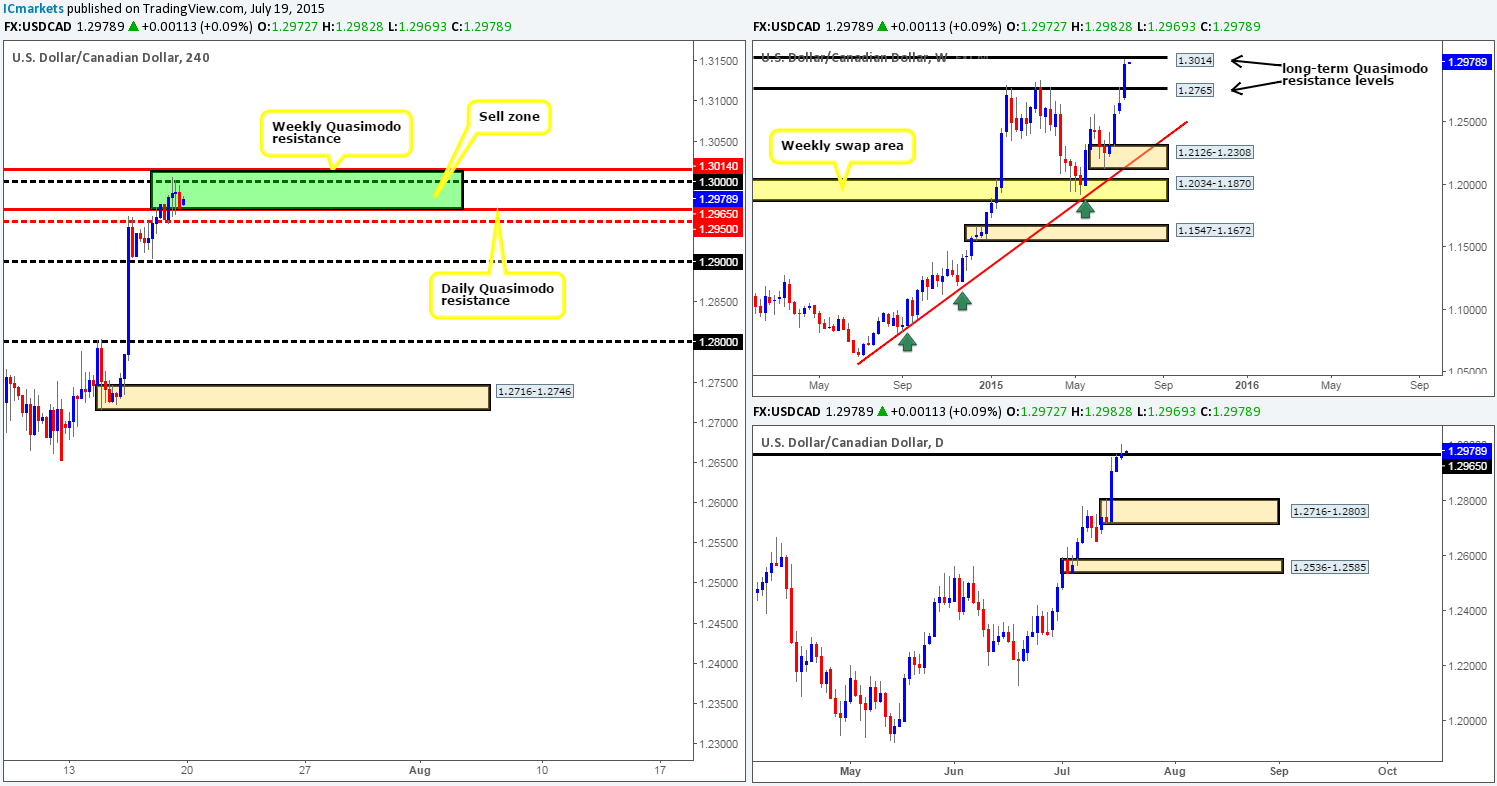
Weekly recap: The USD/CAD had a specular week last week, gaining a little over 300 pips. The pair closed out at 1.2967, missing the long-term weekly Quasimodo resistance level at 1.3014 by only a few pips! However, scanning on the daily scale shows a beautiful looking bearish pin-bar candle formed at the underside of a daily Quasimodo resistance level at 1.2965 on Friday, which, as you can see, has plenty of room to move lower should active sellers come into the market this week.
Moving lower to the 4hr timeframe, it is clear that the bears were far more interested in the large round number 1.3000 within our 4hr sell zone composed of the two higher timeframe Quasimodo resistance levels, resulting in price closing out the week on a full-bodied bearish candle.
Looking ahead, this morning’s trade opened at 1.2972 – five pips higher than Friday’s close. With that, price is, as you can see, still sitting within our 4hr sell zone (1.3014/1.2965) which could repel the market today/this week. However, taking into account the points made below, our team has come to a general consensus that it would be in our own best interest to wait for 1.2950 to be taken out before committing capital to this idea:
- Strong uptrend the USD/CAD is in right now.
- A fakeout could be seen above the upper limit of our sell zone (1.3014).
- Mid-level support seen just below at 1.2950.
Should 1.2950 be erased today, and we manage to find a suitable entry short on the retracement, our ultimate take-profit target comes in at the round number 1.2800, which if you look across to the daily chart, you’ll see it lines up beautifully with a daily demand area seen at 1.2716-1.2803. 1.2900, however, will, dependent on how price reacts at this barrier, be our first take-profit target.
Levels to watch/ live orders:
- Buys: Flat (Stop loss: N/A).
- Sells: 1.3014/1.2965 [Wait for 1.2950 to be consumed before taking a trade short] (Stop loss: dependent on where one finds confirmation).
USD/CHF:
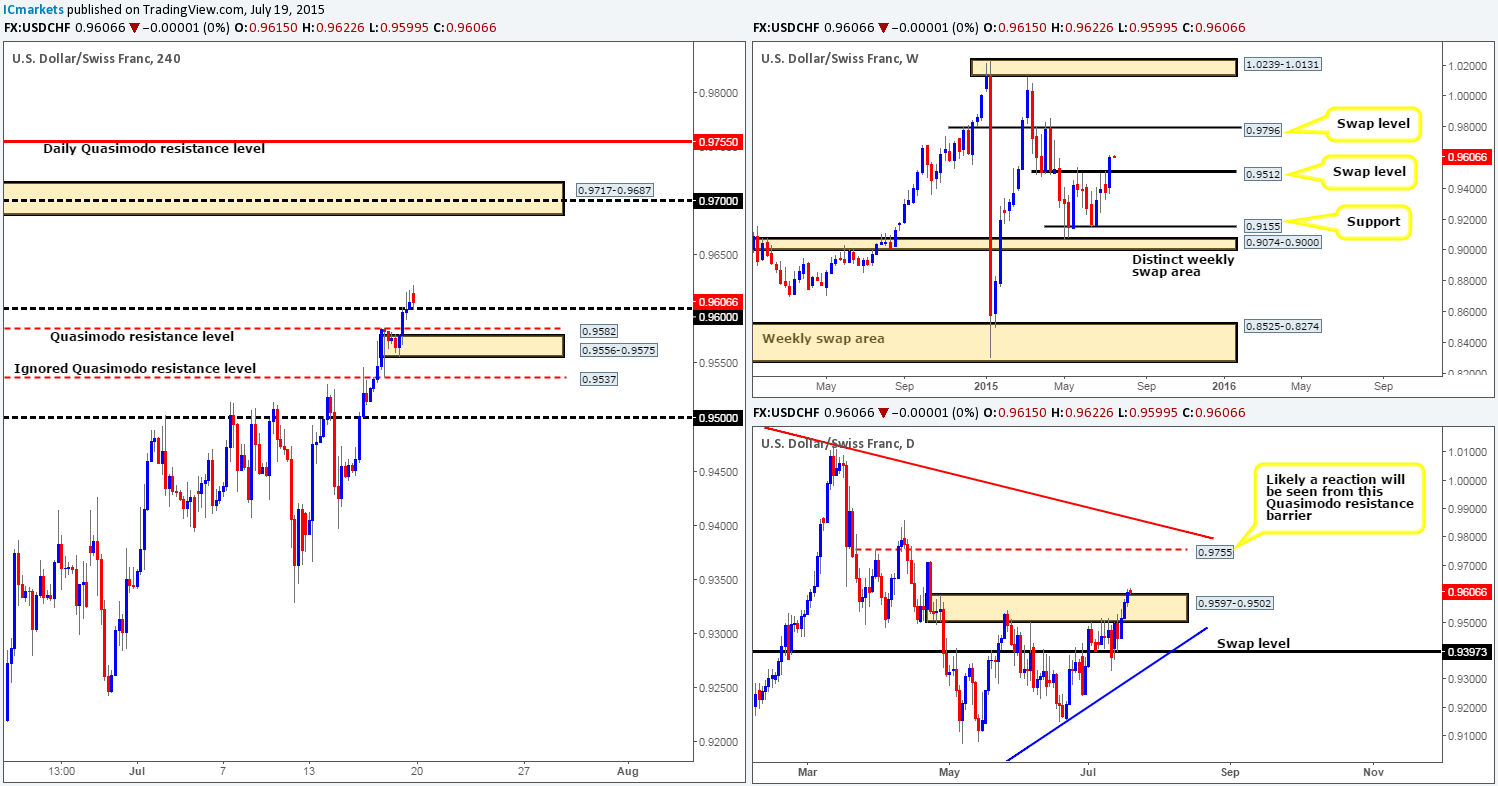
Weekly recap: Similar to the USD/CAD, the USD/CHF pair also had a rather eventful week with price taking out offers at the 0.9512 weekly swap level, and gaining 230 pips of value into the close 0.9606. The Daily timeframe on the other hand, reveals that price closed above a relatively significant daily supply area at 0.9597-0.9502 on Friday. This move came after three consecutive days of buying from the rebound seen off of a daily swap level at 0.9397 on Tuesday.
Moving down into the pits of the 4hr timeframe, both the 4hr Quasimodo resistance level at 0.9582 and the round number 0.9600 were consumed during Friday’s trade, consequently forming a relatively nice looking 4hr demand area at 0.9556-0.9575 in the process.
As we move into a new week, we can see that price opened at 0.9615 and has just this minute retested 0.9600 as support. Should 0.9600 hold today, we may see price rally this week up to a combined 4hr supply/round number area at 0.9717-0.9687/0.9700.
We say this quite confidently simply because both the weekly and daily timeframes show little resistance on the horizon until the weekly swap level seen at 0.9796, and daily Quasimodo resistance level at 0.9755.
Given the points made above, our prime focus today will be on looking for lower timeframe confirmed buy entries around 0.9600. The reason we require confirmation here comes down to our trust of round numbers. Although these levels hold on a regular basis, they are also prone to fakeouts as well. As such, our team usually waits to see if any fakeout takes place before considering a trade.
Levels to watch/ live orders:
- Buys: 0.9600 [Tentative – confirmation required] (Stop loss: dependent on where one confirms this level).
- Sells: Flat (Stop loss: N/A).
DOW 30:
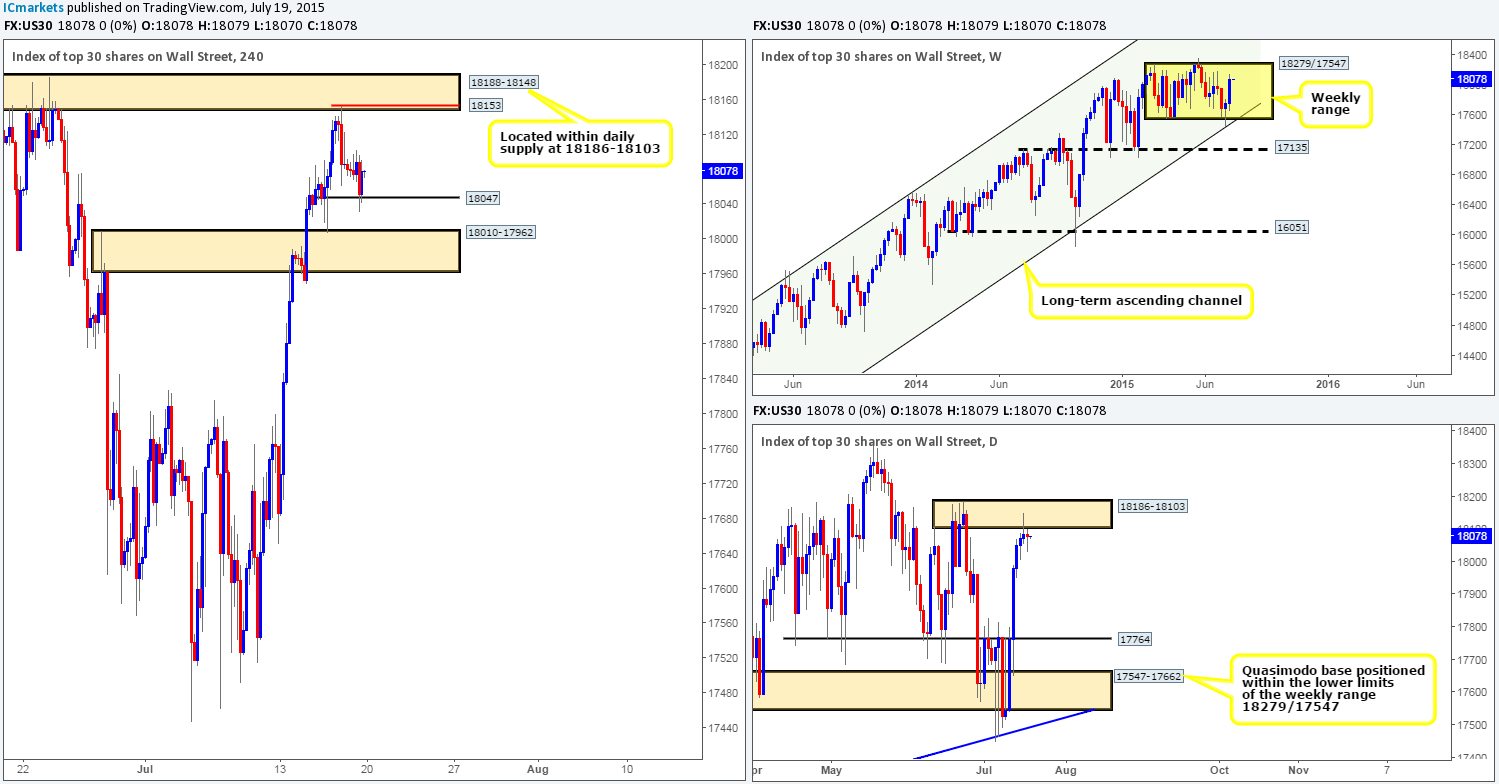
Weekly recap: Last week was certainly a nice week for anyone long this index. Price rallied a cool 315 points into the close 18078 as price drove higher into the current weekly range between 18279/17547. Nevertheless, as we move into the daily scale, we can see price printed a bearish pin-bar candle on Thursday off the back of a daily supply area seen at 18186-18103, which saw very little follow-through selling during Friday’s session indicating bear weakness was present at the close.
From a technical standpoint, the reason we believe why price never saw much follow-through selling on Friday likely comes from the small 4hr support level at 18047, which was highlighted (actually it was more of an area 18041/18085) as a potential supportive barrier in Friday’s analysis for anyone who was planning to short off of the daily bearish pin bar.
Pushing on, we can see that price began this week’s trade at exactly the same point it closed at last week, 18078. With that, we do not see any immediate opportunity to trade this index at this time.
We may be interested in shorting this market should price fake above Thursday’s high 18153 sometime this week as this number is located within not only 4hr resistance zone at 18188-18148, but also daily supply at 18186-18103 as well. We would not consider this a trade, however, until price showed some sort of selling confirmation on the lower timeframes, since let’s not forget that the initial reaction at the daily supply area just mentioned did not exactly depict bearish strength. As such, for now at least, we’re quite happy to sit back and see where this market takes us today.
Levels to watch/ live orders:
- Buys: Flat (Stop loss: N/A).
- Sells: Flat (Stop loss: N/A).
XAU/USD: (Gold)
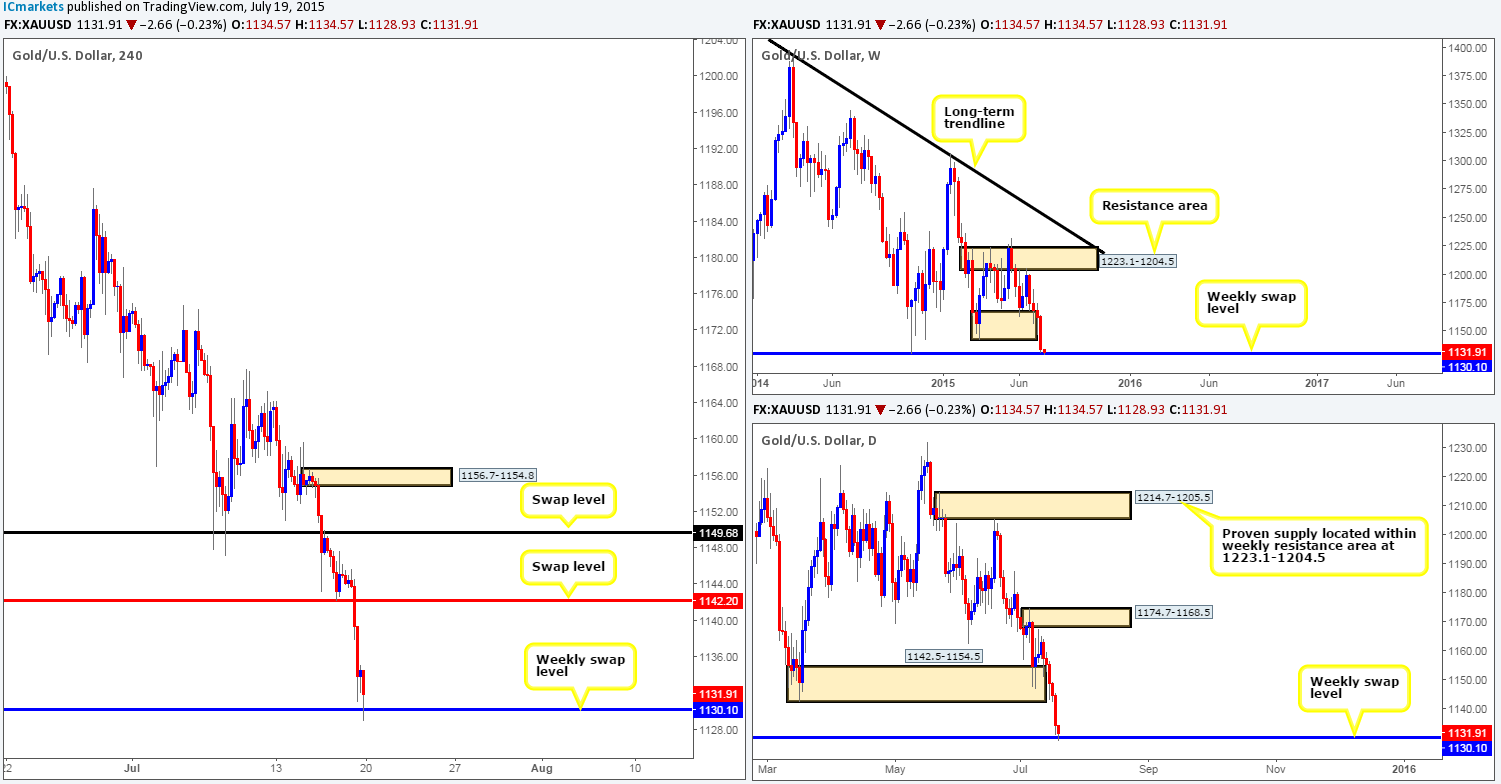
Weekly recap: Gold depreciated in value for the fourth consecutive week last week. This move took out both the weekly demand area at 1142.5-1167.3 and also its partner demand on the daily timeframe at 1142.5-1154.5, closing the week at 1134.5 just above a weekly swap level 1130.1.
Dropping down to the 4hr timeframe, we can see that price smashed through a floor of bids sitting around the 4hr swap level at 1142.2, and form two rejection/short-covering tails just above the aforementioned weekly swap level to end the week.
Going into this week’s sessions, price opened at Friday’s closing point at 1134.5 and has slipped lower to connect up with the weekly swap level mentioned above at 1130.1. Now, given that Gold is now trading at a historically respected barrier at the moment, naturally our team is currently favoring longs over shorts this week.
Nevertheless, even though we are trading at a high-probability turning point, we mustn’t forget that Gold is still in quite a steep weekly downtrend, and has recently seen four full weeks of continuous selling. Therefore, for us to be given the green light to enter long here we’d need to see price spike above the high 1135.0. This way, we can look to begin buying any dips seen on the lower timeframes, since at that point we can be quite confident that the path north is then likely clear up to the 4hr swap level 1142.2.
Levels to watch/ live orders:
- Buys: 1130.1 [Tentative – confirmation required] (Stop loss: dependent on where one confirms this level).
- Sells: Flat (Stop loss: N/A).


