
Key risk events today:
Limited.
(Previous analysis as well as outside sources – italics).
EUR/USD:
Weekly gain/loss: -0.56%
Weekly close: 1.0870
Weekly perspective:
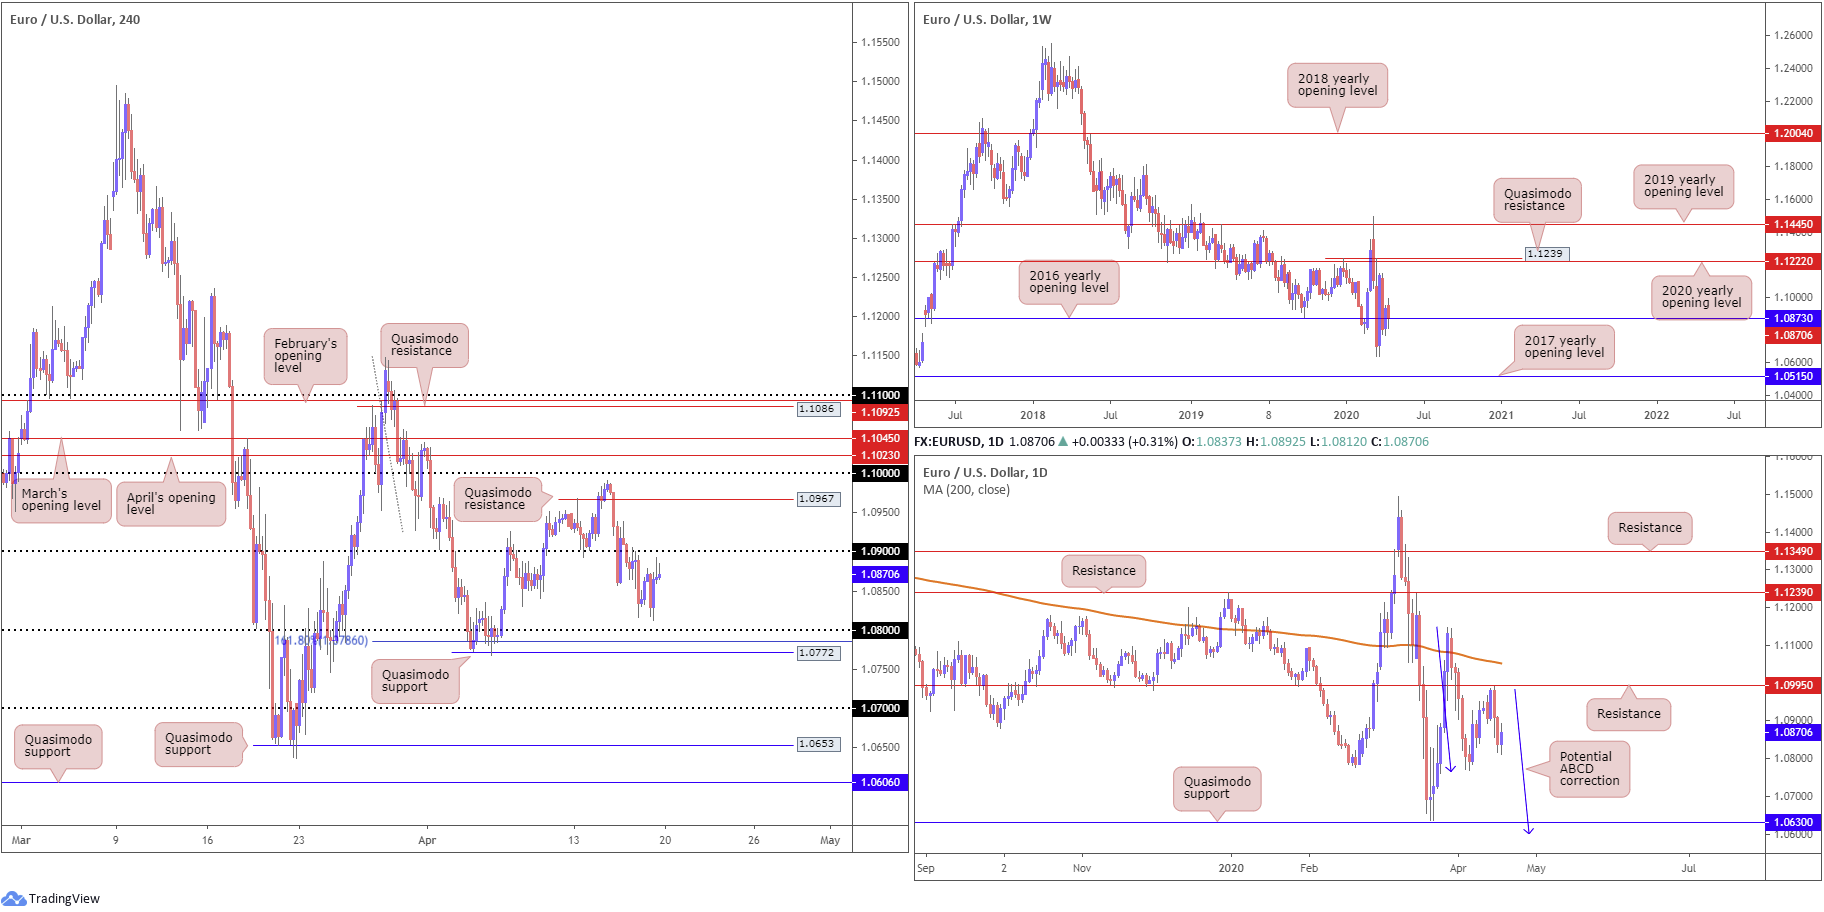
Price action, based on the weekly chart, remains linked with its 2016 yearly opening level at 1.0873. Skies above are reasonably blue; a run to the 2020 yearly opening level at 1.1222, shadowed by a Quasimodo resistance at 1.1239 is not out of the question. To the downside, multi-year lows at 1.0635 are in view, with follow-through moves shining the spotlight on the 2017 yearly opening level at 1.0515.
Daily perspective:
Over the course of last week, the daily candles ran into levels just south of resistance at 1.0995, stationed beneath a 200-day SMA (orange – 1.1052). Mid-week witnessed decisive selling, eventually dipping to lows at 1.0812 Friday. Although Friday concluded modestly bullish, continued downside could have the 1.0768 April 6 low come into existence. Beyond here, Quasimodo support at 1.0630 is also a viable floor, closely shadowed by a potential ABCD correction (blue arrows) at 1.0597.
H4 perspective:
With the US dollar index wrapping up the week beneath 100.00, off weekly highs at 100.30, this lifted EUR/USD north of 1.08 (shadowed closely by a 161.8% Fibonacci extension point at 1.0786 and Quasimodo support at 1.0772) to highs a touch off 1.09, shaped in the form of back-to-back shooting star candlestick configurations (bearish signals).
Above 1.09, there’s space towards Quasimodo resistance at 1.0967, though marking 1.0950 may also be an idea as these mid-round numbers can bounce price. Beyond 1.0768, technical eyes are likely fixed on 1.07, owing to the lack of H4 support in between.
Areas of consideration:
1.08, given its close connection with a 161.8% Fibonacci extension point at 1.0786 and Quasimodo support at 1.0772, could prompt an intraday rebound if brought into play this week. Conservative traders may seek additional candlestick confirmation prior to pulling the trigger, however, as round numbers are prone to whipsaws. In fact, a whipsaw to H4 Quasimodo support mentioned above at 1.0772 would not be a surprise, having seen the level positioned closely with the 1.0768 April 6 low highlighted on the daily timeframe.
In the event we conquer 1.0768, the pathway south appears clear for a run to 1.07, potentially unlocking the door for bearish scenarios. Likewise, moves above 1.09 could trigger breakout buying towards 1.0950/1.0967.
GBP/USD:
Weekly gain/loss: +0.25%
Weekly close: 1.2497
Weekly perspective:
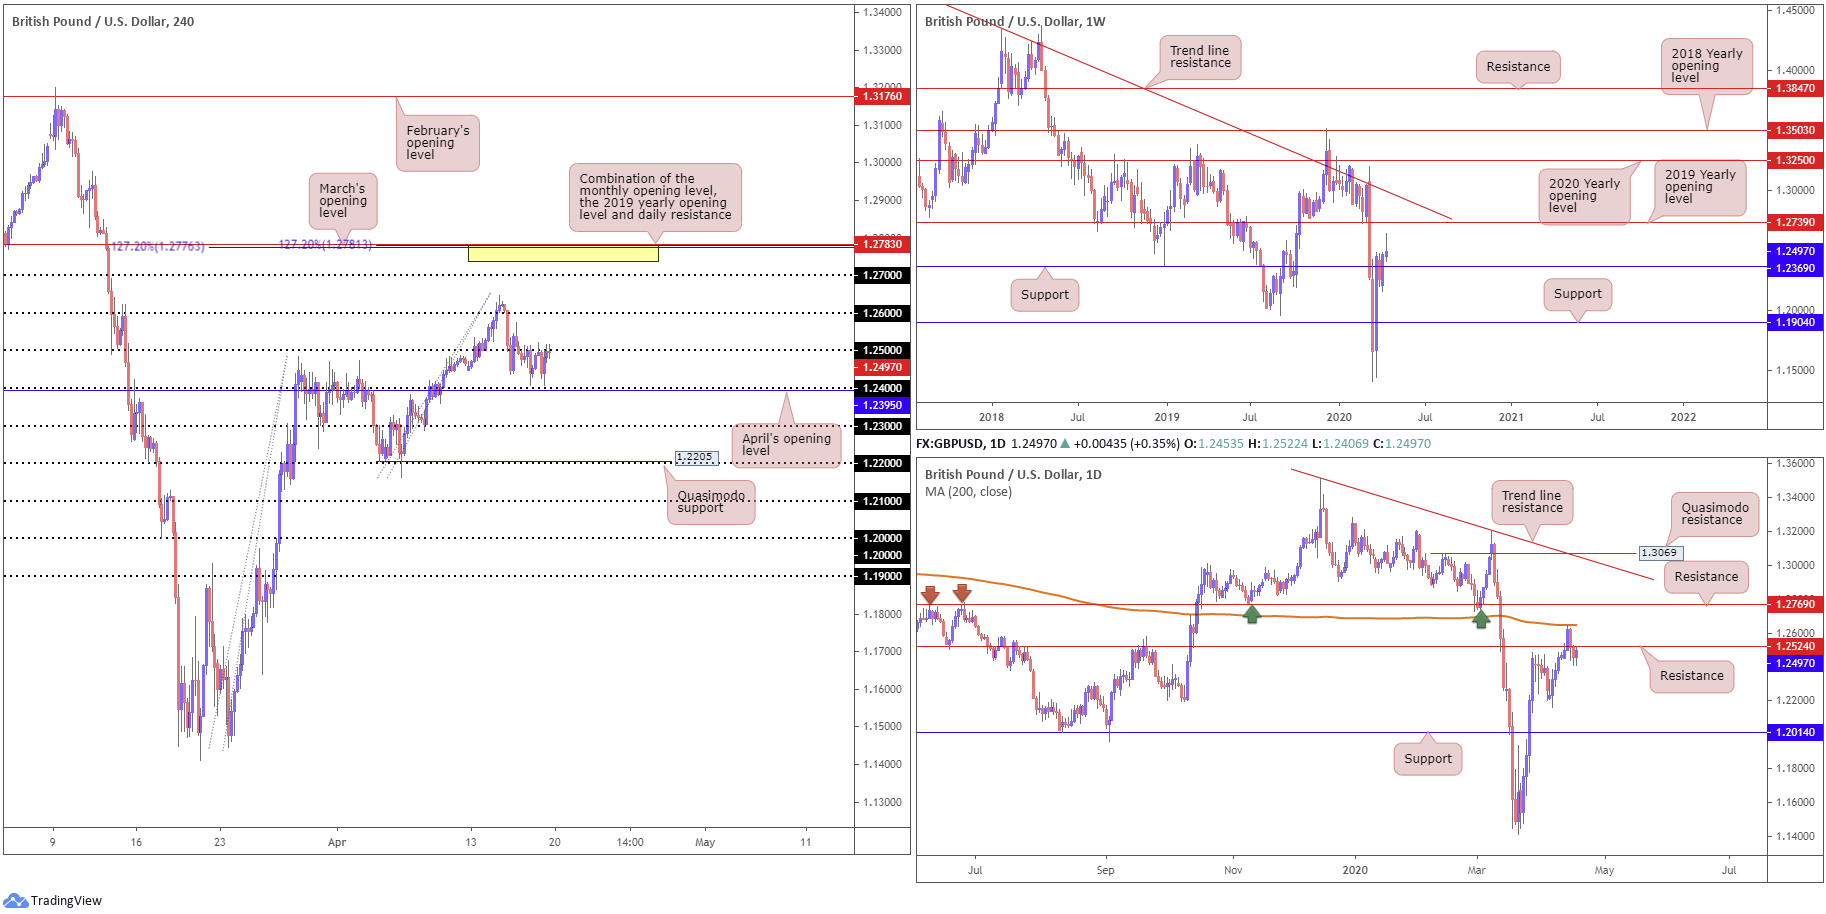
Failing to sustain gains north of 1.2647 saw GBP/USD return to a defensive play, such that price finished the week by way of a strong selling wick. Yet, sellers likely lack conviction here due to support residing around 1.2369.
The weekly timeframe also has resistance fixed around 1.2739, the 2019 yearly opening level, followed by a long-term trend line resistance, taken from the high 1.5930.
Daily perspective:
Lower on the curve, daily movement overrun support at 1.2524 last week, following Tuesday’s rejection off the 200-day SMA (orange – 1.2648).
Clearing 1.2524 not only opens up the possibility of a retest forming at the said base as resistance this week, it has likely shifted focus towards the 1.2163 April 7 low as the next viable support on this chart, assuming we overthrow weekly support underlined above at 1.2369.
H4 perspective:
GBP/USD relinquished 1.25 mid-week, with the figure containing downside thereafter. 1.24 also nearly made its way into the limelight, closely followed by April’s opening level at 1.2395. Outside of these areas, 1.26/3 are likely of interest.
Another area worth placing on the watchlist, although it may not come into effect this week, is March’s opening level at 1.2783. It holds closely with the 2019 yearly opening level on the weekly timeframe at 1.2739, daily resistance at 1.2769 (yellow) and two H4 127.2% Fibonacci extension levels at 1.2781 and 1.2776.
Areas of consideration:
With weekly support at 1.2369 circulating sub 1.24, a fakeout beneath the said round number to the weekly base is a potential scenario this week. A close back above 1.24 would, for most price-action traders, likely be considered a buy signal, given the weekly connection.
A breakout above 1.25, nevertheless, faces immediate resistance in the form of daily resistance at 1.2524. This will likely catch a lot of breakout traders off guard should 1.2524 still hold a sting. Prudent traders will likely wait for H4 price to clear the said daily base before pulling the trigger.
AUD/USD:
Weekly gain/loss: +0.17%
Weekly close: 0.6360
Weekly perspective:
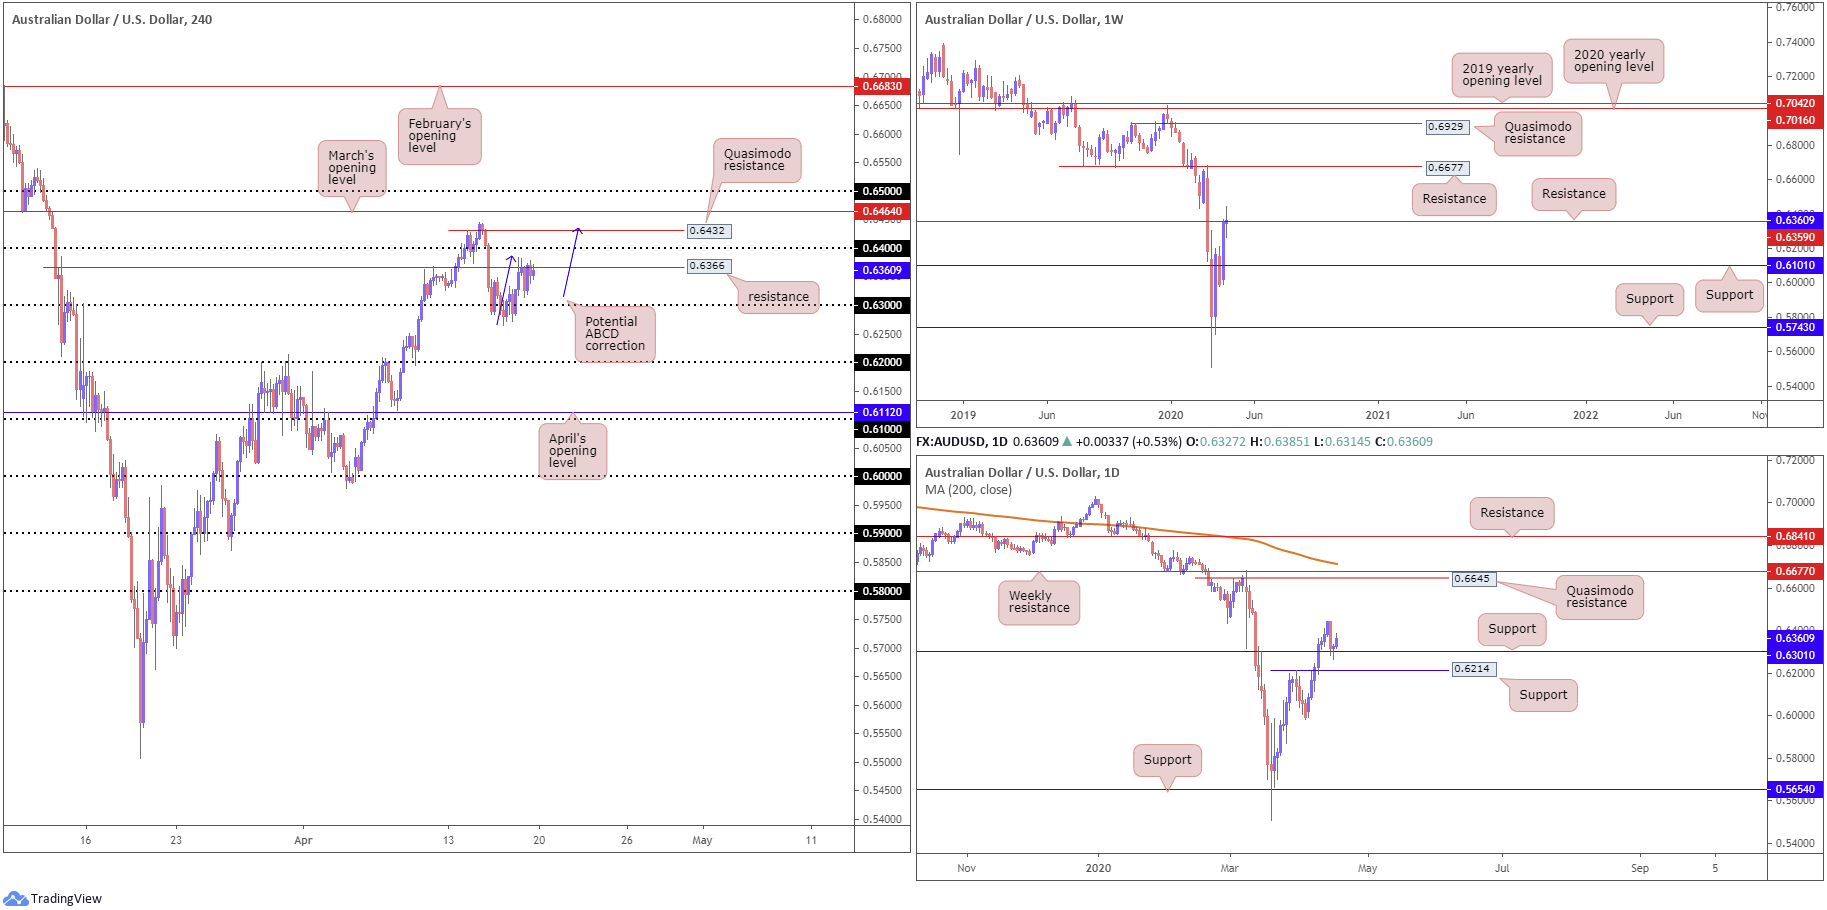
AUD/USD ended the week mostly unmoved despite ranging between 0.6444/0.6263. Key support rests at 0.6101, while moves higher has resistance priced in at 0.6677.
Daily perspective:
Mid-week saw gains capped around 0.6443, guiding daily flow to support at 0.6301 which, as you can see, held in the shape of a hammer candlestick pattern Thursday. With the bullish signal along with the help of USD selling, Friday witnessed a modest recovery to highs at 0.6385.
Aside from 0.6443, Quasimodo resistance at 0.6645 is seen, closely shadowed by the weekly resistance level mentioned above at 0.6677. South of support at 0.6301, 0.6214 could offer a possible floor – March 31 high.
H4 perspective:
Early trade Friday latched onto a relatively strong bid following details of the guidelines for phased re-opening in the US. Global equities finished higher across the board, lifting AUD/USD off 0.63 to resistance at 0.6366.
Structure above 0.6366 has 0.64 in view, with a break exposing nearby Quasimodo resistance at 0.6432 and March’s opening level at 0.6464. Note also a potential ABCD correction (blue arrows) may terminate around the said Quasimodo base.
Areas of consideration:
H4 Quasimodo resistance at 0.6432 echoes intraday strength. Not only does it come together with a H4 ABCD pattern, buy stops above 0.64 will likely provide liquidity to sell into. Short sellers off 0.6432 will likely position stop-loss orders above March’s opening level at 0.6464 and target waters beyond 0.6366.
A retest at 0.63 may also be of significance this week due to the round number converging with daily support plotted at 0.6301.
USD/JPY:
Weekly gain/loss: -0.78%
Weekly close: 107.51
Weekly perspective:
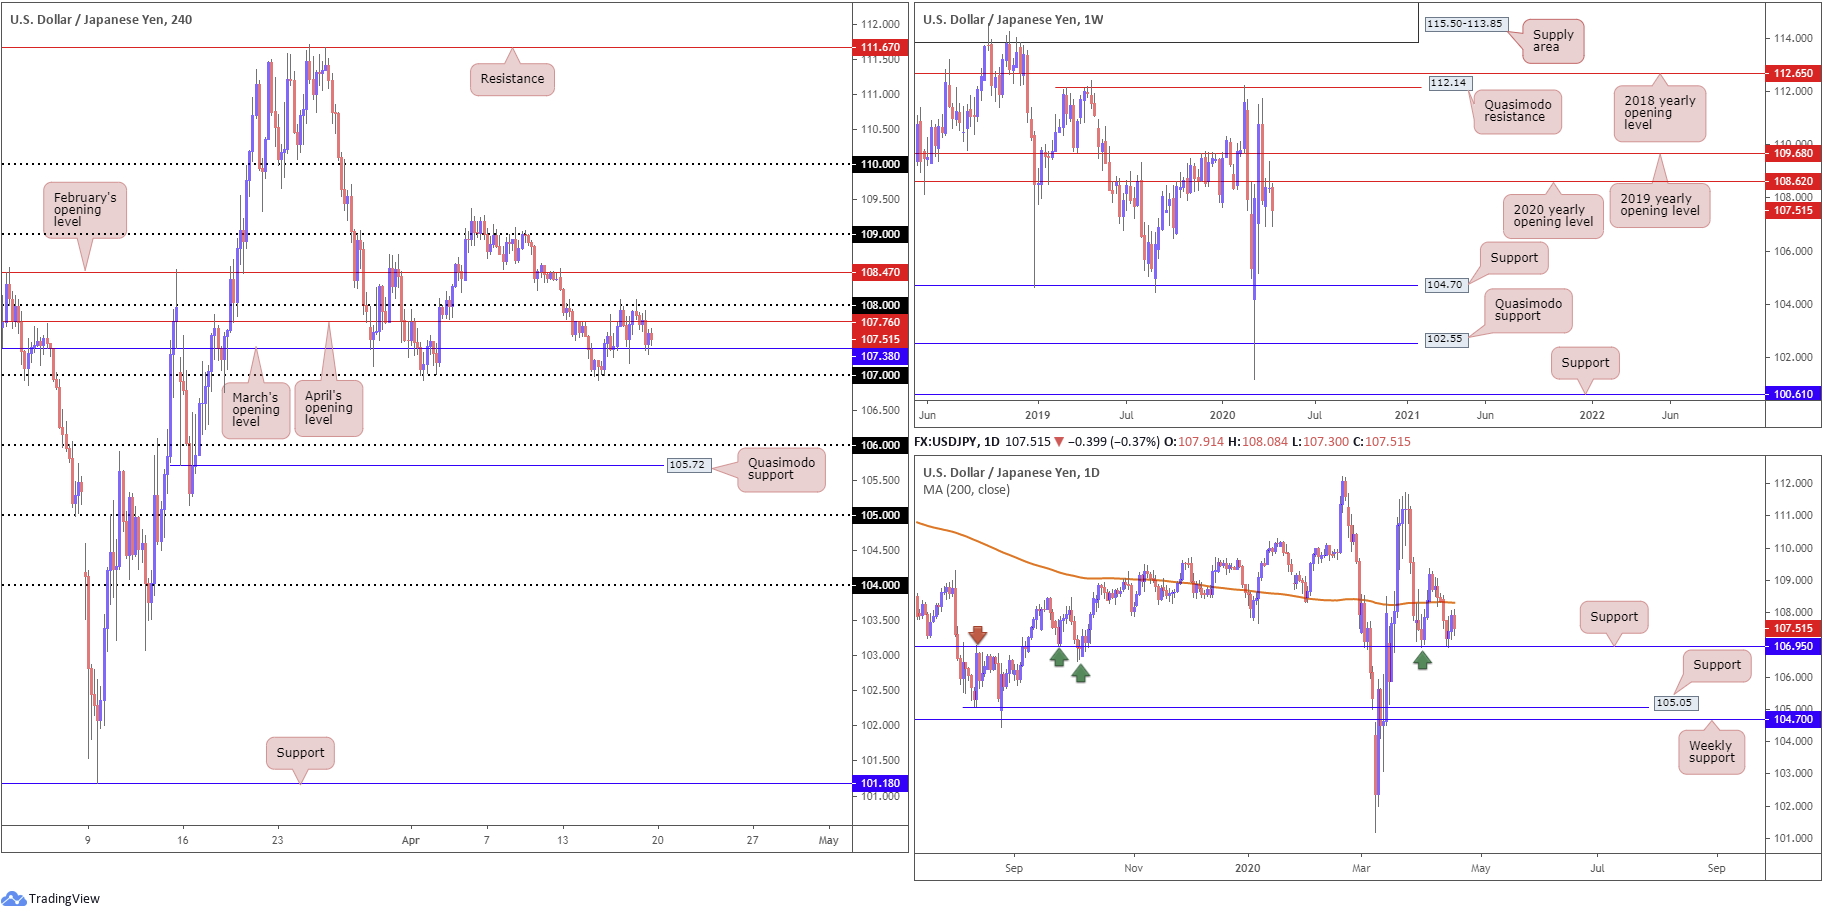
The vibe on the weekly timeframe continues to echo a bearish tone. Price action recently produced a clear-cut shooting star candlestick configuration off the 2020 yearly opening level at 108.62, with last week putting in a strong follow-through move to the downside to lows of 106.92.
The next support target is not seen until 104.70. Note this figure also represents the lower boundary of a multi-month range between Quasimodo resistance at 112.14.
Daily perspective:
Support at 106.95 made an appearance mid-week and held ground. Friday, despite reaching highs at 108.08, headed lower, snapping a two-day bullish phase. The 200-day SMA (orange – 108.30) stands as possible resistance this week, whereas a break through 106.95 could land the 105.05 support in the mix, followed by weekly support highlighted above at 104.70.
H4 perspective:
Since Thursday, the H4 candles have been busy carving out a consolidation between the 108 handle and March’s opening level at 107.38 (note in between this range we also have April’s opening level at 107.76 present). 107 is seen as viable support outside of the consolidation, along with February’s opening level at 108.47 as resistance.
Areas of consideration:
Traders may wish to acknowledge 107 aligns closely with daily support at 106.95, while February’s opening level at 108.47 comes in closely with the 200-day SMA at 108.30.
Weekly price suggesting lower levels certainly places a question mark on further gains above 108, though if we’re able to reach 108.47, active sellers are likely to enter the fray. The combination of daily support at 106.95 and 107 may also spark a reaction this week if tested.
USD/CAD:
Weekly gain/loss: +0.33%
Weekly close: 1.3997
Weekly perspective:
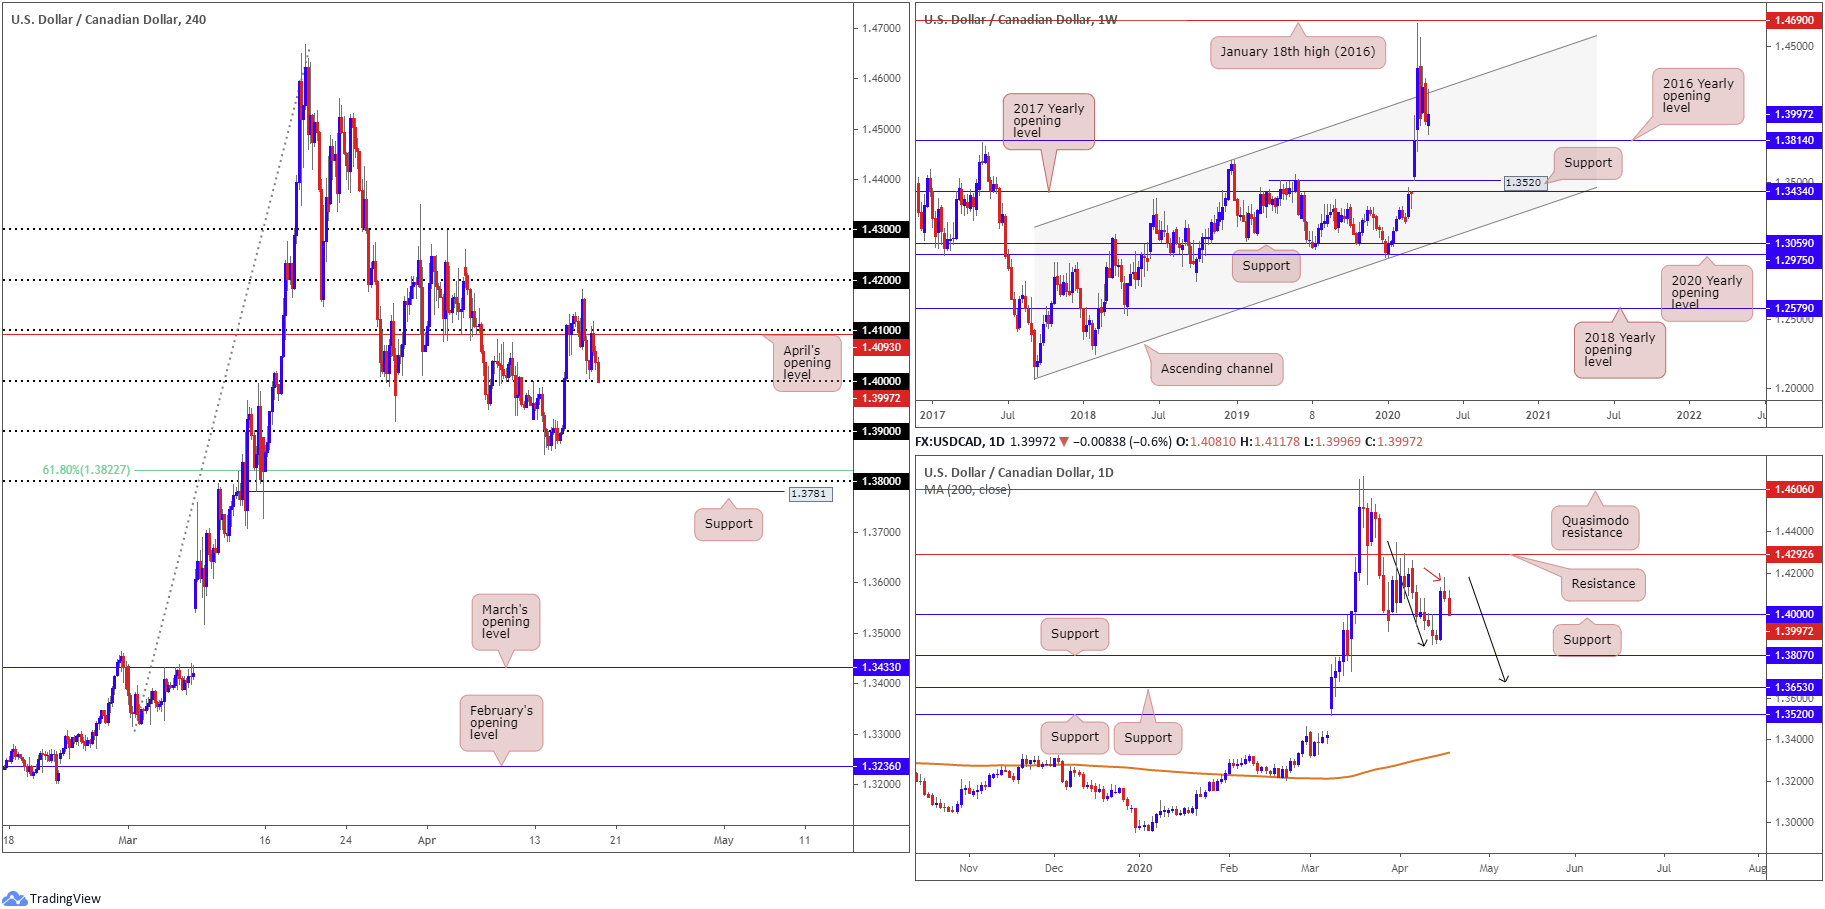
Long-term channel resistance, extended from the high 1.3661, showed up last week, capping upside off 1.4182. At this point, technical studies suggest we may see price action meet up with the 2016 yearly opening level at 1.3814 this week. Further selling, nevertheless, could see the 1.3661 December 31 2018 high enter the mix as possible support, with a breach revealing support at 1.3520, a prior Quasimodo resistance-turned support.
Daily perspective:
Thursday’s shooting star candlestick pattern (red arrow), forming off the underside of the current weekly channel resistance, helped generate selling Friday.
Testing support at 1.4000 into the close may prompt a recovery play in the early stages of trade this week. A break, however, may clear the river south for an approach to the 1.3855 April 13 low, alongside support from 1.3807. A break lower may also imply the formation of a D-leg to an ABCD pattern (black arrows) at 1.3674.
H4 perspective:
After clearing the remainder of buy stops above 1.41 amid US hours Thursday, Friday witnessed a retest form at the underside of the said figure as we headed into London. Boasting additional resistance by means of April’s opening level at 1.4093, price turned lower into the US session and closed the week marginally beneath the key figure 1.40, which, as we already know, also represents daily support.
Areas of consideration:
From a technical standpoint, 1.40 is in focus. Not only is it a widely watched psychological figure, it also denotes daily support, too. How much of a rebound we’ll see from here, though, is difficult to measure, knowing weekly structure indicates a run to 1.3814 might be instore this week.
In the event we do push through orders at 1.40, as the weekly timeframe suggests, a strong bearish move could be seen to at least 1.39, given the lack of support on the H4 timeframe between here and daily price not expecting to tackle any form of support until reaching the 1.3855 April 13 low.
USD/CHF:
Weekly gain/loss: +0.15%
Weekly close: 0.9666
Weekly perspective:
Although ranging more than 130 points, USD/CHF settled virtually unchanged on the week, putting forward what appears to be a long-legged doji indecision candle.
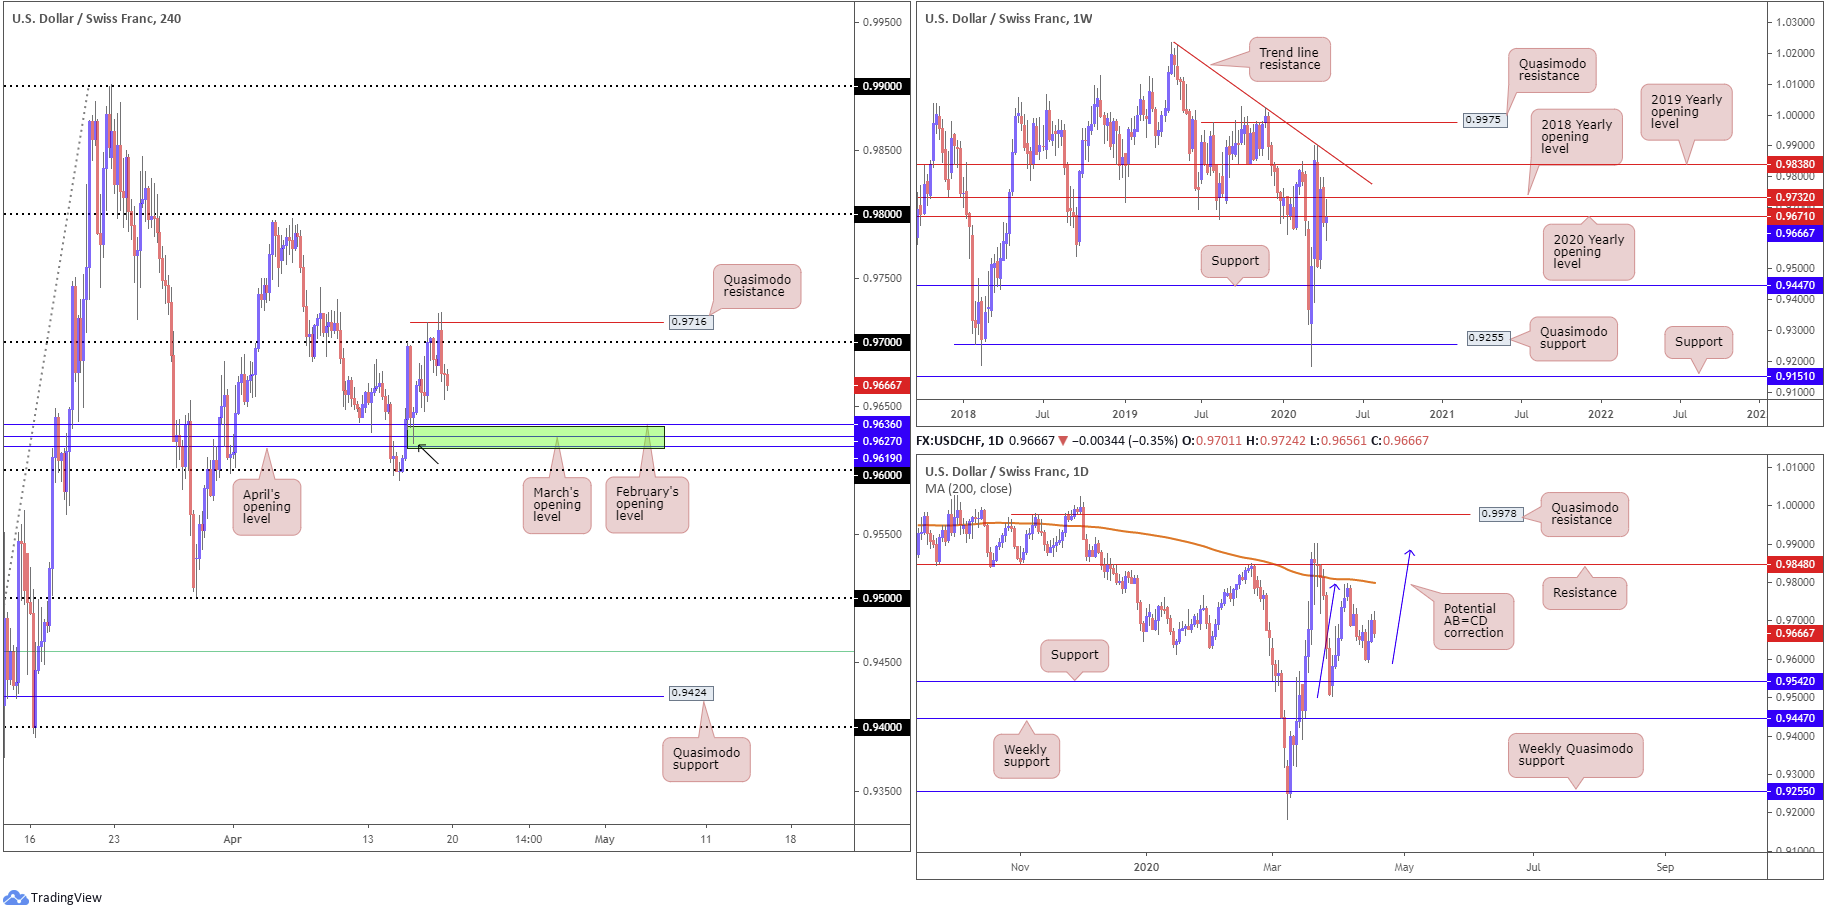
Structurally, though, the unit trades a few points under the 2020 yearly opening level at 0.9671, with last week’s high at 0.9724 almost drawing in the 2018 yearly opening level at 0.9732. Interestingly, should sellers hold ground this week, this may be enough to light up support at 0.9447.
Daily perspective:
The daily timeframe, as of the week’s close, offers little in terms of support or resistance. To the upside, resistance is unlikely to emerge until reaching the 200-day SMA (orange – 0.9799), accompanied by 0.9848 and a potential AB=CD correction (blue arrows) at 0.9886. Lower on the curve we have support priced in at 0.9542, situated just ahead of weekly support emphasised above at 0.9447.
H4 perspective:
USD/CHF failed to build on the mid-week recovery Friday, facing rejection off 0.9724 and retreating to lows of 0.9656 into the close. Recent movement also chalked up a Quasimodo resistance at 0.9716, which could play a role in price movement this week.
To the downside, 0.9619/0.9636, an area made up of April, March and February’s opening levels, is perhaps on the radar for many this week, in light of Wednesday’s healthy recovery from the zone (black arrow). Another essential point to consider here, however, is the possibility of a fakeout through 0.9619/0.9636 to 0.96.
Areas of consideration:
For those who read Friday’s technical briefing you may recall the following point (italics):
One possible scenario worthy of attention is a fakeout above 0.97, followed by a test of 0.9732 and a dip back beneath 0.97. Likely fuelled on the back of buy-stop liquidity above 0.97 and weekly sellers, we may see a wave of selling materialise.
Price came within eight points of tagging the 2018 yearly opening level at 0.9732 on the weekly timeframe before spiralling south. Although some traders may have still caught this move, a fakeout through 0.97 to 0.9732 still remains a potential setup this week.
Moves out of 0.9619/0.9636 are also a possibility, though do bear in mind that not only does this area carry limited higher-timeframe confluence, there is a strong possibility of a whipsaw to 0.96 before buyers step in, if at all.
Dow Jones Industrial Average:
Weekly gain/loss: +2.09%
Weekly close: 24263
Weekly perspective:
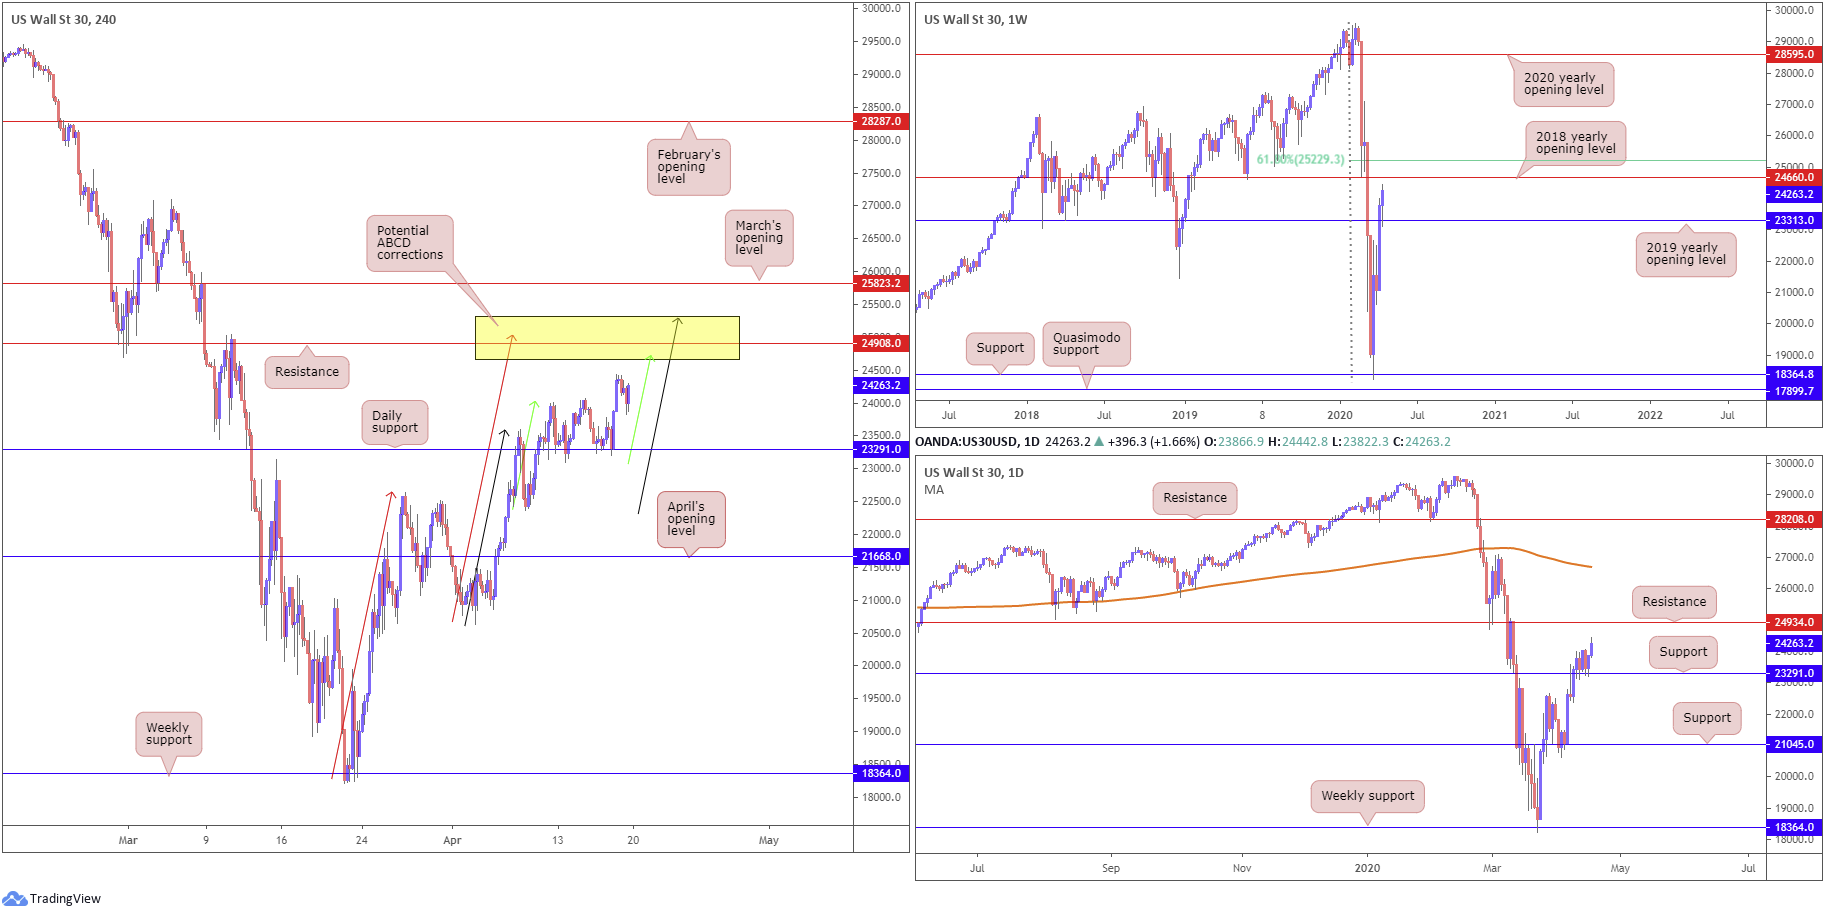
Following a retest off the 2019 yearly opening level at 23313, price action advanced to highs at 24442. This draws the 2018 yearly opening level at 24660 into striking distance, followed by a 61.8% Fibonacci retracement at 25229.
Daily perspective:
Support at 23291 remains a dominant fixture on the daily timeframe, withstanding a number of downside attempts in recent trading. Thursday’s reaction, coupled with follow-through buying on Friday, marks resistance at 24934 as a potential upside objective this week.
H4 perspective:
US equities received fresh impetus in early hours Friday, following details of the re-opening guidelines for the US economy, and positive results from clinical trials of Gilead’s Remdesivir for treatment on COVID-19 patients. The Dow Jones Industrial Average added 704.81 points, or 2.99%; the S&P 500 also gained 75.01 points, or 2.68%, and the tech-heavy Nasdaq 100 concluded higher by 74.58 points, or 0.85%.
Despite a modest retreat off session peaks at 24442 to lows at 23822 amid US hours, Friday’s advance positions price action within striking distance of 25317/24660. The zone is made up of a H4 resistance level at 24908, three potential ABCD completions at 25028 (red arrows), 25317 (black arrows) and 24759 (green arrows), daily resistance at 24934 and weekly resistance in the form of the 2018 yearly opening level at 24660.
Areas of consideration:
For those who read our recent technical analysis you may recall the following piece (italics):
In view of the technical picture presented here, daily support at 23291 and the 2019 yearly opening level on the weekly timeframe at 23313 denote a potential buy zone today.
Well done to any readers who managed to jump on board the move from daily support at 23291 Thursday – the week ended strongly.
Given the number of technical levels converging within 25317/24660, this will likely garner interest this week if tested. Not only is the area an ideal take-profit zone for longs off daily support at 23291, the zone also offers a base for potential bearish scenarios.
XAU/USD (GOLD):
Weekly gain/loss: -0.78%
Weekly close: 1681.6
Weekly perspective:
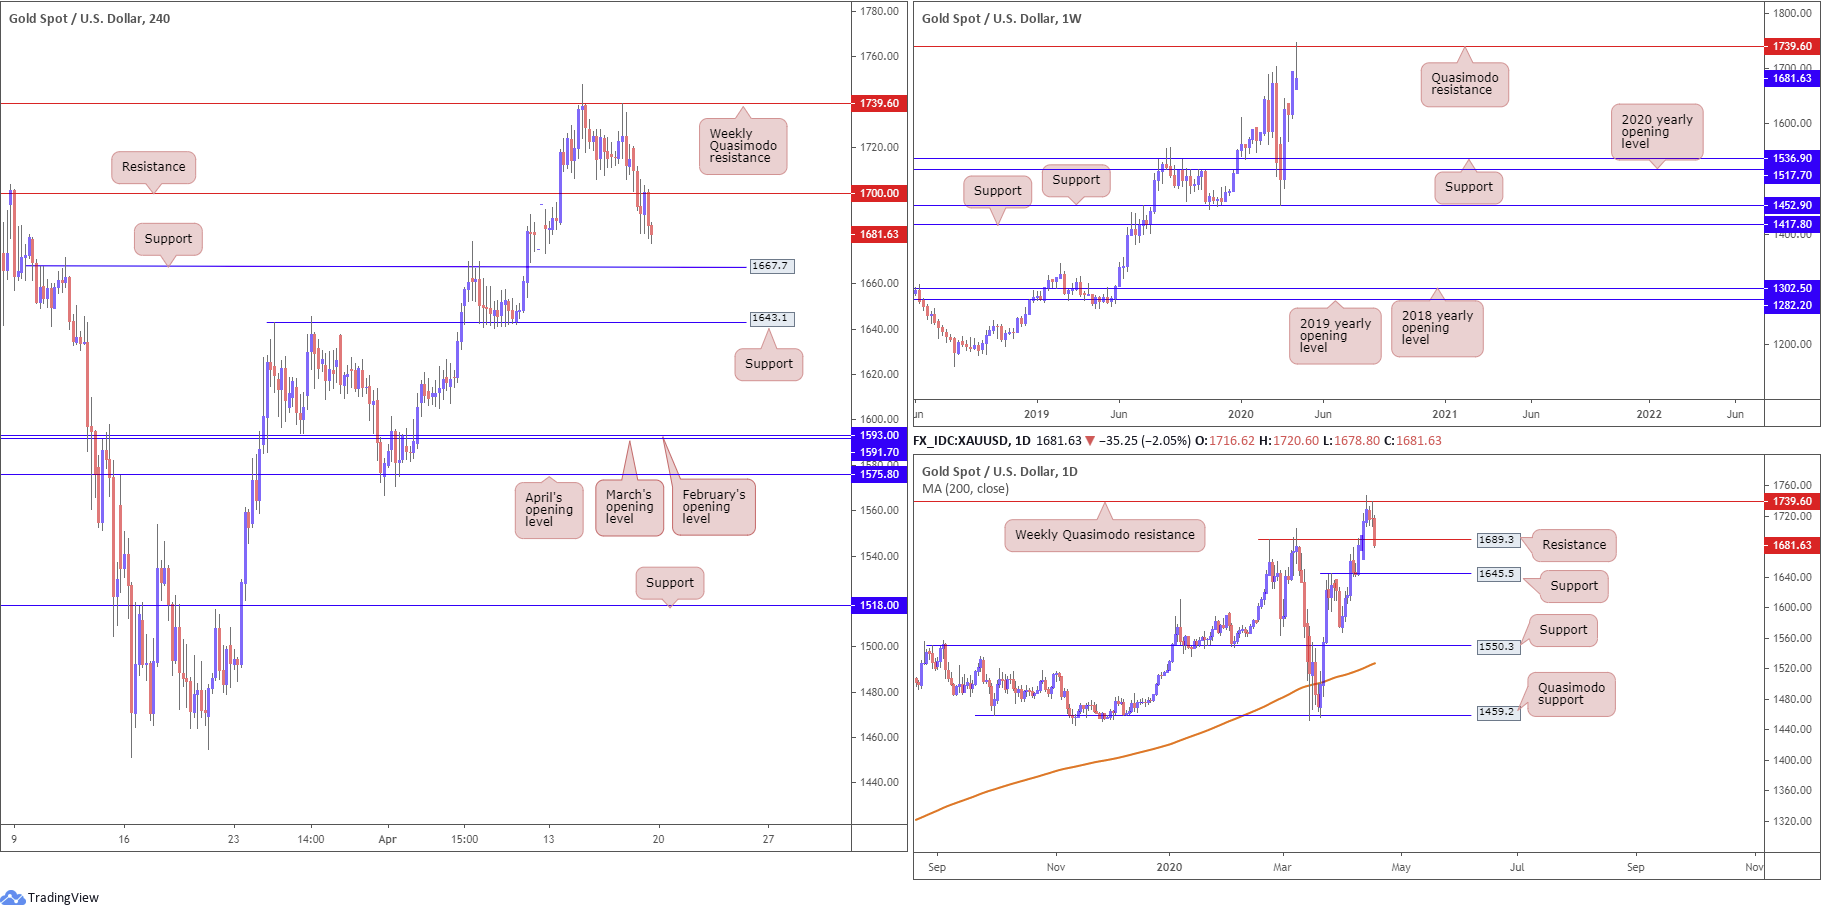
Clocking highs at 1747.7, levels not seen since November 2012, we can see the week concluded shaped as a clear-cut shooting star candlestick pattern (considered a bearish signal) off Quasimodo resistance at 1739.6. This will likely excite candlestick enthusiasts, with some perhaps setting sell-stop entry orders south of last week’s low 1663.0.
In terms of support on this scale, the river appears relatively ‘ripple free’ until reaching support at 1536.9.
Daily perspective:
Looking at gold from a daily viewpoint, Friday marginally engulfed support at 1689.3 (now a potential resistance) and possibly set the stage for an approach to support coming in at 1645.5, with a break revealing the 1567.8 April 1 low.
H4 perspective:
A quick recap of Friday’s price movement on the H4 timeframe reveals bullion overthrew support at 1700.0 and retested the base as resistance going into US hours. Support resides close by at 1667.7 as well as another layer of support seen calling for attention at 1643.1 (essentially the same level as daily support at 1645.5).
Areas of consideration:
Weekly price bringing in Quasimodo resistance and forming a strong bearish candlestick signal, as well as daily action dethroning support at 1689.3 and showing room for an approach to 1645.5, this could see the H4 candles either retest 1700.0 for a second time or take a run (and likely break) support at 1667.7.
A retest at 1700.0 is likely viewed as a strong base of resistance and, therefore, could attract selling should the level re-enter the fold this week. Breakout selling beneath 1667.7 is also an option some traders may explore if we navigate waters beneath this base, targeting daily/H4 support around the 1645ish range as an initial take-profit zone.
The accuracy, completeness and timeliness of the information contained on this site cannot be guaranteed. IC Markets does not warranty, guarantee or make any representations, or assume any liability regarding financial results based on the use of the information in the site.
News, views, opinions, recommendations and other information obtained from sources outside of www.icmarkets.com.au, used in this site are believed to be reliable, but we cannot guarantee their accuracy or completeness. All such information is subject to change at any time without notice. IC Markets assumes no responsibility for the content of any linked site.
The fact that such links may exist does not indicate approval or endorsement of any material contained on any linked site. IC Markets is not liable for any harm caused by the transmission, through accessing the services or information on this site, of a computer virus, or other computer code or programming device that might be used to access, delete, damage, disable, disrupt or otherwise impede in any manner, the operation of the site or of any user’s software, hardware, data or property.


