
Key risk events today:
UK Final Manufacturing PMI; Canada Manufacturing PMI; US ISM Manufacturing PMI.
(Previous analysis as well as outside sources – italics).
EUR/USD:
Weekly gain/loss: -0.31%
Weekly close: 1.2132
Weekly perspective:
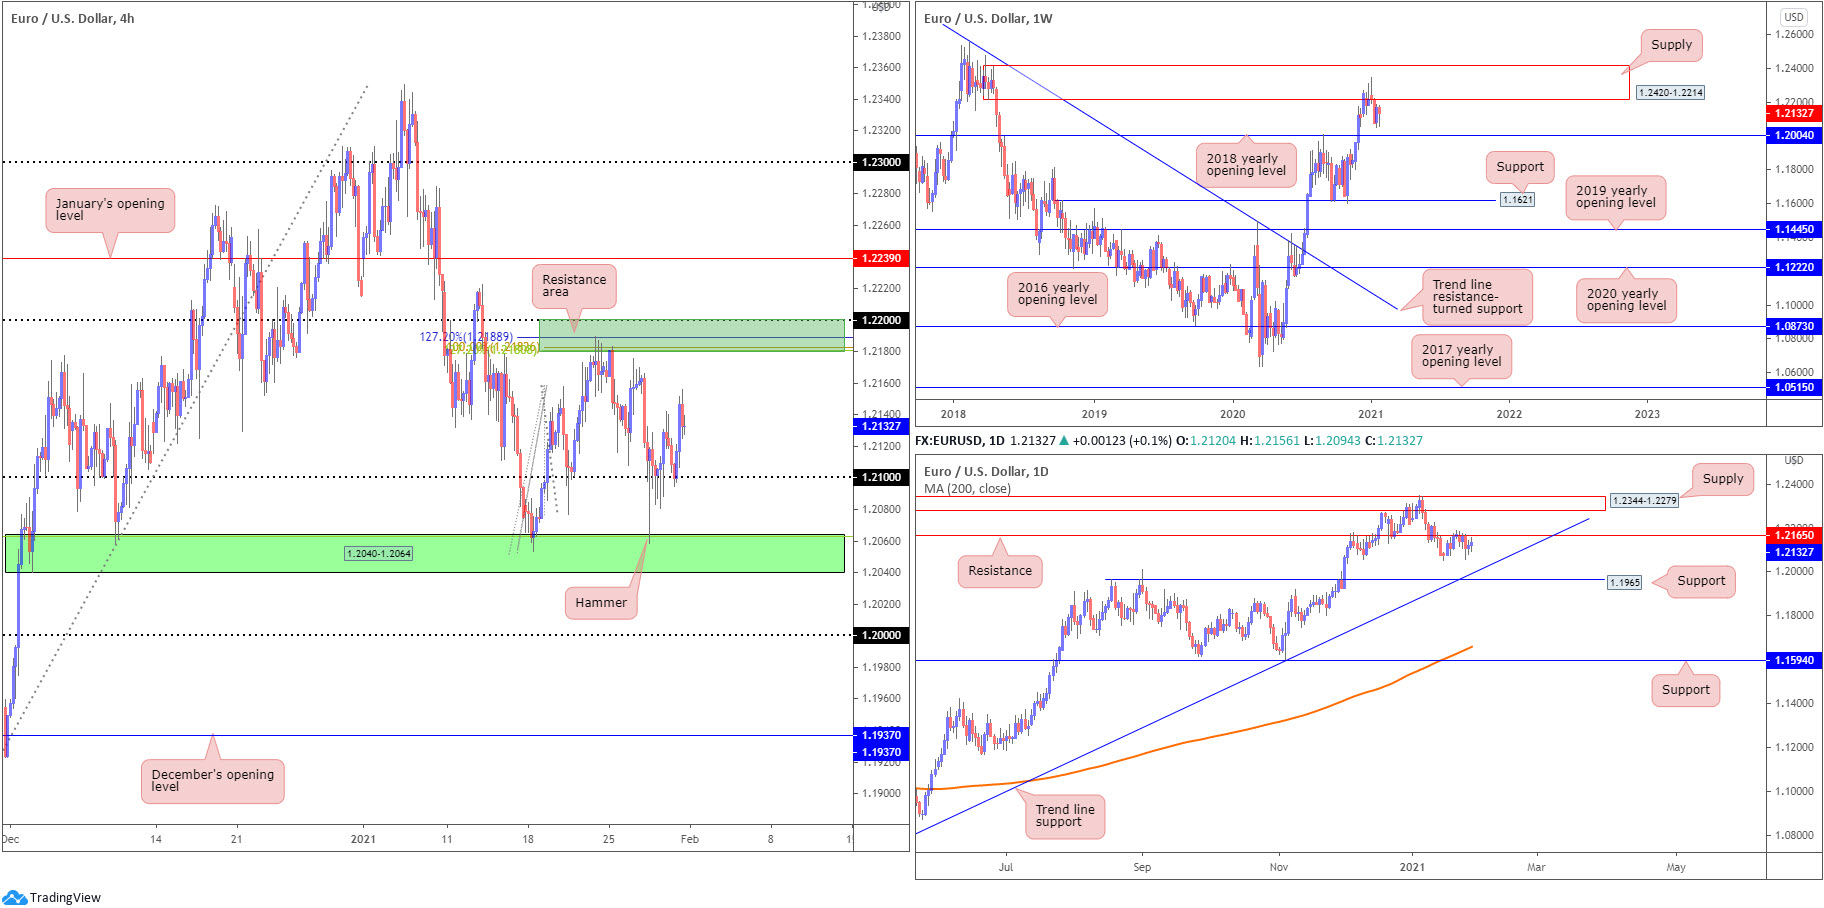
Sellers, as you can see, continue to hold territory south of supply at 1.2420-1.2214. This is an area that boasts healthy downside momentum from its base formed April 2018.
The 2018 yearly opening value at 1.2004 is in the crosshairs as potential support, should sellers make a push this week.
Trend studies reveal upside has remained favoured since price bottomed at 1.0637 in March 2020, movement which eventually overthrew trend line resistance, extended from the high 1.2555. For that reason, long-term dip-buyers may surface from 1.2004 if tested.
Daily perspective:
Resistance at 1.2165—an active S/R level since June 2010—has played an important role in capping buyers since January 21. Should 1.2165 give way this week, supply drawn from 1.2344-1.2279 (nestled within the walls of weekly supply mentioned above at 1.2420-1.2214) could work its way back into the spotlight.
Lower on the curve, however, trend line support, taken from the low 1.0774, is seen, plotted just north of support at 1.1965, a previous Quasimodo resistance level.
H4 perspective:
After Friday retested the 1.21 figure and formed a bullish pivot reversal, Europe’s shared currency managed to remain on the front foot against the US dollar. This followed Wednesday’s hammer pattern, a move that whipsawed through 1.21 into the jaws of H4 demand at 1.2040-1.2064.
Any sustained move north of 1.21 throws H4 resistance at 1.22-1.2180 (composed of the 1.22 figure and a collection of Fibonacci ratios) back into the mix. Further buying may also shine the torch on January’s opening value at 1.2239.
Areas of consideration:
- Trend: higher since the beginning of 2020.
- 21 (support) based on the H4 timeframe, though offers limited confluence.
- 22-1.2180 has proven itself in January as resistance on the H4.
- The round number 1.22 and lower edge of weekly supply at 1.2214 is a resistance zone that may enter play sometime this week.
- Daily resistance at 1.1265, although in isolation on the daily scale, is planted just south of resistance at 1.22-1.2180 on the H4.
GBP/USD:
Weekly gain/loss: +0.12%
Weekly close: 1.3689
Weekly perspective:
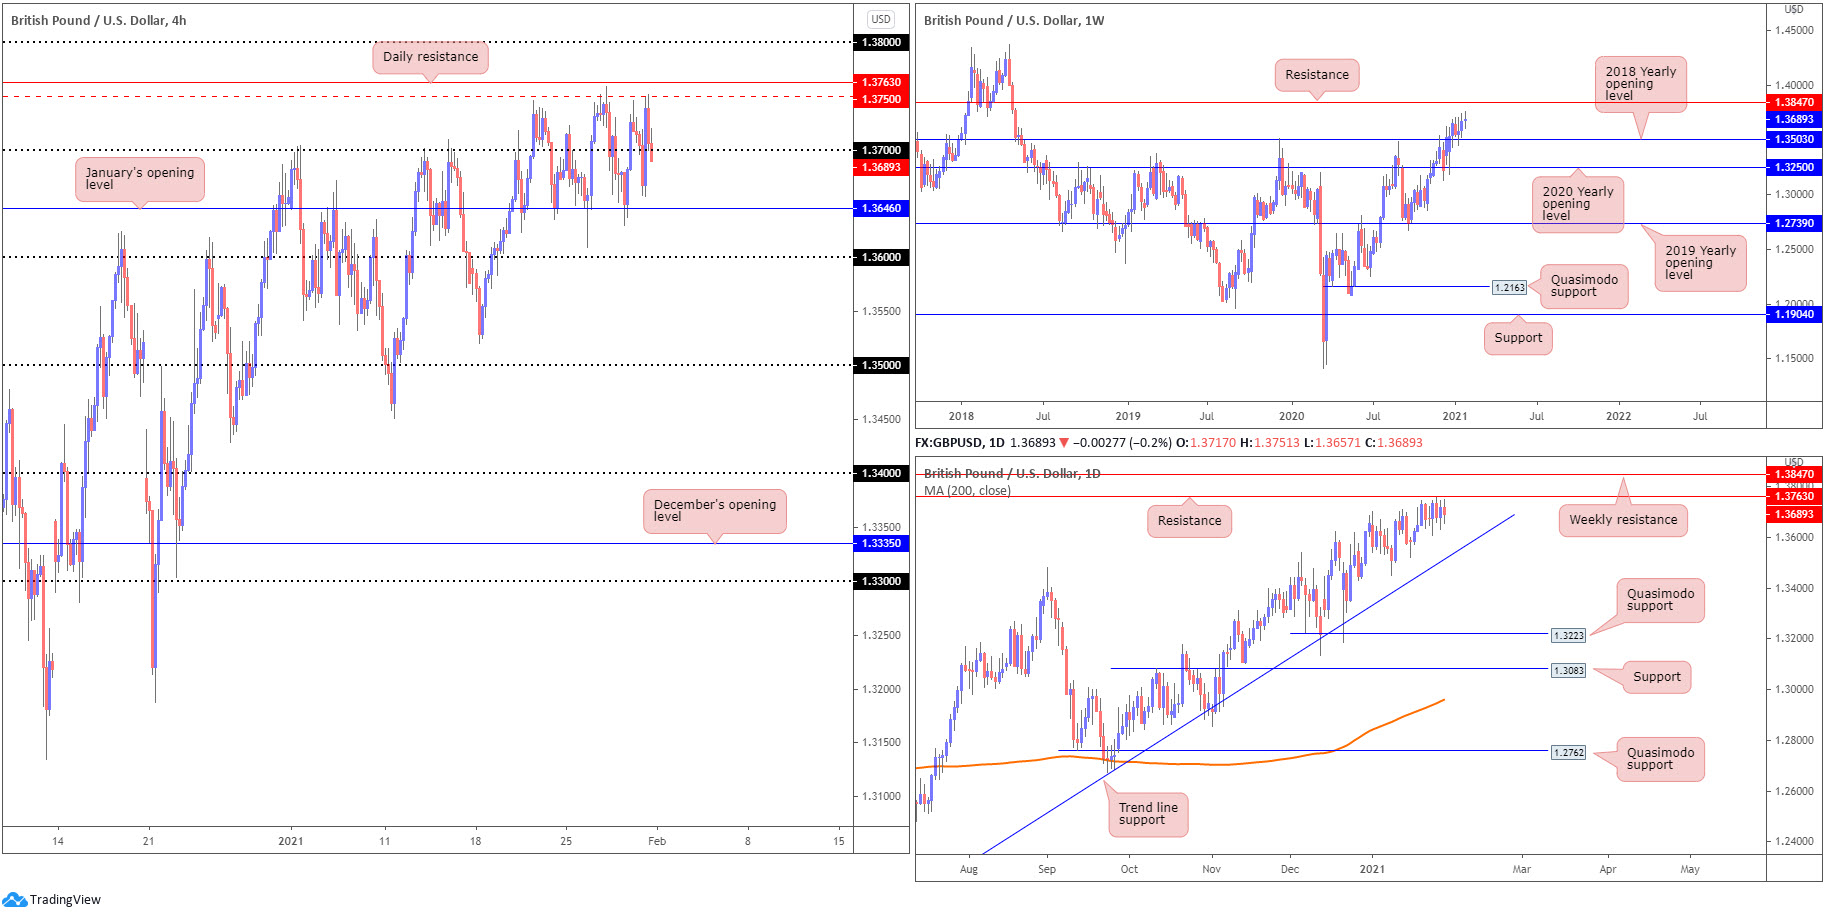
Orbiting fresh 33-month peaks, GBP/USD, although modestly higher last week, formed an indecision doji candle north of 1.3503—the 2018 yearly opening value. In a market trending higher since 2020, this stands long-term buyers in a favourable position, targeting resistance at 1.3847.
As highlighted in previous weekly reports, of technical interest is the recent engulf of 1.3514 (December 9 [2019] high), helping to confirm the current uptrend.
Daily perspective:
Buyers and sellers, once again, finished the week battling for position just south of a resistance level at 1.3763, a previous Quasimodo support level.
Trend line support, taken from the low 1.1409, is a visible downside target; breaking 1.3763, on the other hand, directs attention to the weekly resistance highlighted above at 1.3847.
H4 perspective:
January’s opening value at 1.3646 remains immediate support on the H4 scale, a level that’s proven effective since January 20. Directly overhead, the 1.37 figure has offered soft support/resistance, with focus largely on 1.3750, placed just beneath daily resistance mentioned above at 1.3763. In fact, many technical analysts have labelled the H4 timeframe rangebound between 1.3646 and 1.3750.
Above 1.3763 on the H4 shines the spotlight on the 1.38 figure, with a break possibly setting the stage for subsequent buying towards weekly resistance at 1.3847.
Areas of consideration:
- Trend: higher since 2020.
- Range traders may find use in the H4 timeframe’s consolidation between 1.3750 and 1.3646. Given the uptrend, traders may opt for longs at range support this week.
- Daily resistance at 1.3763 is a worthwhile note, with a break exposing 1.38 on the H4 and then weekly resistance at 1.3847.
AUD/USD:
Weekly gain/loss: -0.95%
Weekly close: 0.7638
Weekly perspective:
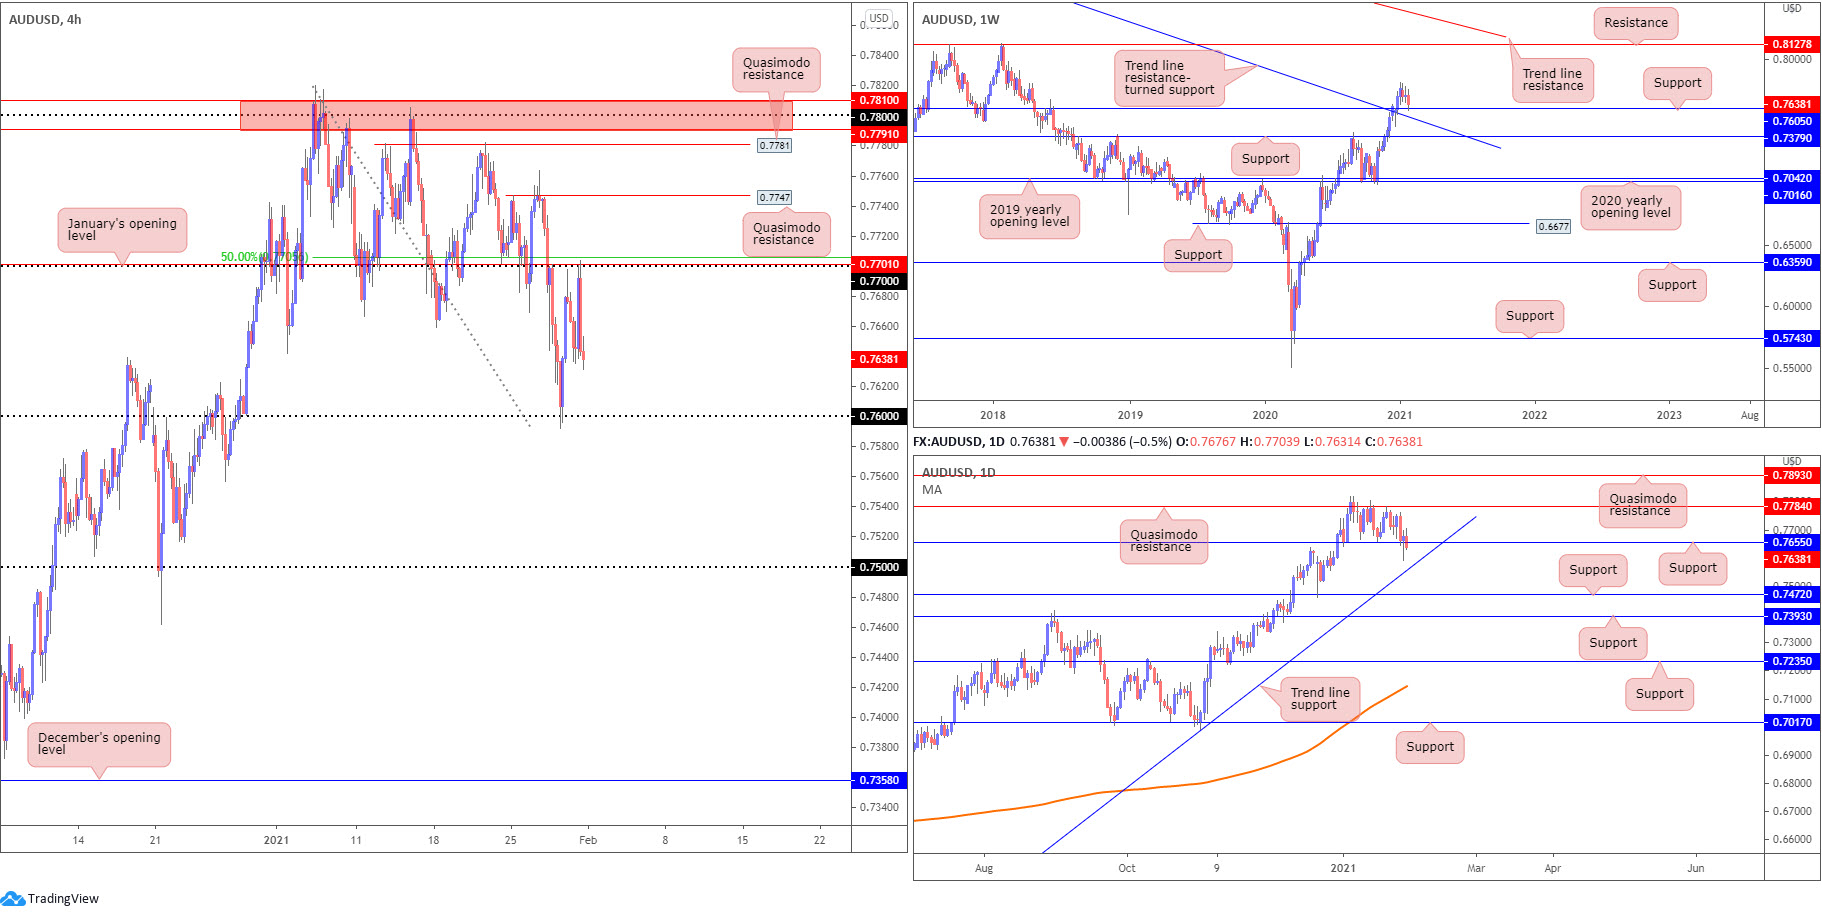
Following the break of Quasimodo resistance at 0.7605, and trend line resistance, taken from the high 1.1080, volatility diminished. That, of course, was until last week. Price reconnected with 0.7605 and, as you can see, dip-buyers made an appearance.
The 0.7605 level welcoming the retest, in a market trending higher, may tempt additional buying this week.
Daily perspective:
The outlook on the daily timeframe offers a somewhat less optimistic vibe.
Support at 0.7655 was retested in the second half of the week, in which buyers demonstrated some interest on Thursday. However, trade rolled out a sour tone Friday and has possibly swung the pendulum in favour of a move lower to test trend line support, extended from the low 0.5506.
H4 perspective:
Friday’s risk-averse market weighed on the Australian dollar Friday, aided by the H4 technical pullback that crossed swords with the 0.77 figure (reinforced by January’s opening value at 0.7701 and nearby 50.0% retracement ratio at 0.7704). Additional resistances to note are two Quasimodo formations at 0.7747 and 0.7781, as well as resistance between 0.7810 and 0.7791 (red).
With H4 poised to retest the 0.76 figure, a fakeout through the level is possibly on the cards since daily trend line support is seen just beneath the barrier. Not only would this move daily buyers into action, it could trip stops that may help fuel a recovery.
Areas of consideration:
- Trend: Decisively higher since 2020.
- 76 remains a technical point of interest on the H4. Although merging with weekly support at 0.7605, a fakeout into daily trend line support is a possible scenario. Should daily buyers defend the trend line, this could draw in buyers.
- (H4) 0.77 remains a level to be mindful of, converging with January’s opening value from 0.7701 and a 50.0% retracement level at 0.7704. Other resistances to note, as highlighted above, are the two Quasimodo formations at 0.7747 and 0.7781, as well as resistance between 0.7810 and 0.7791 (red).
USD/JPY:
Weekly gain/loss: +0.94%
Weekly close: 104.67
Weekly perspective:
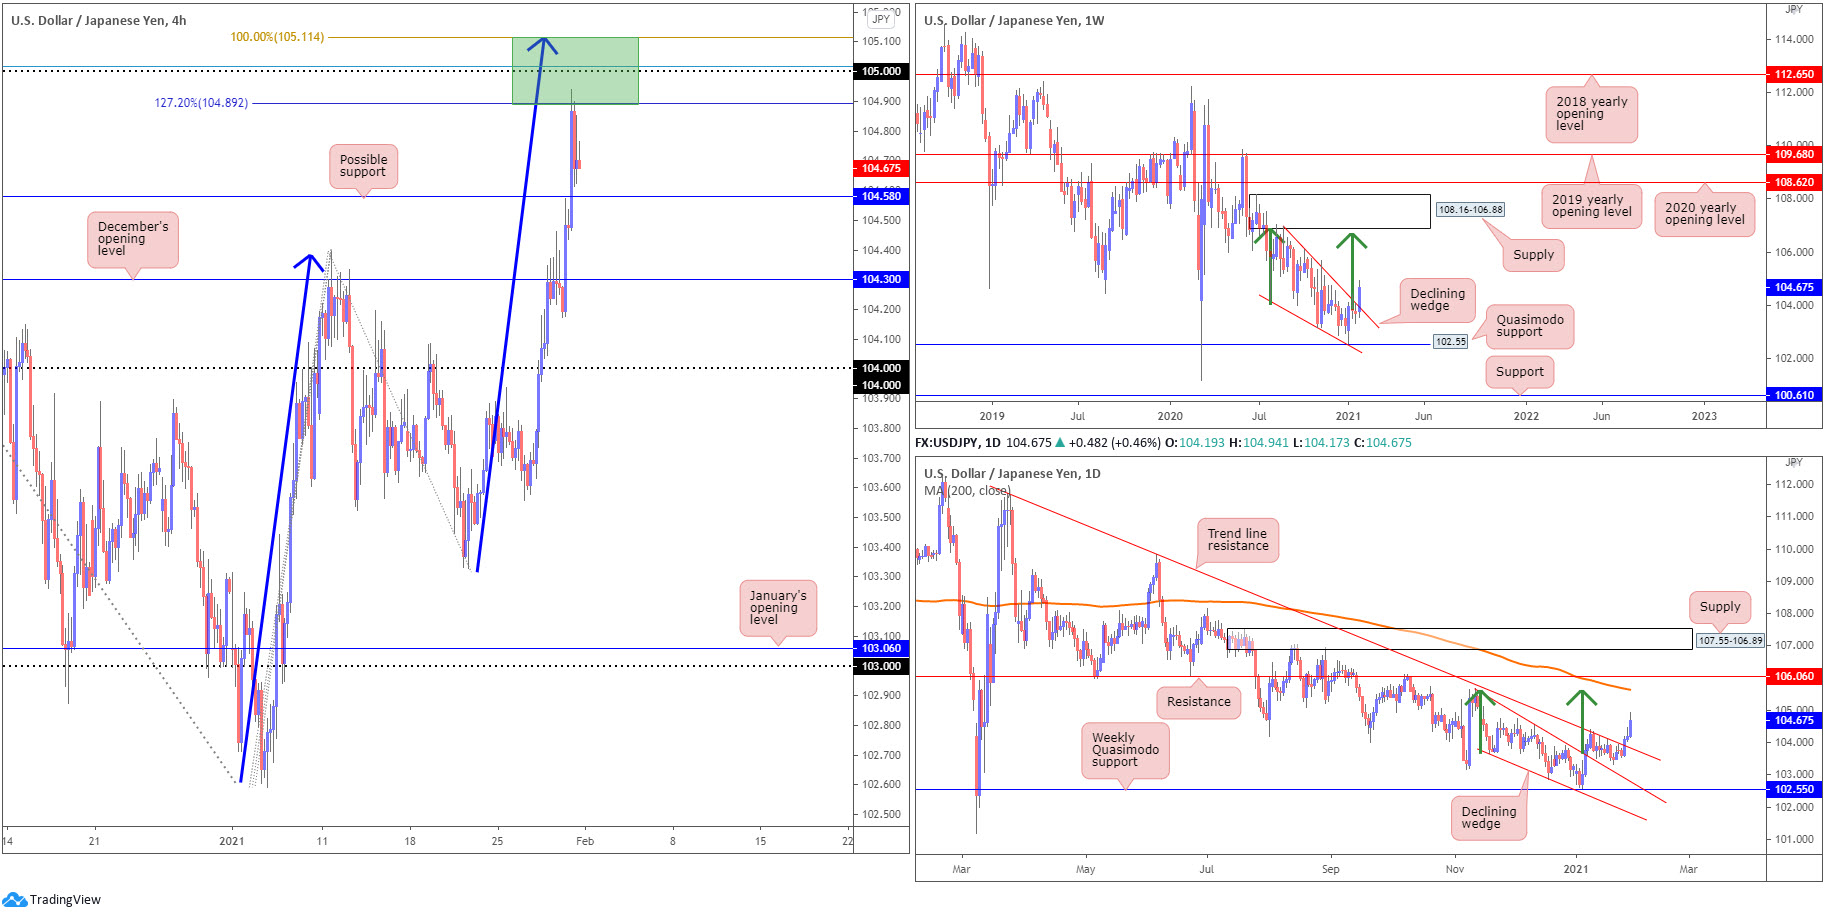
Since connecting with the underside of supply at 108.16-106.88 in August (2020), price has gradually shifted lower and developed a declining wedge (106.94/104.18).
Recent developments on the weekly scale, nonetheless, has witnessed price breakout above the aforementioned declining wedge. The velocity behind the breakout may be viewed as a reversal signal, zeroing in on the lower edge of supply (green arrows represent the take-profit objective).
Daily perspective:
The technical framework on the daily chart shows price not only also split the upper edge of a declining wedge (105.67/103.65) in early January, the unit also took on trend line resistance last week, taken from the high 111.71.
As for upside objectives on this scale, the declining wedge take-profit level is set around 105.59 (green arrows), with a break exposing the 200-day SMA (orange –105.64) and resistance priced in at 106.06
H4 perspective:
After taking out stops above 104.76 peaks Friday—a previous double-top pattern—USD/JPY shook hands with interesting resistance, composed of a 100% Fibonacci extension point at 105.11, a 78.6% Fibonacci retracement ratio at 105.01, the 105 figure and a 127.2% Fibonacci projection point at 104.89 (105.11-104.89).
The reaction from 105.11-104.89 throws 104.58 in the mix as possible support early week, together with December’s opening value at 104.30.
Traders are urged to remain cognisant of the bigger picture: both the weekly and daily timeframes suggest a break of the 105 figure to at least 105.59.
Areas of consideration:
- Trend: Lower since 2017. Though according to higher timeframe pattern structure, buyers are in the driving seat.
- With higher timeframes pointing higher, H4 traders may hone in on 104.58 and 104.30 as possible dip-buying sites this week.
- A H4 close above 105 is likely to be welcomed as a breakout signal, targeting pattern resistance at 105.59 on the daily timeframe.
USD/CAD:
Weekly gain/loss: +0.34%
Weekly close: 1.2774
Weekly perspective:
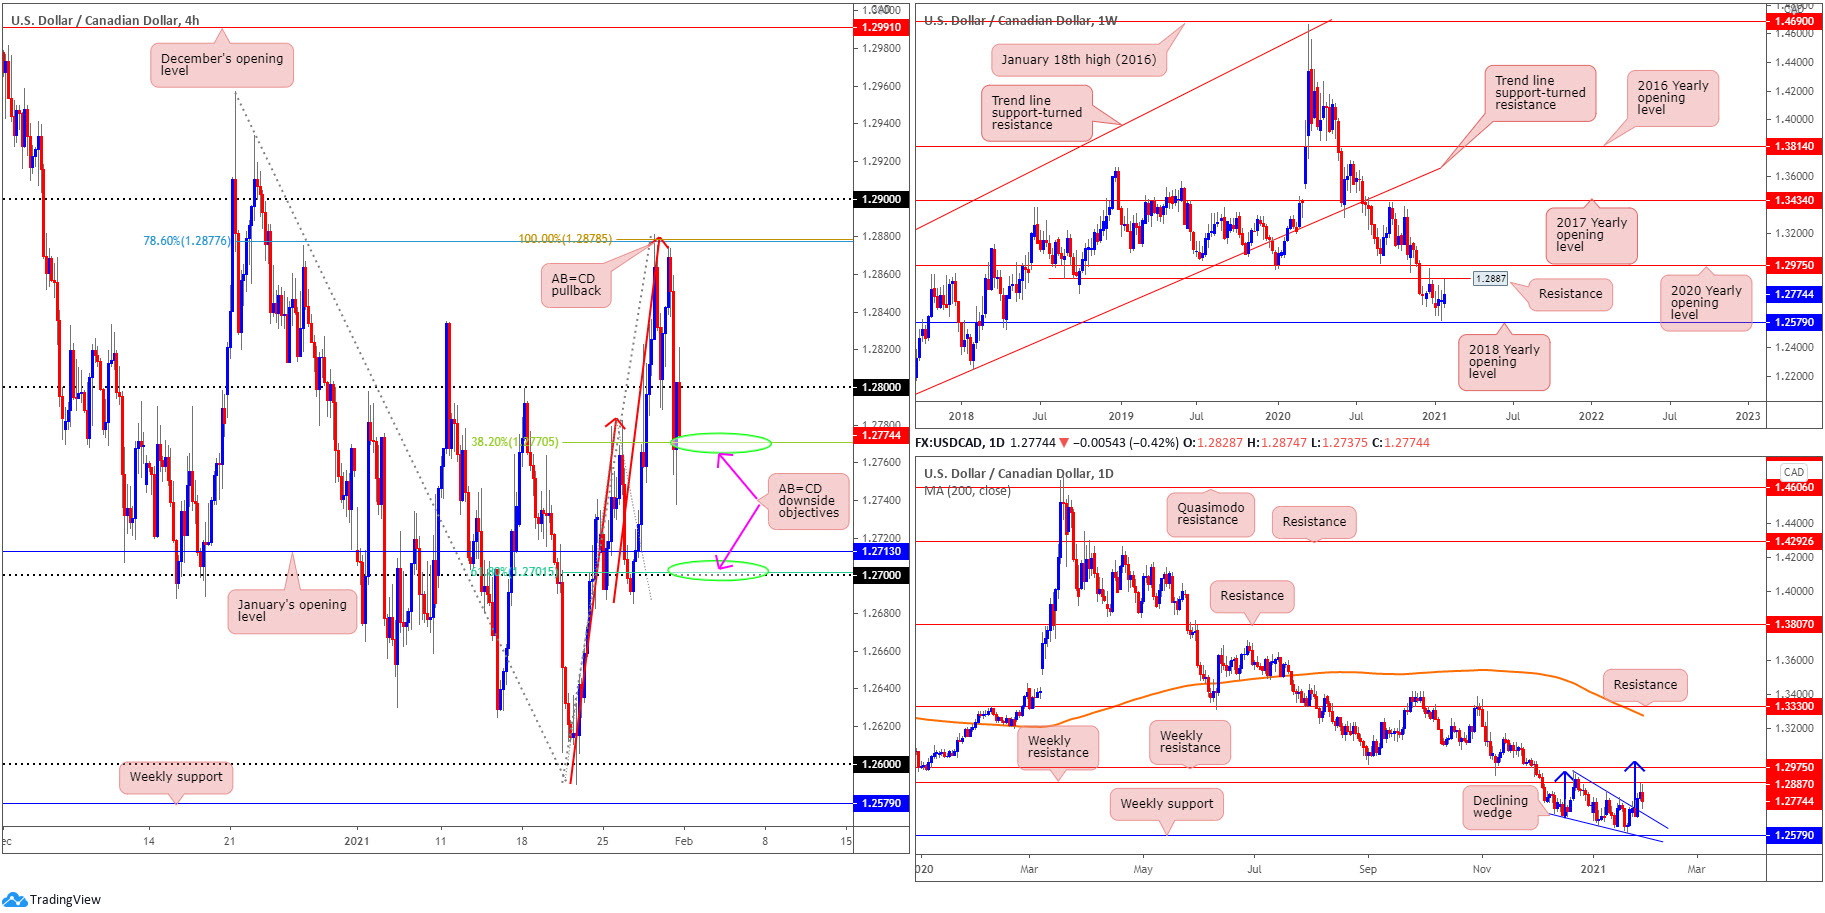
Following three back-to-back long-legged doji candles, price came within shouting distance of retesting resistance at 1.2887 last week, a previous Quasimodo support level.
As you can see, a reasonably robust end-of-week correction materialised, implying sellers could be gearing up for a test of the 2018 yearly opening value at 1.2579.
It is important to note long-term flow (trend) has been pointing lower since topping in March (2020).
Daily perspective:
Mid-week movement saw USD/CAD breakout above a declining wedge (1.2957/1.2688) and subsequently cross swords with space just south of the weekly resistance level mentioned above at 1.2887. Note that above here we have another layer of weekly resistance nearby at 1.2975 (the 2020 yearly opening value), followed by the daily timeframe’s declining wedge take-profit objective at 1.3009 (blue arrows).
H4 perspective:
For those who read Friday’s technical briefing you may recall the following (italics):
After touching gloves with multi-week tops, USD/CAD pared earlier gains on Thursday. Technically aided by a H4 AB=CD pullback at 1.2878, along with a 78.6% Fibonacci retracement ratio at 1.2877, the pair has since slipped beneath the 1.28 figure. Harmonic traders are also likely to acknowledge the 38.2% and 61.8% Fibonacci retracement ratios at 1.2770 and 1.2701, respectively—AB=CD downside objectives.
As evident from the H4 chart, Friday vigorously connected with the 38.2% Fibonacci retracement ratio at 1.2770, and spiked to lows at 1.2737.
With H4 finding some grip off the underside of 1.28, harmonic traders likely still have the 61.8% Fibonacci retracement ratio on their watchlists this week at 1.2701 (surrounded by the 1.27 figure and January’s opening value at 1.2713).
Areas of consideration:
- Trend: Lower since topping in March at 1.4667.
- With 1.28 offering resistance, follow-through selling to the 61.8% H4 Fibonacci retracement ratio at 1.2701 could be targeted.
- The breakout above the daily declining wedge, nevertheless, may eventually stir buyers enough to elevate things through weekly resistance at 1.2887 to another weekly resistance at 1.2975 (merges closely with the daily timeframe’s declining wedge pattern target).
USD/CHF:
Weekly gain/loss: +0.55%
Weekly close: 0.8898
Weekly perspective:
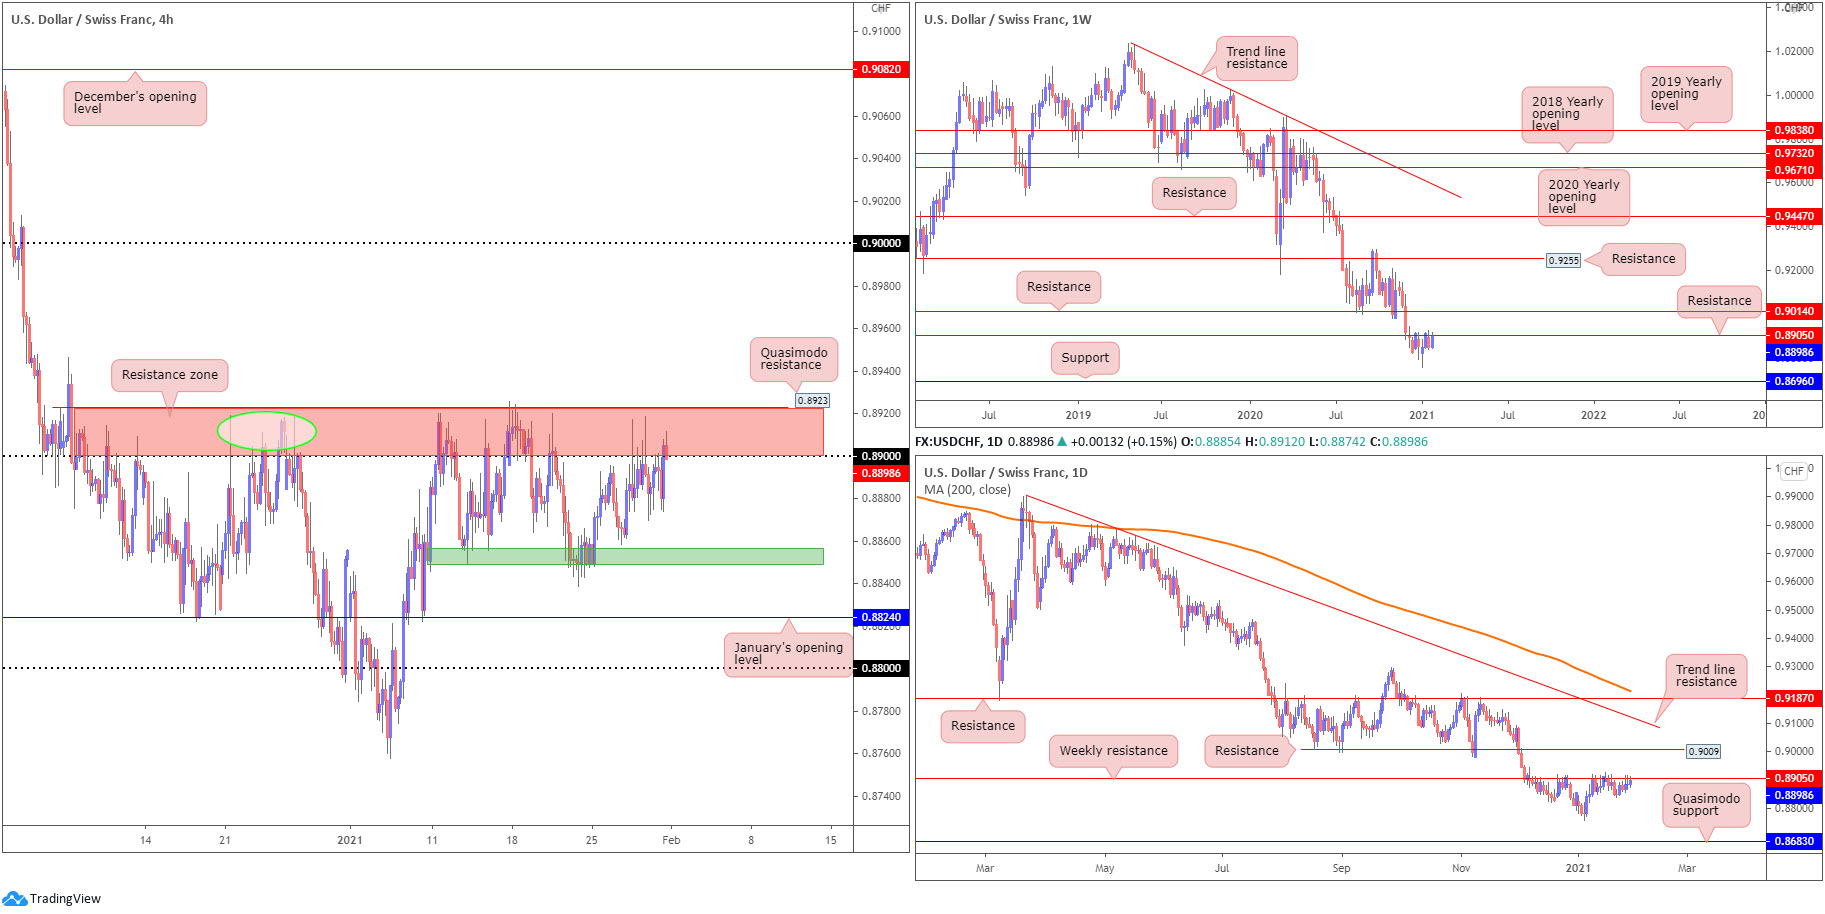
The weekly timeframe shows not only has USD/CHF been entrenched within a downtrend since May 2019, the pair also remains loitering at the underside of resistance drawn from 0.8905.
Because of this, sellers could maintain control in the coming weeks.
Support on the is not expected to make an appearance until 0.8696.
Daily perspective:
Similar to the weekly scale, the daily timeframe reveals weekly resistance at 0.8905 as a prominent base.
However, Quasimodo support at 0.8683 serves as the next downside target on the daily timeframe, situated a touch beneath weekly support at 0.8696.
H4 perspective:
The US dollar eked out a modest gain against the Swiss franc on Friday, challenging the grip of resistance at 0.8923-0.89 (Quasimodo resistance and psychological resistance). Although this area has remained a base of interest since the beginning of December, sellers appear to be losing traction. The initial reaction (green circle—December 24) saw lows of 0.8757, while mid-January’s reaction failed to overthrow 0.8850 (green). Adding to this, the second half of last week retested the said resistance and was unable to push through 0.8880.
Above 0.8923-0.89, we can see a reasonably clear path back to the key figure 0.90, which happens to align with daily resistance at 0.9009.
Areas of consideration:
- Trend: lower since May 2019.
- A H4 close above 0.8923 this week is likely to spark breakout buying interest, targeting the 0.90 region. Conservative buyers may seek a retest at 0.8923 before committing.
- Should sellers defend 0.8923-0.89, bearish scenarios may form should H4 close south of 0.8850. Although short-term downside targets rest between 0.8824 (January’s opening value) and the 0.88 figure, longer-term targets to be aware of are the multi-month troughs around 0.8757 (formed early January), with further selling to possibly take aim at weekly support drawn from 0.8696 and daily Quasimodo support at 0.8683.
Dow Jones Industrial Average:
Weekly gain/loss: -3.41%
Weekly close: 29,948
Weekly perspective:
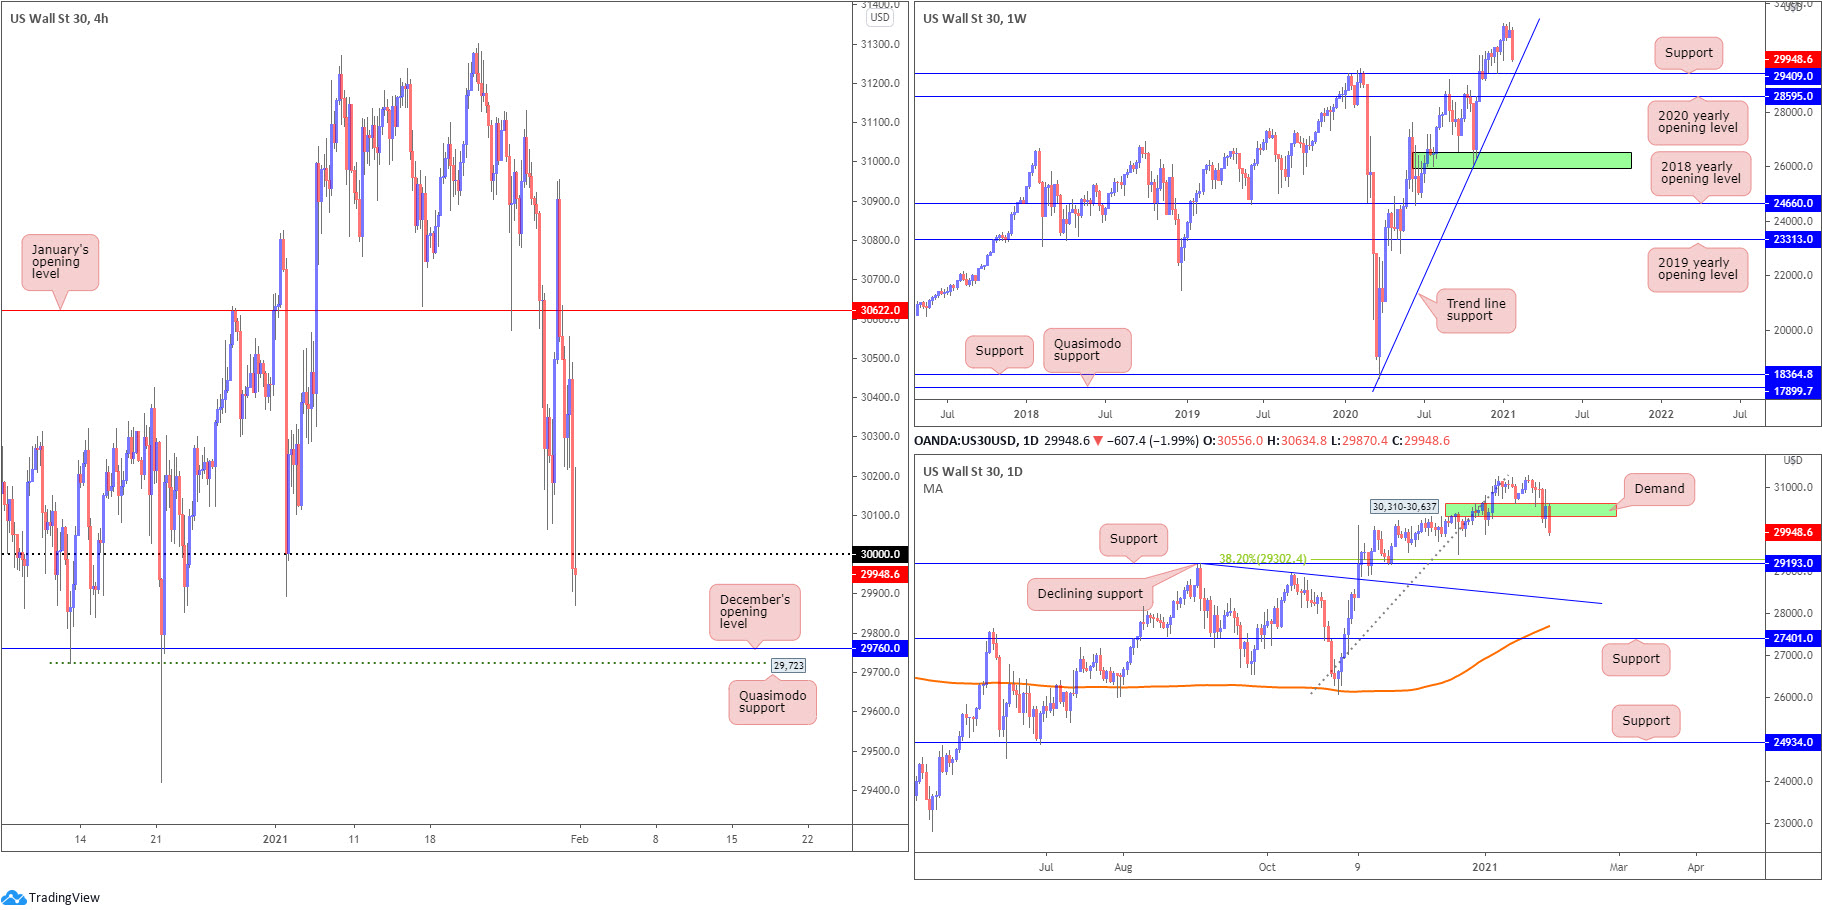
South of all-time highs at 31,301, DJIA shed more than 1,000 points last week and moulded a near-full-bodied bearish candle.
As noted in previous analysis, trend line support, extended from the low 18,213, could make a show this week, with possible follow-through selling drawing in another nearby support at 29,409, a previous Quasimodo resistance.
Daily perspective:
Despite trending higher since 2020, demand at 30,310-30,637 collapsed heading into the second half of last week’s trading. Friday’s dominant sell-off shines the technical spotlight on support at 29,193 this week (merging closely with a 38.2% Fibonacci retracement ratio at 29,302).
H4 perspective:
Major US equity benchmarks followed European bourses lower on Friday. The Dow Jones Industrial Average fell 620.74 points, or 2.03%; the S&P 500 dropped 73.14 points, or 1.93% and the Nasdaq fell 266.46 points, or 2.00%.
On the technical front, 30,000 came under pressure on Friday, following steep losses in the final hours of the week. This, consequently, threatens to reconnect with December’s opening value at 29,760, closely shadowed by Quasimodo support coming in at 29,723.
Areas of consideration:
- Trend: bull market—decisively higher since 2020.
- According to the higher timeframes, extending the recent retracement slide could be in the offing this week until weekly trend line support enters the fight. This suggests sellers are to likely try and overwhelm any buying off December’s opening value drawn from 29,760 on the H4.
- On the back of the above analysis, intraday sellers could try and hold position beneath 30,000 (H4) this week, ultimately targeting weekly trend line support.
XAU/USD (GOLD):
Weekly gain/loss: -0.43%
Weekly close: $1,847
Weekly perspective:
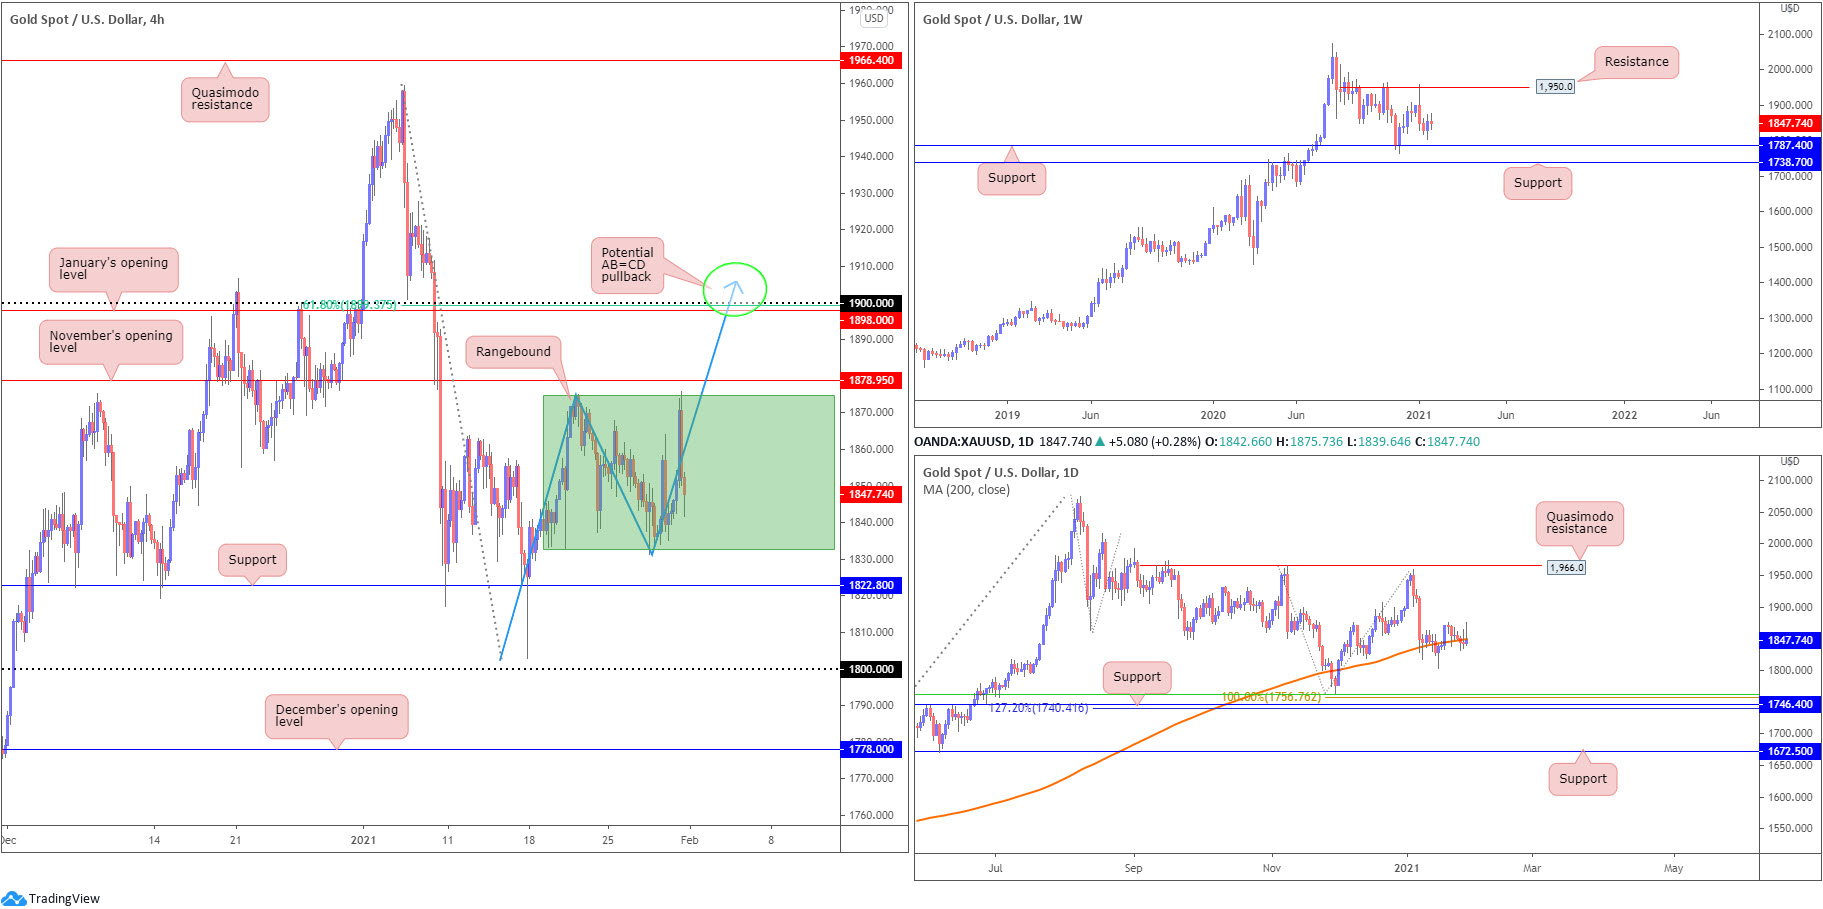
The prior week’s bullish outside reversal candle failed to provide impetus, with last week’s session, albeit scratching out fresh highs, ending off best levels.
This hints at support at $1,787—set north of another support at $1,738—is perhaps to call for attention this week.
It is also important to note that in terms of trend we’ve been actively trending higher since early 2016.
Daily perspective:
Mid-week action witnessed the yellow metal slip beneath the 200-day SMA (orange – $1,849).
Any sustained selling south of this dynamic value is likely to be interpreted as a bearish cue. Below the noted SMA, support is arranged around $1,746, sited south of a 100% Fibonacci extension point at $1,756, a 50.0% retracement ratio at $1,762 and above a 127.2% Fibonacci extension point at $1,740.
H4 perspective:
Last week formed a range between $1,832 and $1,874.
Outside of this area, $1,822 is seen as immediate support, with a break exposing $1,800. To the upside, November’s opening value at $1,878 represents possible resistance, followed by January’s opening value at $1,898, a 61.8% Fibonacci ratio at $1,899, the $1,900 figure and a potential AB=CD pullback (blue arrows) at $1,906.
Areas of consideration:
- Trend: higher since early 2016.
- H4 shows a ranging environment between $1,832 and $1,874, which may attract lower timeframe traders at range extreme’s this week.
- The 200-day SMA breach has likely caught the eye of sellers, particularly with room seen on the weekly timeframe to approach support at $1,787.
- H4 support at $1,822 is in view, with November’s opening value at $1,878 seen to the upside.
- H4 AB=CD pullback around $1,900 may interest sellers should November’s opening value at $1,878 step aside.
The accuracy, completeness and timeliness of the information contained on this site cannot be guaranteed. IC Markets does not warranty, guarantee or make any representations, or assume any liability regarding financial results based on the use of the information in the site.
News, views, opinions, recommendations and other information obtained from sources outside of www.icmarkets.com.au, used in this site are believed to be reliable, but we cannot guarantee their accuracy or completeness. All such information is subject to change at any time without notice. IC Markets assumes no responsibility for the content of any linked site.
The fact that such links may exist does not indicate approval or endorsement of any material contained on any linked site. IC Markets is not liable for any harm caused by the transmission, through accessing the services or information on this site, of a computer virus, or other computer code or programming device that might be used to access, delete, damage, disable, disrupt or otherwise impede in any manner, the operation of the site or of any user’s software, hardware, data or property.


