
A note on lower timeframe confirming price action…
Waiting for lower timeframe confirmation is our main tool to confirm strength within higher timeframe zones, and has really been the key to our trading success. It takes a little time to understand the subtle nuances, however, as each trade is never the same, but once you master the rhythm so to speak, you will be saved from countless unnecessary losing trades. The following is a list of what we look for:
- A break/retest of supply or demand dependent on which way you’re trading.
- A trendline break/retest.
- Buying/selling tails/wicks – essentially we look for a cluster of very obvious spikes off of lower timeframe support and resistance levels within the higher timeframe zone.
- Candlestick patterns. We tend to only stick with pin bars and engulfing bars as these have proven to be the most effective.
We search for lower timeframe confirmation between the M15 the H1 timeframes, since most of our higher-timeframe areas begin with the H4. Stops are usually placed 5-10 pips beyond confirming structures.
EUR/USD:
Weekly gain/loss: + 212 pips
Weekly closing price: 1.1167
Weekly opening price: 1.1169
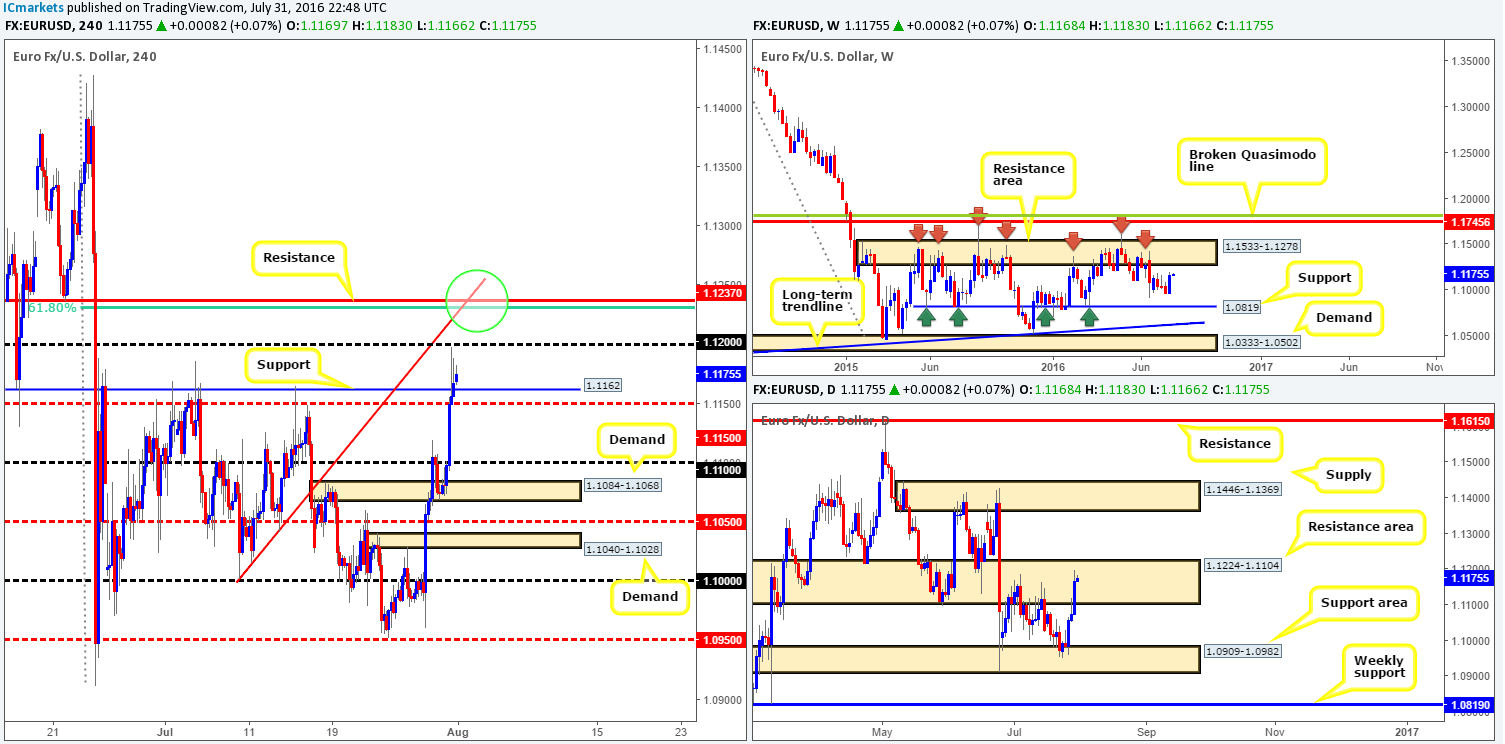
Weekly view: From this viewpoint, the EUR/USD appears to be heading back up to retest the weekly resistance area chalked in at 1.1533-1.1278. This zone has certainly stood the test of time, capping upside since May 2015. Therefore, do keep a close eye on this barrier as it will likely play a significant role in this market over the next few weeks!
Daily view: Thanks to a healthy bounce from the daily support area at 1.0909-1.0982, the pair is now seen trading at the top end of a daily resistance zone penciled in at 1.1224-1.1104. Should the bulls continue to dominate this week, the 1.1446-1.1369 area (a daily supply) will likely be the next objective to reach.
H4 view: A lower than expected US GDP print boosted EUR appeal mid-way through the London session on Friday, eventually forcing price to close the week slightly above H4 resistance at 1.1162 (now acting support).
Direction for the week: A whipsaw through the aforementioned daily resistance area at 1.1224-1.1104 will likely take place in order for price to shake hands with the weekly resistance zone mentioned above at 1.1533-1.1278. To our way of seeing things, however, this should eventually send the EUR lower.
Direction for today: Although the higher-timeframe picture indicates that we may see a push up to the 1.1278 region this week, there’s a particularly attractive H4 resistance level at 1.1237 which has caught our eye. Strengthened by a H4 61.8% Fib at 1.1231 along with a H4 trendline swap taken from the low 1.1069 (green circle), a bounce is likely from this region today should price cut through offers at the 1.12 handle.
Our suggestions: Watch for a sell (preferably with lower timeframe confirmation) trade around the above said H4 resistance level today. As we’ve already mentioned, do keep in mind that we’re only expecting a bounce from here due to what’s been noted on the higher-timeframe picture (see above). As for targets, we’d be looking to cover some of the position around 1.12, and if price extends further south, the H4 support at 1.1162 would be the next barrier on the hit list.
Levels to watch/live orders:
- Buys: Flat (Stop loss: N/A).
- Sells: 1.1237 region [Tentative – confirmation required] (Stop loss: dependent on where one confirms this area).
GBP/USD:
Weekly gain/loss: + 114 pips
Weekly closing price: 1.3222
Weekly opening price: 1.3238
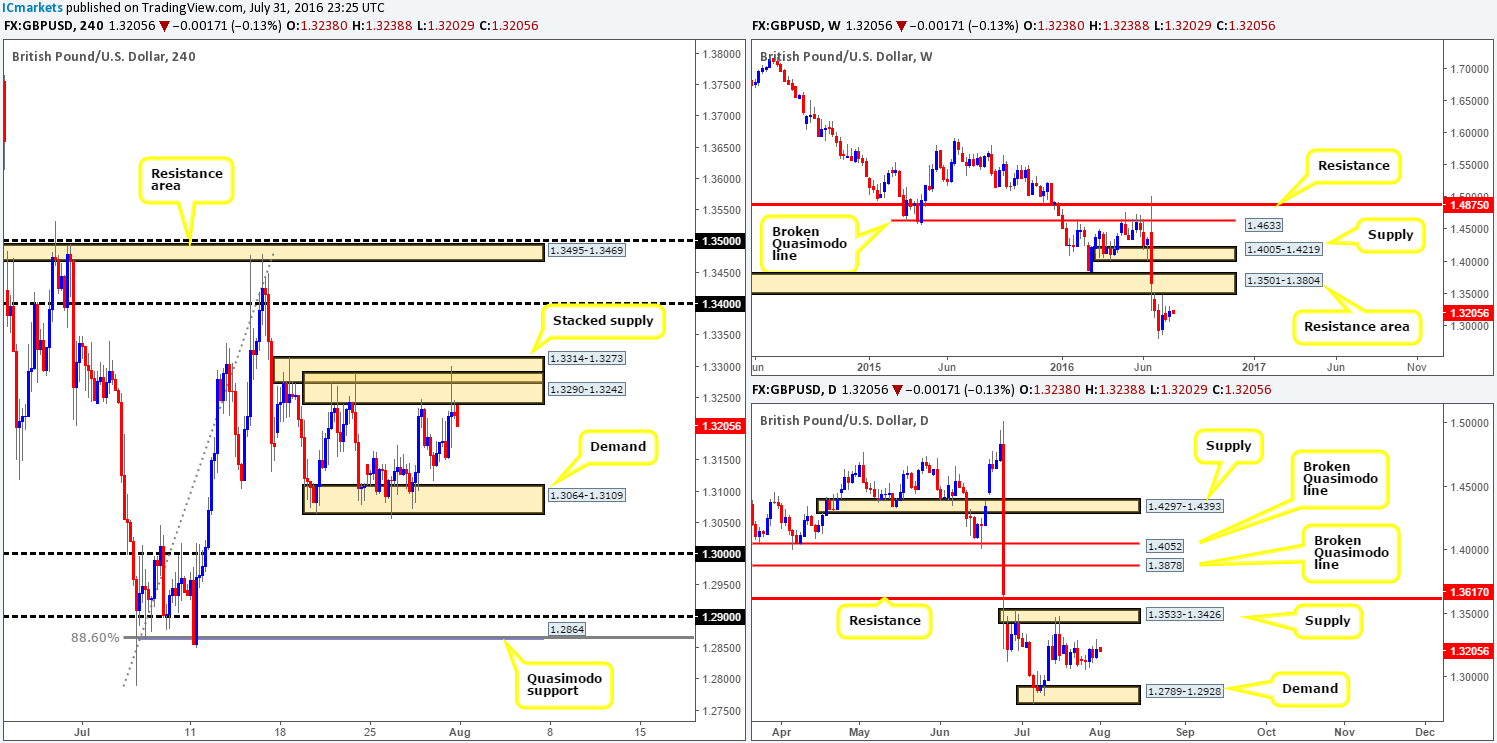
Weekly view: In a similar fashion to the previous week’s action, cable ranged around 250 pips last week. Directly overhead, we can see that there’s a weekly resistance area at 1.3501-1.3804, while to the downside we see little support to the left of current price until the market reaches the 1.20 region (we had revisit 1986 to find this).
Daily view: Looking down to the daily chart, the candles are currently seen loitering mid-range between a daily supply zone at 1.3533-1.3426 and a daily demand barrier at 1.2789-1.2928. With the trend predominantly pointing south and considering the fact that the daily supply is glued to the underside of the aforementioned weekly resistance area, this will be a difficult barrier for the bulls to breach in our opinion.
H4 view: A quick recap of Friday’s trade on the H4 shows that the pair advanced mid-way through the London session, bolstered by weaker than expected US GDP data. This, as can be seen from the chart, forced price to stab into a H4 stacked supply formation composed of 1.3290-1.3242/ 1.3314-1.3273, before retreating and giving back around eighty pips into close.
Direction for the week: We believe price could possibly touch gloves with the daily supply zone at 1.3533-1.3426 sometime during the week. From here, a rotation to the downside is expected.
Direction for today: A sell off from the underside of the H4 stacked supply formation (see above) is likely to take place, targeting the H4 demand base at 1.3064-1.3109.
Our suggestions: Watch for short trades from the current H4 stacked supply area today. We would recommend waiting for lower timeframe confirmation (see the top of this report), but as long as one has their stops above the stacked zones, price is likely to reach the above said H4 demand area.
Levels to watch/live orders:
- Buys: Flat (Stop loss: N/A).
- Sells: 1.3290-1.3242/ 1.3314-1.3273 stacked H4 supply (Stop loss: 1.3320).
AUD/USD:
Weekly gain/loss: + 141 pips
Weekly closing price: 0.7595
Weekly opening price: 0.7589
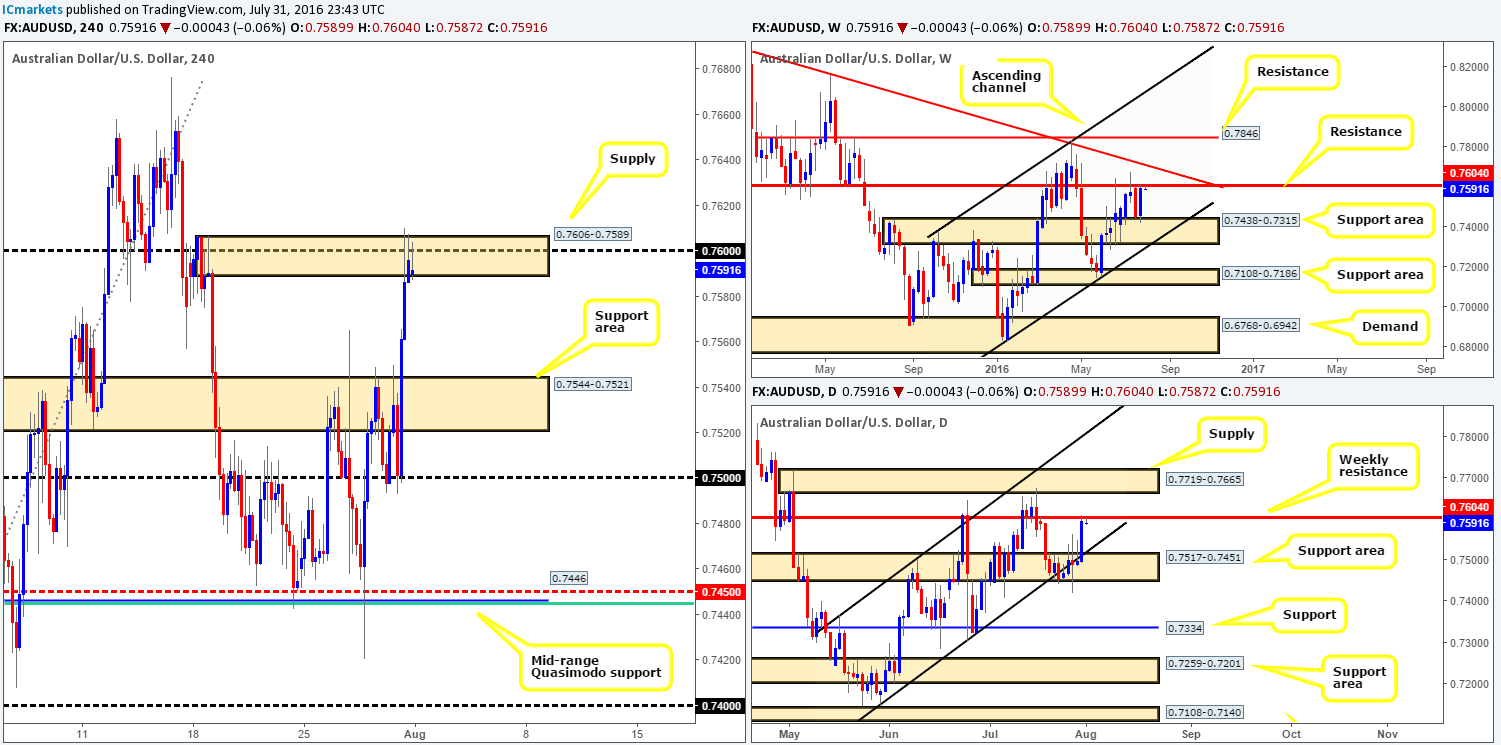
Weekly view: The past week saw the commodity-linked currency bounce from the top edge of a weekly support area at 0.7438-0.7315 back up to a weekly resistance line at 0.7604. Given this level’s history, our team favors a bounce to the downside this week.
Daily view: Thanks to a strong bout of buying seen from a daily support area coming in at 0.7517-0.7451 (merges beautifully with a daily channel support line taken from the low 0.7148 and is positioned on top of the above said weekly support area), price was able to cross swords with the aforementioned weekly resistance line.
H4 view: Looking at Friday’s action on the H4 chart, the Aussie aggressively launched itself north following a weak US GDP print, consequently forcing price to collide with a H4 supply area at 0.7606-0.7589, which for the time being is holding firm. Given that this area merges with both a psychological level at 0.76 and the aforementioned weekly resistance line, it’s no surprise to see this barrier currently suppressing the buyers.
Direction for the week: is likely to be south. According to our analysis, the next downside target on the higher timeframes is the aforementioned daily channel support line.
Direction for today: is also likely to be south, since there’s very little support in the market between the current H4 supply zone and the next area of H4 support coming in at 0.7544-0.7521 (located just above the aforementioned daily support area).
Our suggestions: In view of all three timeframes, our team has entered short at 0.7589, with a stop placed above the current H4 supply at 0.7611. There’s only one target we’re interested in today and that’s the above said H4 support area!
Levels to watch/live orders:
- Buys: Flat (Stop loss: N/A).
- Sells: 0.7589 [LIVE] (Stop loss: 0.7611).
USD/JPY:
Weekly gain/loss: – 400 pips
Weekly closing price: 102.01
Weekly opening price: 102.28
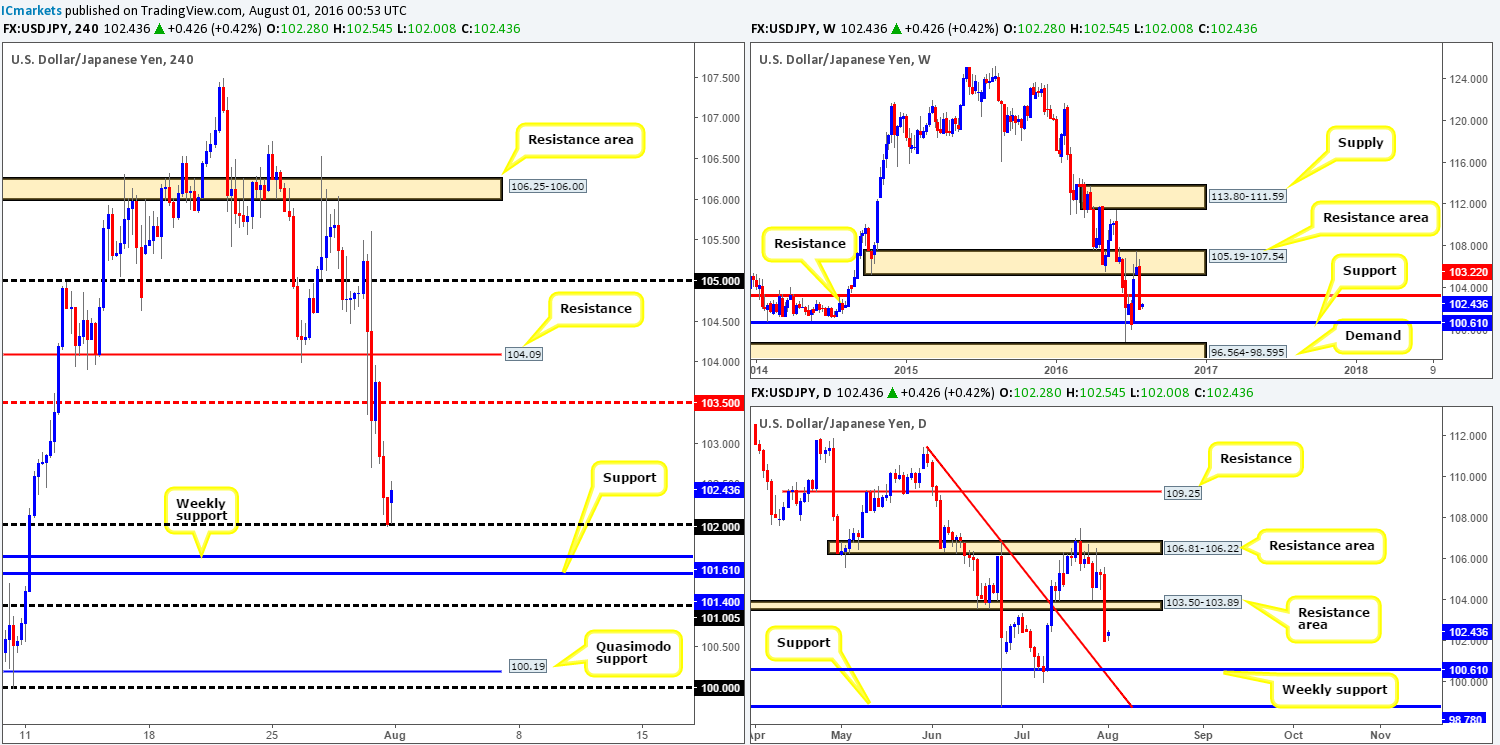
Weekly view: Following the weekly bearish selling wick that formed within the confines of a weekly resistance area at 105.19-107.54, the USD/JPY aggressively sold off last week! The weekly support level at 103.22 was taken out (now acting resistance) and has potentially opened the doors for price to challenge the weekly support line seen at 100.61 this week.
Daily view: In conjunction with weekly action, daily price also shows room for price to connect with the weekly support level at 100.61. In addition to this, however, we can also see that there’s a daily trendlline extended from the high 111.35 that fuses beautifully with the weekly support level, thus increasing the chances of a reversal from here.
H4 view: A brief look at recent trading on the H4 chart shows that price sold off over 300 pips on Friday. Helped by a lower than expected US GDP reading, the pair managed to touch base with the 102 handle, leaving both the aforementioned weekly support and a H4 support at 101.40 unchallenged.
Direction for the week: is likely to be south until price reaches the weekly support level. Considering this level’s history, we expect to see a relatively nice turnaround here.
Direction for today: Although the pair gapped over twenty pips north this morning, we feel this may simply be traders covering their short positions from Friday’s move. Therefore, 102 is on relatively shaky ground we believe and would not recommend taking longs from here. In light of this, we feel a move to the downside will likely be seen today as we move into the more liquid sessions.
Our suggestions: Buy from the 101.40/101.61 area (H4 support/weekly support). Despite the confluence surrounding this zone, waiting for lower timeframe confirmation (see the top of this report) to form before risking capital is still advised. This is simply because price could fake through our buy zone to hook up with the 101 handle!
Levels to watch/live orders:
- Buys: 101.40/101.61 region [Tentative – confirmation required] (Stop loss: dependent on where one confirms this area).
- Sells: Flat (Stop loss: N/A).
USD/CAD:
Weekly gain/loss: – 82 pips
Weekly closing price: 1.3040
Weekly opening price: 1.3029
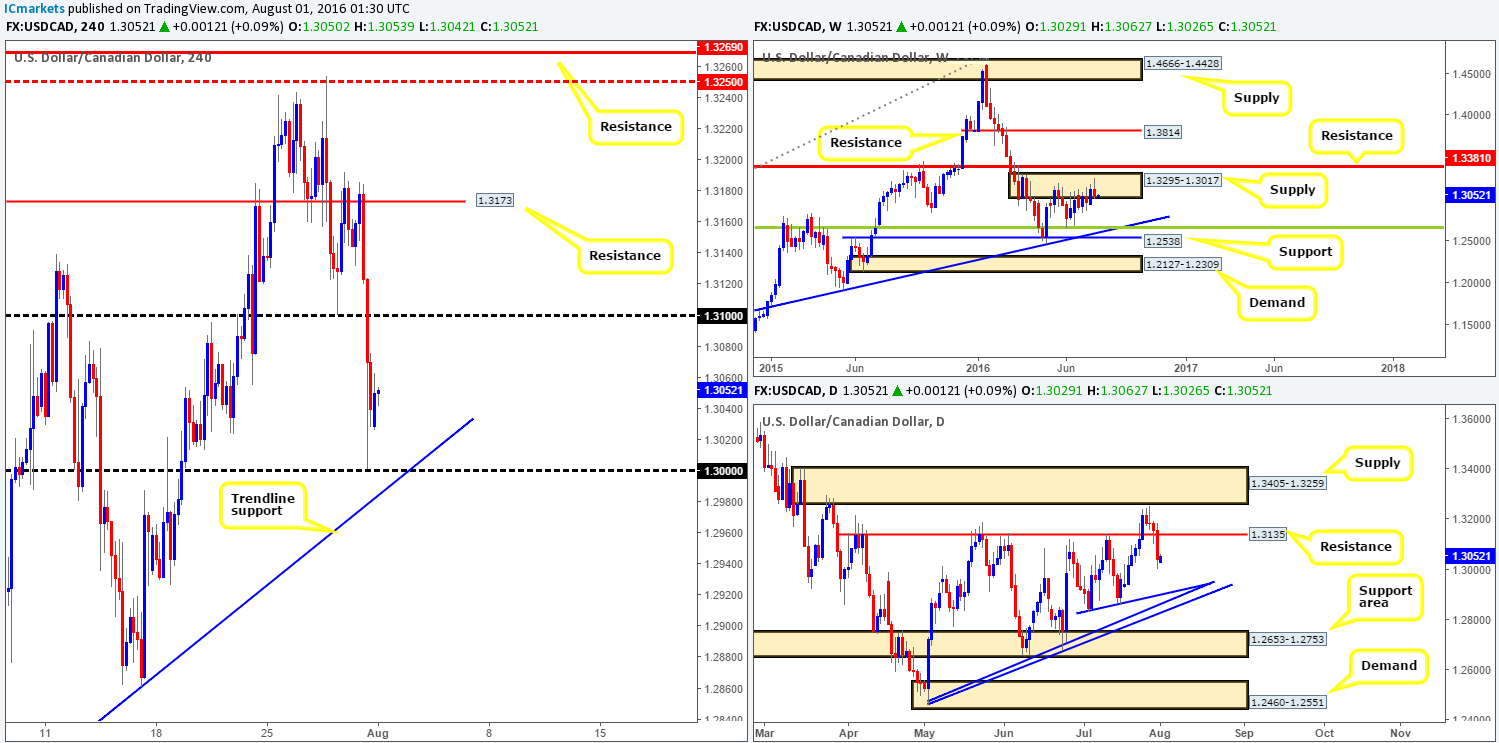
Weekly view: Last week’s action saw the USD/CAD sell off from within the upper edge of a weekly supply zone coming in at 1.3295-1.3017. Providing that the sellers remain in a dominant position here, the next downside target can be seen at a weekly trendline support extended from the high 1.1278, which coincides with a weekly 38.2% Fib support at 1.2661 (taken from the low 0.9406).
Daily view: Besides weekly offers holding firm within supply, we can also see that Friday’s daily candle closed below a daily support line seen at 1.3135 (now acting resistance). Technically speaking, this move appears to have cleared the rubble for a continuation move south this week down to a cluster area of daily trendline supports taken from the following lows: 1.2460 and 1.2839.
H4 view: Reviewing Friday’s movement on the H4 chart, it can be seen that the pair aggressively drove lower from a H4 resistance level drawn in at 1.3173. As a result of this, the 1.31 handle was taken out, with price ending the week rebounding from just above the key figure 1.30.
Direction for the week: according to the higher timeframes (see above), is likely to be south. Therefore, for those who are considering entering long from 1.30 today may want to take note of the bigger picture.
Direction for today: Although price has bounced nicely from the 1.30 region, we feel that this hurdle is fragile. With that in mind, this number will, alongside the H4 trendline taken from the low 1.2677, likely be taken out either today or tomorrow to continue south.
Our suggestions: Watch for a close below 1.30 and preferably the H4 trendline support, and look to trade any (confirmed – see the top of this report) retest seen to the underside of these areas, targeting the aforementioned cluster of daily trendlines.
Levels to watch/live orders:
- Buys: Flat (Stop loss: N/A).
- Sells: Watch for price to close below the 1.30 handle and look to trade any retest seen thereafter (lower timeframe confirmation required).
USD/CHF:
Weekly gain/loss: – 174 pips
Weekly closing price: 0.9692
Weekly opening price: 0.9687
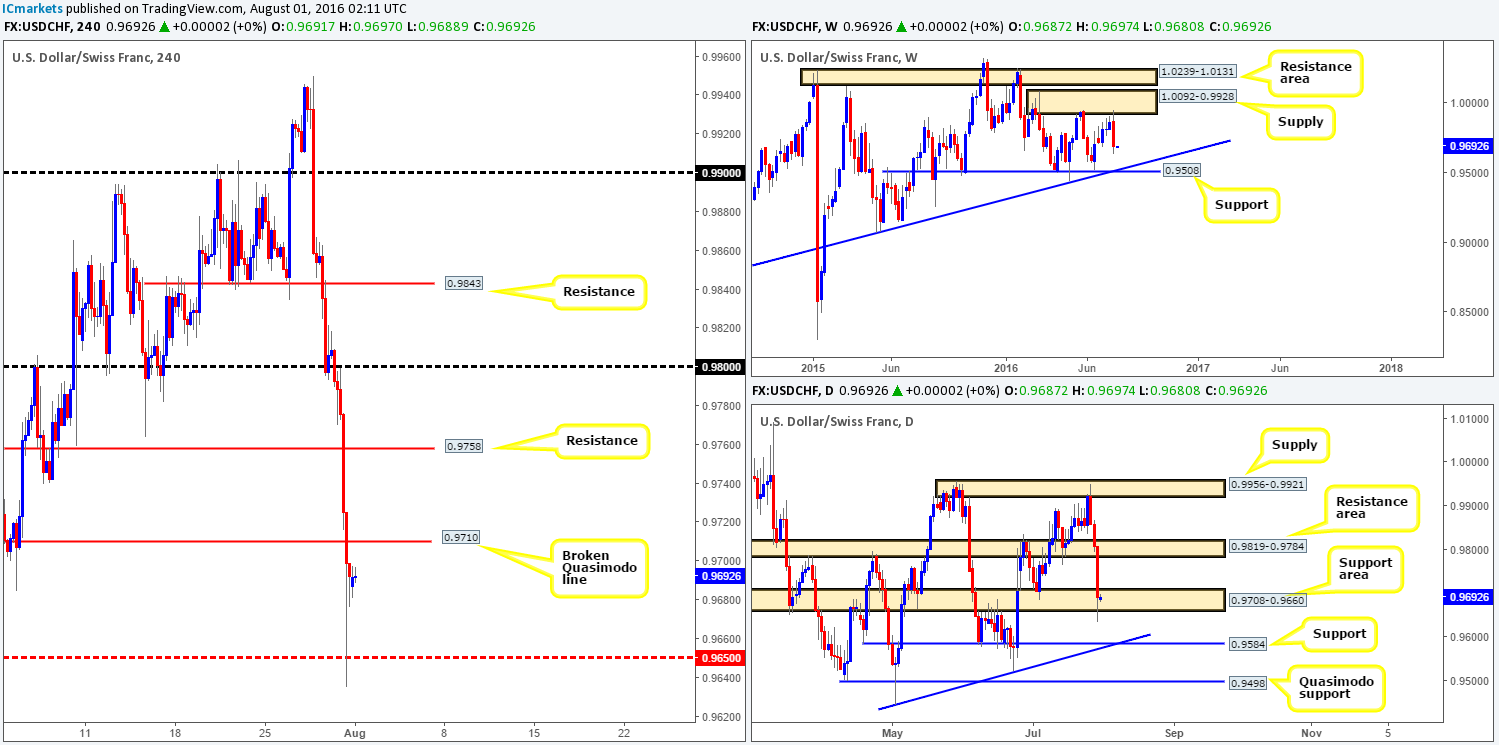
Weekly view: As can be seen from the weekly chart this morning, last week’s weekly candle turned beautifully from the underside of a weekly supply zone at 1.0092-0.9928, engulfing four prior weekly candles along the way! To our way of seeing things, there’s little support stopping the Swissy from connecting with the weekly trendline support extended from the low 0.8703 (intersects perfectly with a weekly support level at 0.9508) sometime this week.
Daily view: Despite weekly price looking as though it’s heading lower, down here on the daily chart price is seen bid from a daily support area given at 0.9708-0.9660. Furthermore, just beneath this region sits another support at 0.9584 that ties in nicely with a daily trendline support taken from the low 0.9443. The next upside target from current price sits at a daily resistance area drawn from 0.9819-0.9784.
H4 view: Backed by a lower than expected US GDP reading on Friday, the pair dropped almost 120 pips in a single day’s trading! This most recent descent saw price take out multiple H4 supports and slam dunk itself into a H4 mid-way support at 0.9650, which, as you can see, bounced price and helped recover some of the day’s losses.
Direction for the week: As far as higher-timeframe structure is concerned, it’s tricky. Ideally we want to see price engulf the current daily support area before we begin looking to short in-line with weekly expectations (see above). Therefore, as of this point in time, we do not have any concrete direction for the week unfortunately.
Direction for today: As of now, price is seen hovering just ahead of a H4 broken Quasimodo line at 0.9710, which could, given the position of price on the weekly chart, hold price lower today. However, it could just as easily go the other way and break above this H4 level, since daily buyers may choose to go toe-to-toe with weekly sellers!
Our suggestions: The aforementioned H4 broken Quasimodo level is key for us today. Should the level hold and produce a lower timeframe sell signal, we would recommend playing this one short due to weekly flow being on your side, targeting 0.9650 first and foremost. On the other hand, if the unit closes above and retests the H4 level, a long position could be considered if a lower timeframe buy signal is spotted, targeting H4 resistance at 0.9758, followed closely by the 0.98 handle which is located within the aforementioned daily resistance area.
For traders who struggle to pin down lower timeframe entries, please see the top of this report.
Levels to watch/live orders:
- Buys: Watch for price to close above the H4 broken Quasimodo line at 0.9710 and look to trade any retest seen thereafter (lower timeframe confirmation required).
- Sells: 0.9710 region [Tentative – confirmation required] (Stop loss: dependent on where one confirms this area).
DOW 30:
Weekly gain/loss: -102 points
Weekly closing price: 18449
Weekly opening price: 18471
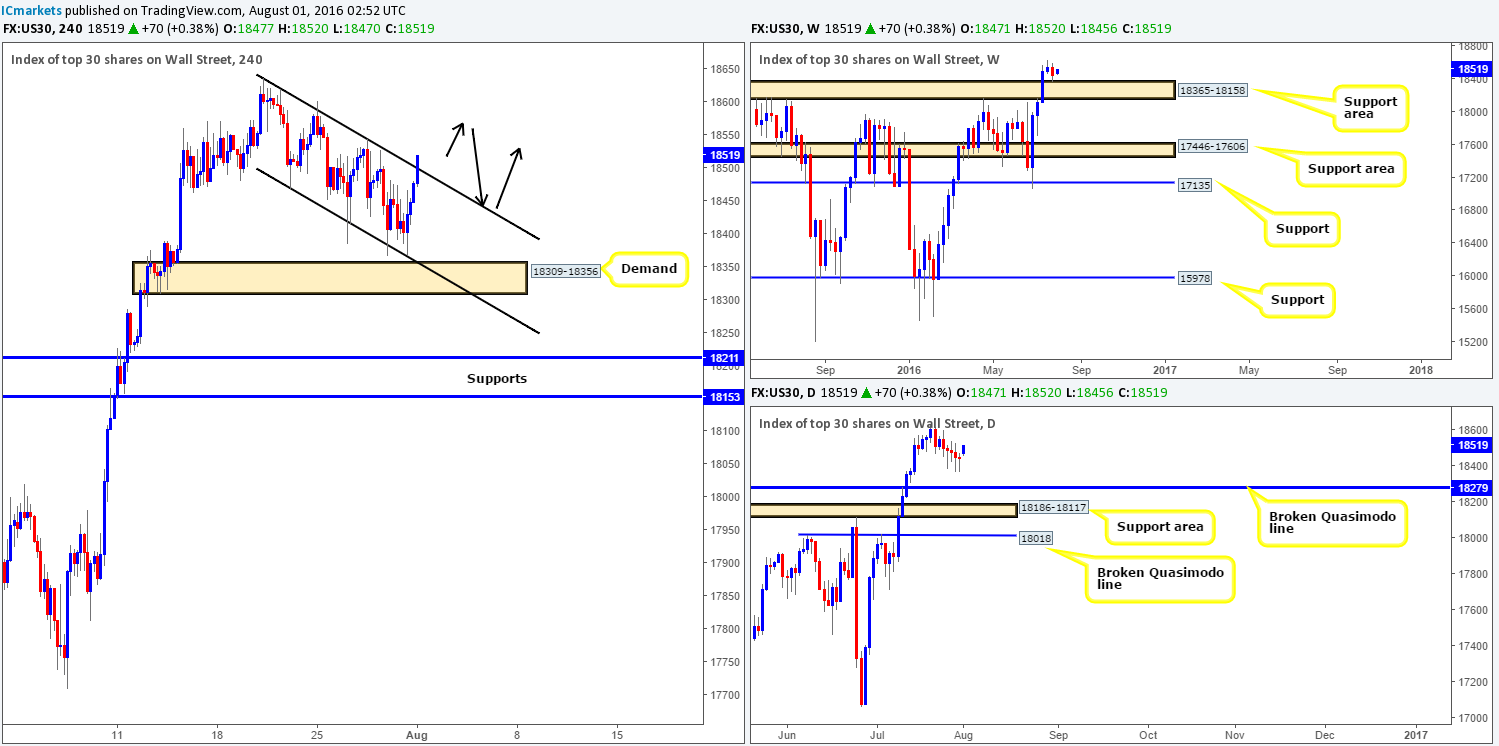
Weekly view: From the weekly chart, we can see that the DOW printed its first losing week since bouncing from the weekly support line at 17135 four weeks back! In spite of this, the bid-side of this market remains in the driving seat given the recent retest of a weekly support area coming in at 18365-18158.
Daily view: On the other side of the coin, daily price shows room to move south down to a daily broken Quasimodo line at 18279, which is lodged within the above said weekly support area.
H4 view: For the past two weeks US stocks have been grinding lower, consequently forming a relatively compact H4 descending channel (18636/18468). Initially our team was looking to buy from the H4 demand base at 18309-18356, but seeing as how price recently came within a few points of this zone and rallied higher, bids may have been weakened. What’s more, H4 price is now seen trading above the aforementioned channel suggesting a continuation move may be on the cards.
Direction for the week: We’re confident that should the bulls manage to defend the current weekly support area this week, the price of this index will continue to appreciate.
Direction for today: Should the DOW close above the current H4 channel resistance, we’ll likely see this unit continue to advance!
Our suggestions: Watch for a close above the H4 channel line, and look to trade the pullback (as per the black arrows). We would, however, recommend not entering off of this line with a market order since trendlines, at least in our experience, are regularly prone to fakeouts. Waiting for lower timeframe confirmation (see the top of this report) is by far the safer route to take as far as entry is concerned!
Levels to watch/live orders:
- Buys: Watch for price to close above the H4 channel resistance (18636) and look to trade any retest seen thereafter (lower timeframe confirmation required).
- Sells: Flat (Stop loss: N/A).
GOLD:
Weekly gain/loss: + $29
Weekly closing price: 1350.7
Weekly opening price: 1349.5
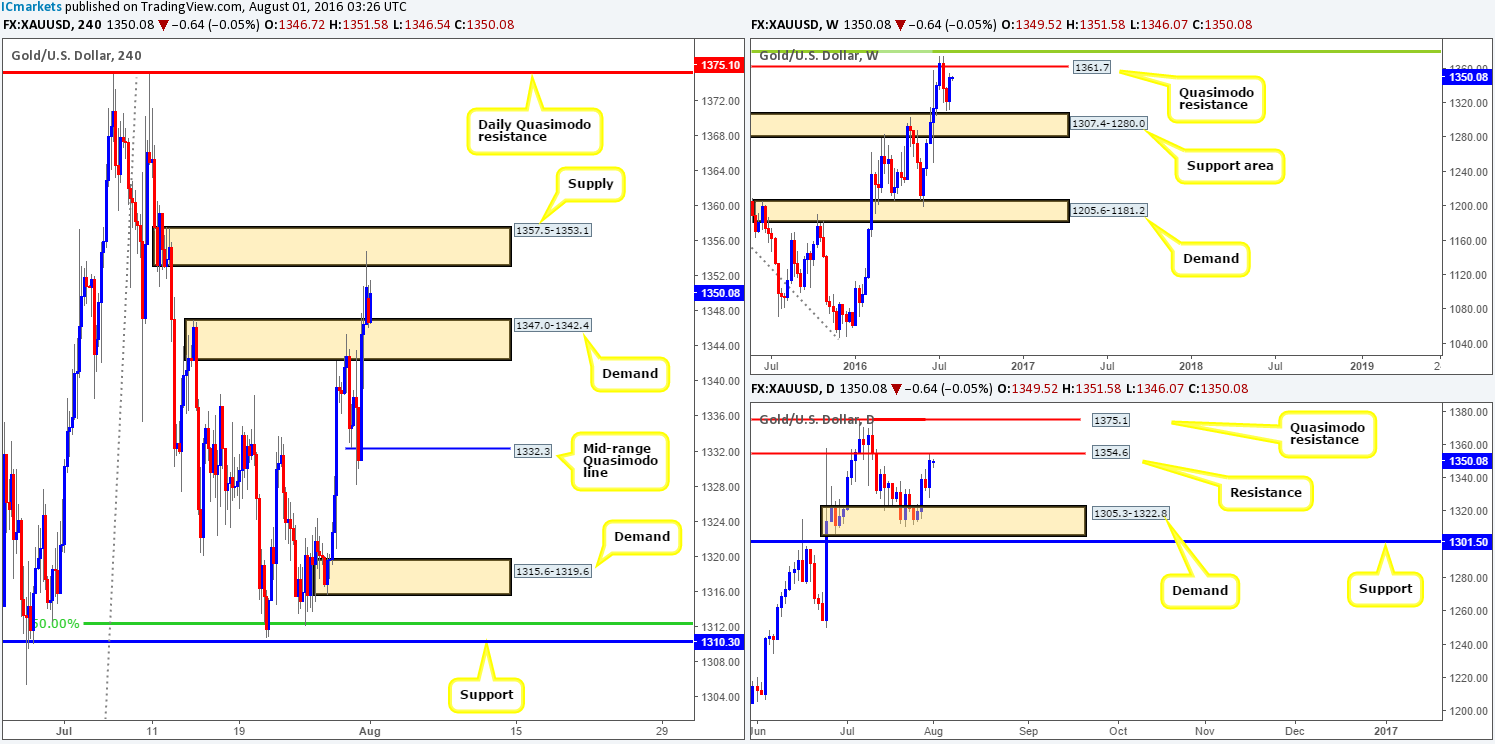
Weekly view: During the course of last week’s sessions, renewed buying was seen from just ahead of a weekly support area painted at 1307.4-1280.0. Consequent to this, the yellow metal is now seen trading below a Quasimodo resistance level chalked up at 1361.7.
Daily view: The story on the daily chart shows that last week’s advance brought gold up into the jaws of a daily resistance level coming in at 1354.6, which is for the time being holding the candles lower. Providing that offers remain firm here, the next downside target on this scale can be seen at 1305.3-1322.8 – a daily demand area that sits on top of the weekly support area mentioned above.
H4 view: With the US dollar weakening across the board on Friday, the safe-haven appeal for gold increased! As you can see, this movement saw price take out a H4 supply area at 1347.0-1342.4 (now acting demand) and connect with a H4 supply at 1357.5-1353.1 going into the close.
Direction for the week: Between 1361.7 (the weekly Quasimodo resistance) and 1354.6 (a daily resistance), higher-timeframe candle action, at least in our view, suggests that the metal may head lower into the week down to the aforementioned daily demand zone.
Direction for today: In our estimation, given the position of price on the higher-timeframe picture right now (see above), we feel a break below the current H4 demand zone is going to be seen, consequently opening up the path down to a H4 mid-range Quasimodo line at 1332.3.
Our suggestions: Watch for price to close below the current H4 demand base and look to trade any retest seen to the underside of the broken area, targeting 1332.3, followed by a H4 demand area at 1315.6-1319.6 (located within the aforementioned daily demand zone). To avoid fakeouts, our team still recommends waiting for a lower timeframe sell signal to short (see the top of this report) following a successful retest.
Levels to watch/live orders:
- Buys: Flat (Stop loss: N/A).
- Sells: Watch for price to close below the H4 demand at 1347.0-1342.4 and look to trade any retest seen thereafter (lower timeframe confirmation required).


