
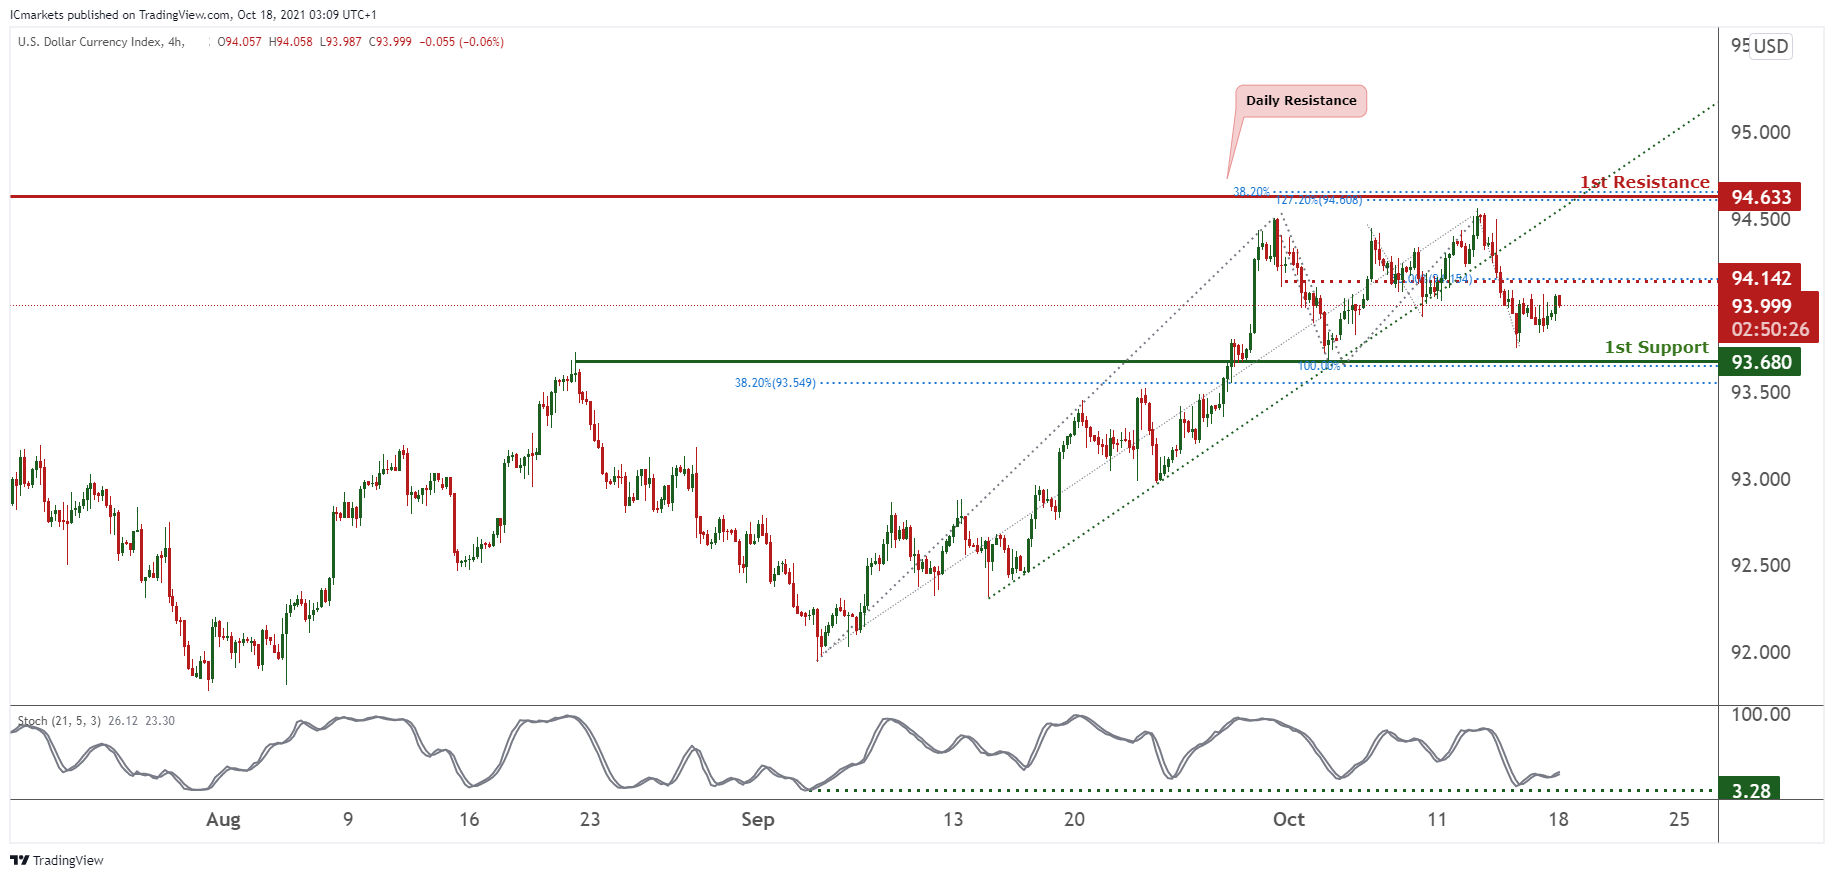
DXY:
On the H4 timeframe, prices have recently broken our ascending trendline and appear to be continuing its bullish momentum. We would watch our intermediate resistance at 94.142 which is a graphical overlap and also in line with 50% Fibonacci retracement. If prices break through the intermediate resistance, we see the possibility of it climbing higher towards our 1st resistance at 94.633 which is a daily resistance and Fibonacci confluences. Technical indicators are showing bullish momentum. Alternatively, prices may be attracted to our 1st support at 93.680 in line with 100% Fibonacci extension and 38.2% Fibonacci retracement, and also graphical overlap.
Areas of consideration:
- H4 time frame,1st resistance at 94.633
- H4 time frame, 1st support at 93.680
- H4 time frame intermediate resistance at 94.142
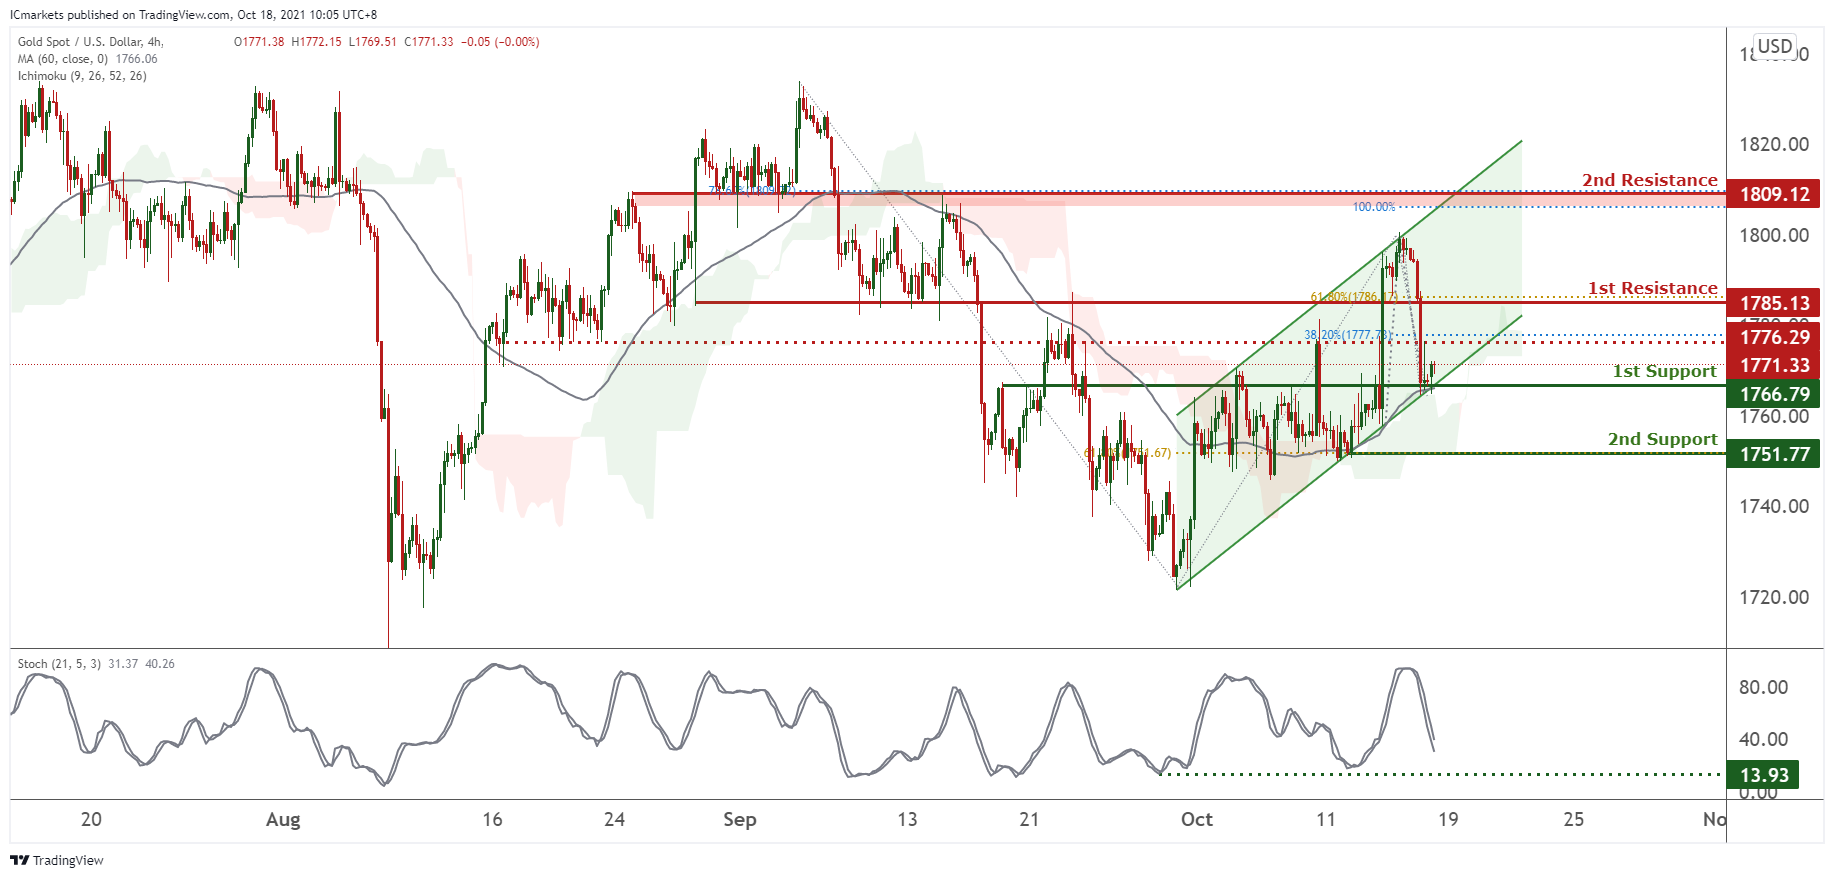
XAU/USD (GOLD):
On the H4 chart, prices are continuing in a parallel channel. Prices have recently tested the bottom of our parallel channel and we would expect a climb from our 1st support at 1751.77 in line with 61.8% Fibonacci retracement and 78.6% Fibonacci retracement towards our 1st support at 1778.06 in line with 61.8%, 78.6% and 38.2% Fibonacci retracement. Stochastics are at a level where dips previously happened. Alternatively, we would watch our Intermediate support at 1787.46 which is a graphical overlap.
Areas of consideration:
- 4h 1st support at 1778.06
- 4h intermediate support at 1787.46
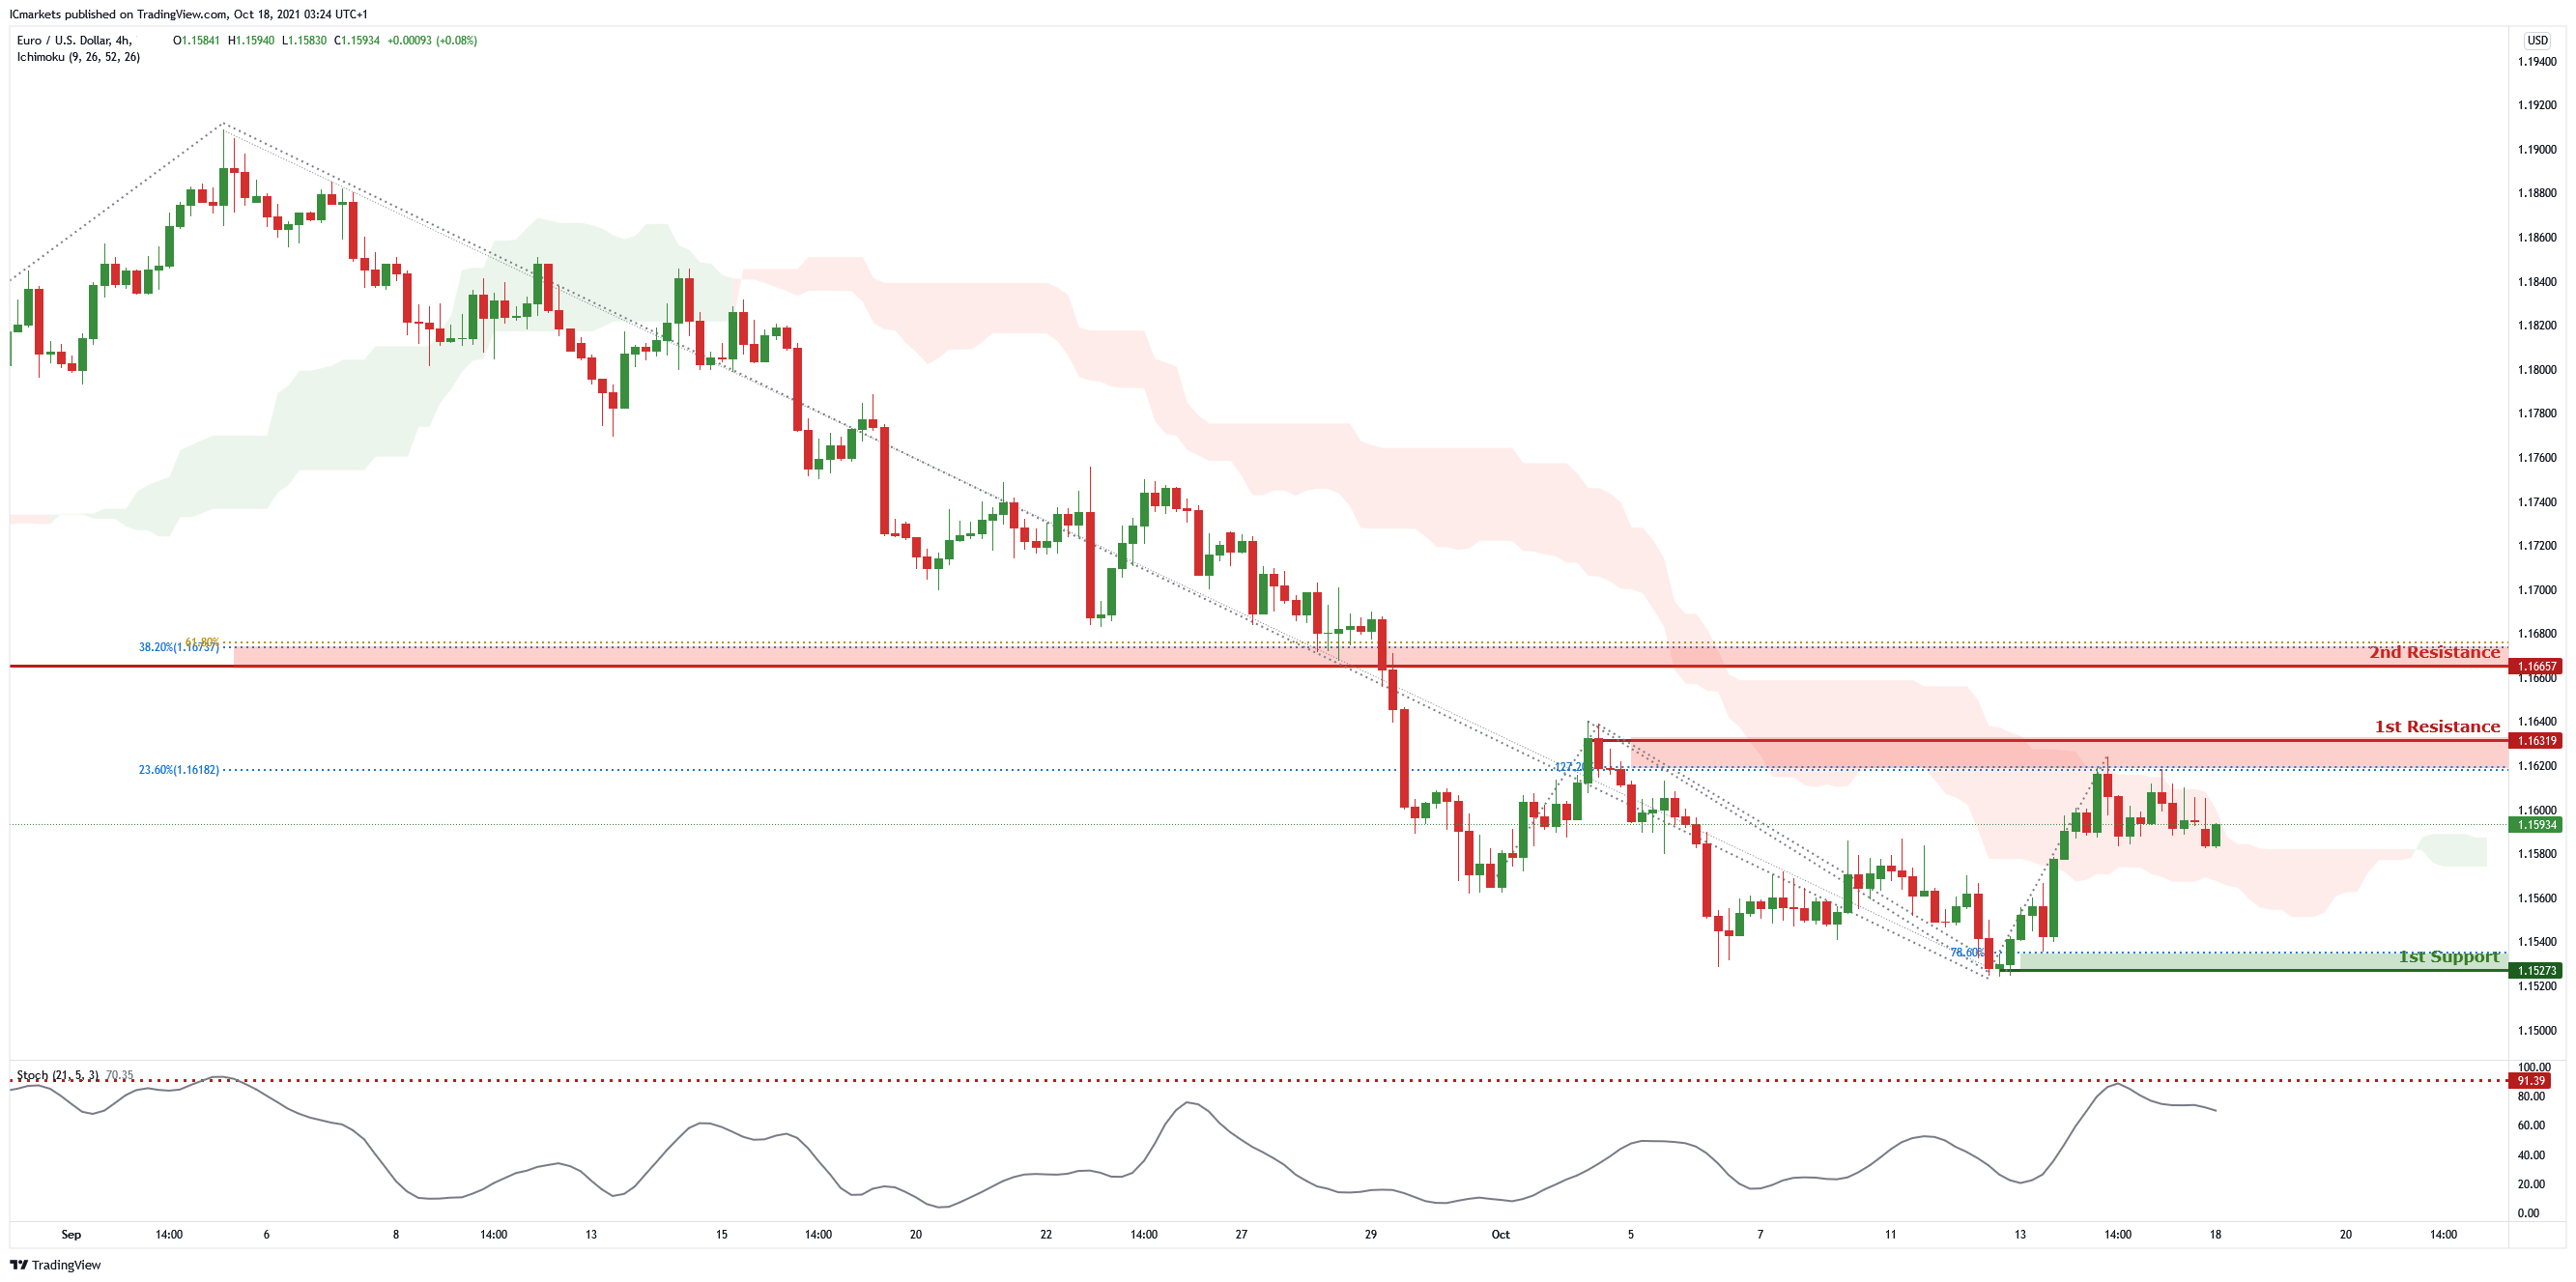
EUR/USD:
On the H4 chart, price has recently reached first resistance of 1.16319 which is also Fibonacci retracement level of 23.6% and Fibonacci projection of 127.2%. Price can then potentially have a short dip back to its first support of 1.15273 which is graphical swing low support and Fibonacci projection level of 78.6%. Our bearish bias is supported by our ichimoku cloud indicator and stochastic as it is near resistance.
Key considerations :
H4 first resistance – 1.16319
H4 first support – 1.15273
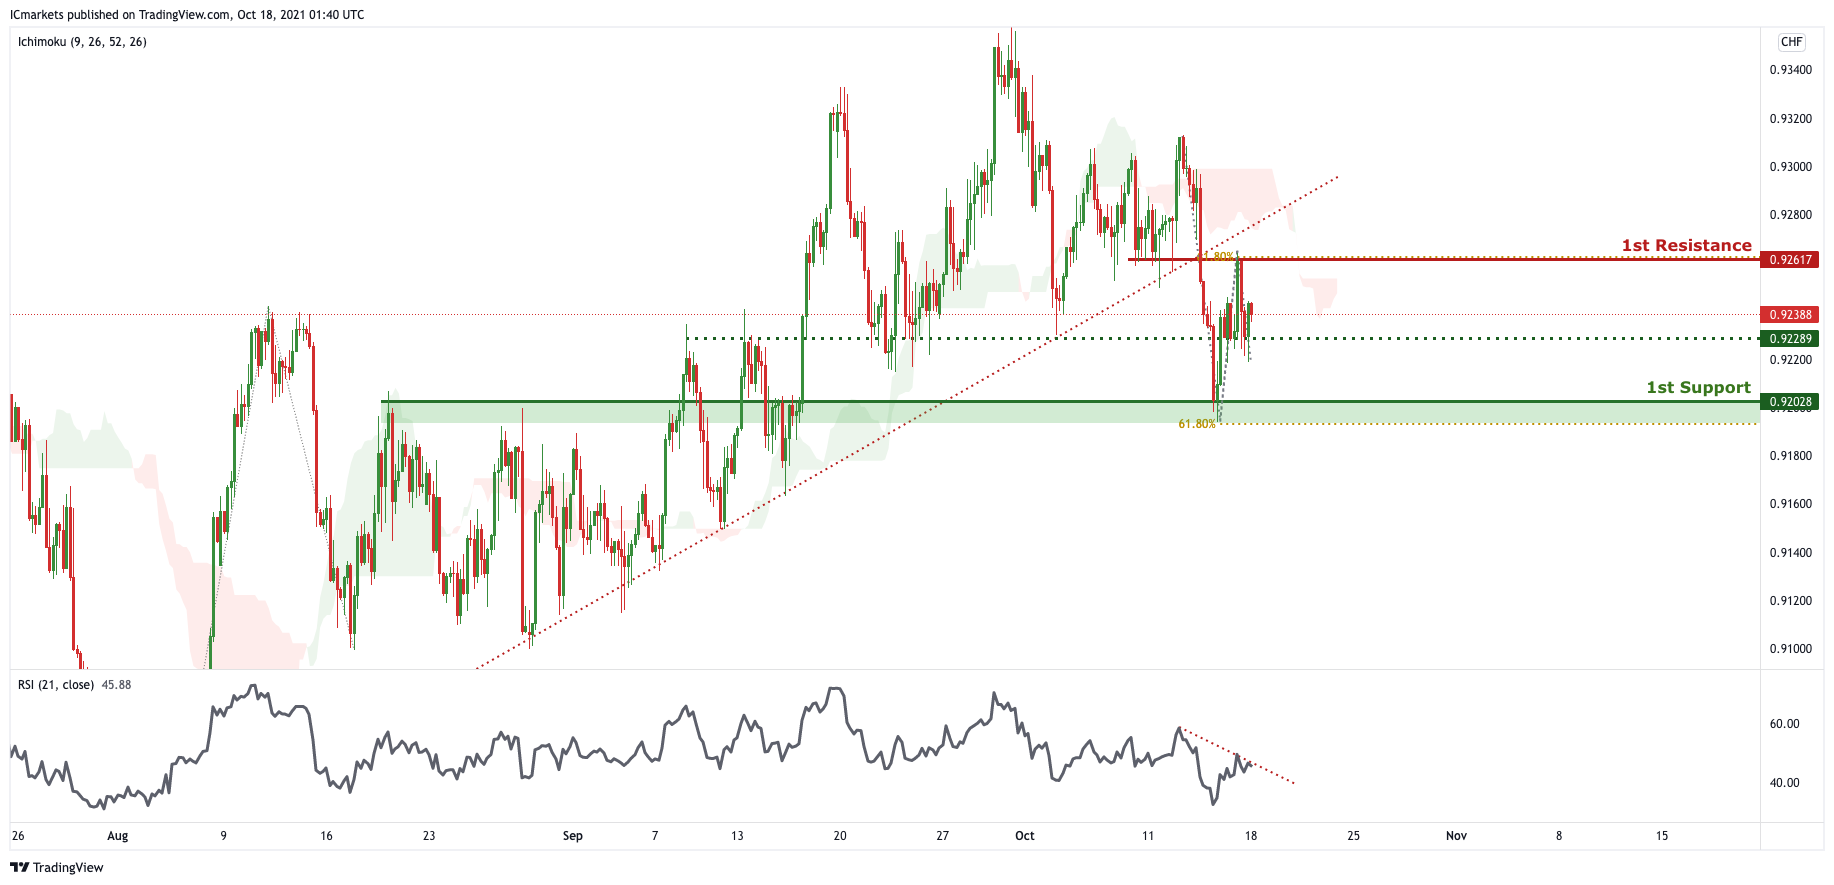
USD/CHF:
On the H4, price is seen to have broken past the ascending trendline support, signifying a bearish momentum. In reference to last week’s analysis, price did indeed move up to the 1st Resistance at price 0.92617, now we can expect price to push further down to the 1st Support in line with 61.8% Fibonacci projection if it passes through the intermediate support. Our bearish bias is further supported by price holding below the Ichimoku cloud and RSI abiding to the descending trendline resistance.
Areas of consideration:
- Watch 1st Support at 0.92028
- Watch 1st Resistance at 0.92617
GBP/USD:
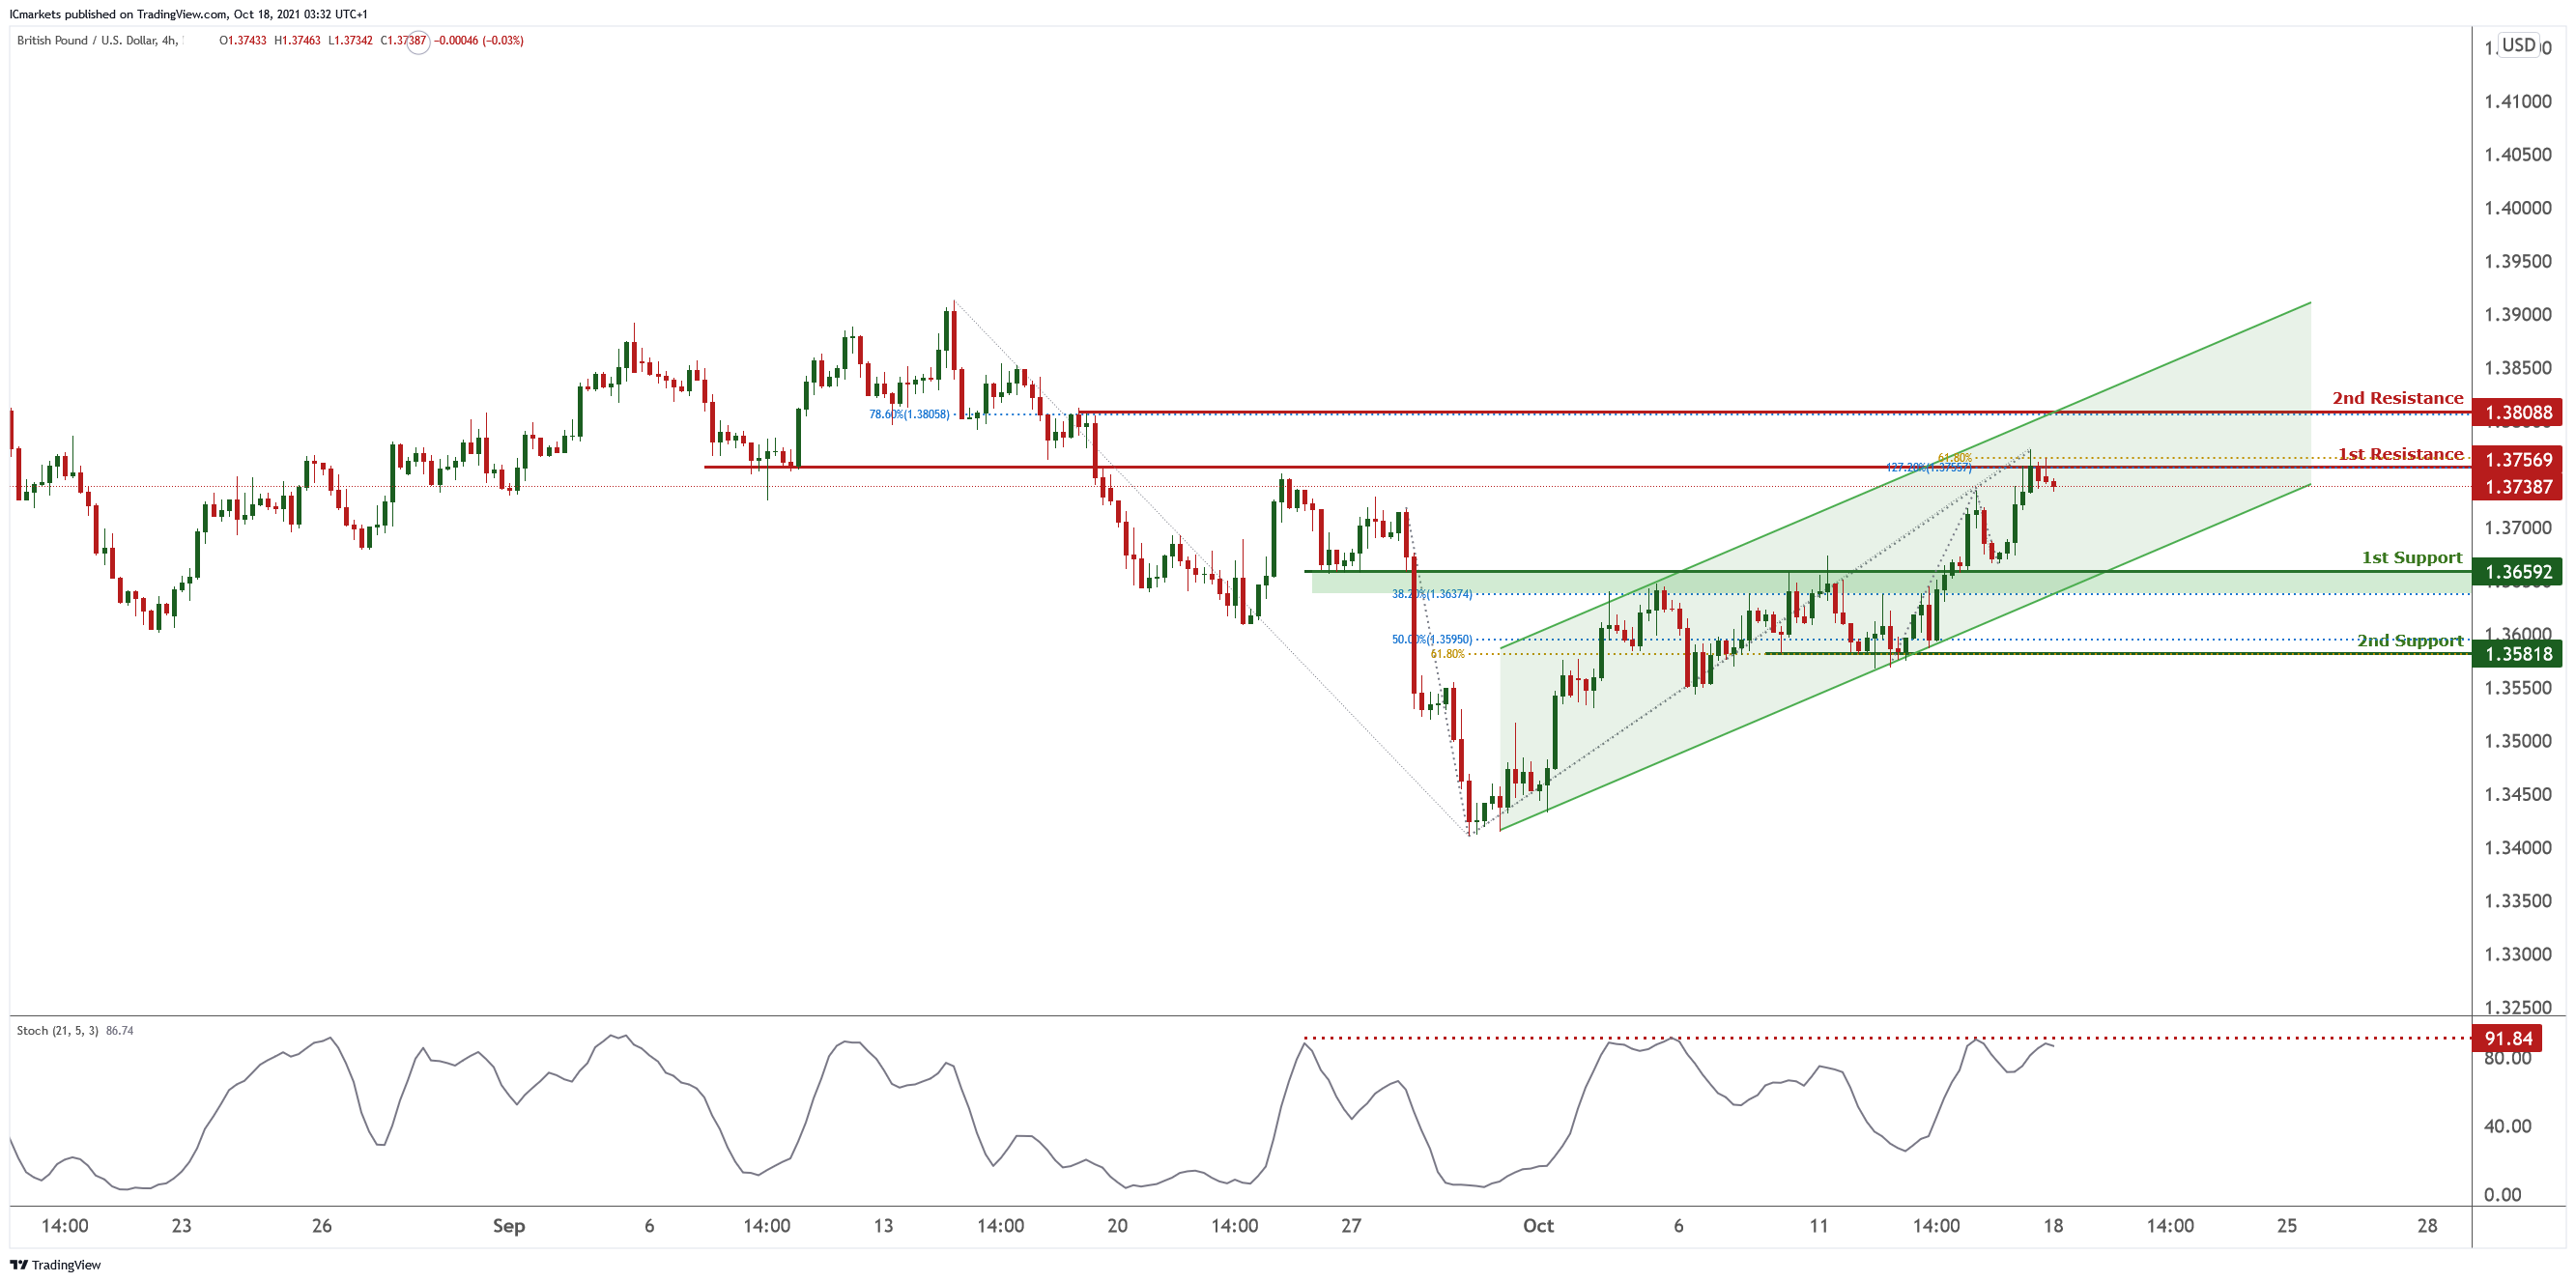
On the H4 chart, price is near the graphical overlap resistance of 1.37569 which is also our Fibonacci retracement level of 71.8% and Fibonacci projection level of 127.2%. Price can potentially dip back to its first support of 1.36592 which is also 38.2% Fibonacci retracement. Our bearish bias is supported by the stochastic indicator which shows that it is near resistance level.
H4 first resistance – 1.37569
H4 first support – 1.36592
USD/JPY:
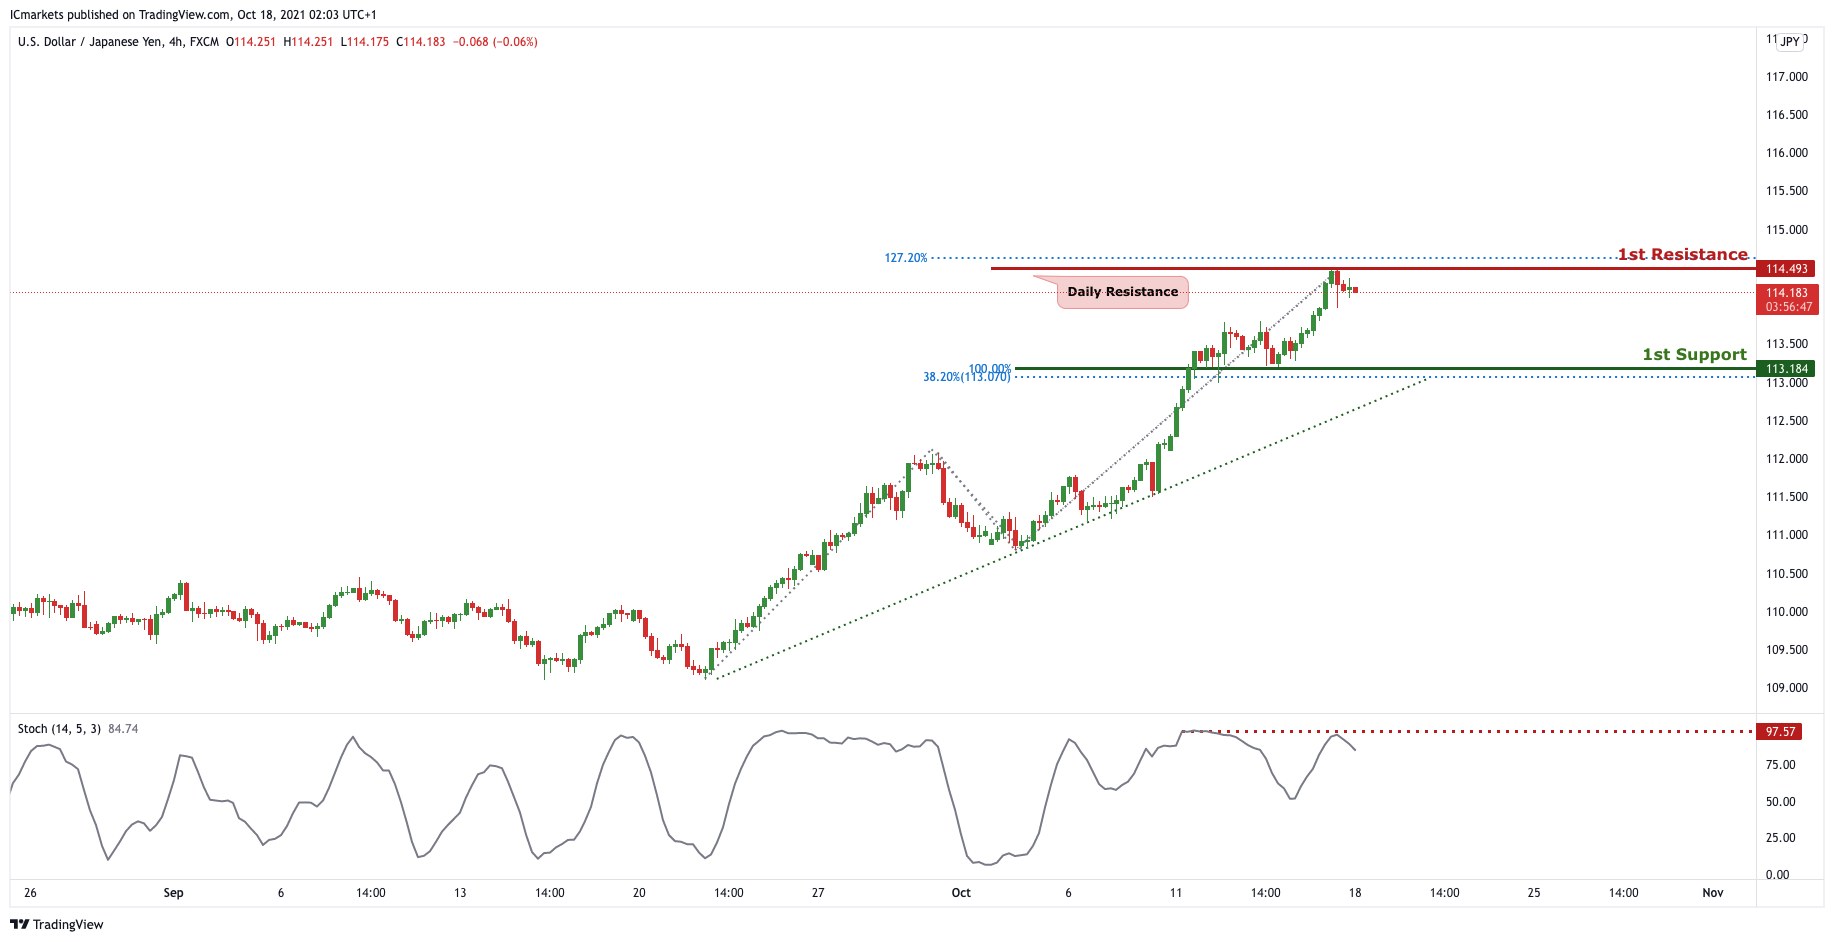
On the H4 timeframe, we can see that price indeed pushed up to the 1st Resistance that we have marked out last week and now we can expect the drop down to the 1st Support in line with 100% Fibonacci projection and 38.2% Fibonacci retracement. Our short-term bearish bias is further supported by the stochastic indicator where the %K line touched the resistance level and dropped.
Areas of consideration:
- H4 1st resistance level 114.493
- H4 1st support level 113.184
AUD/USD:
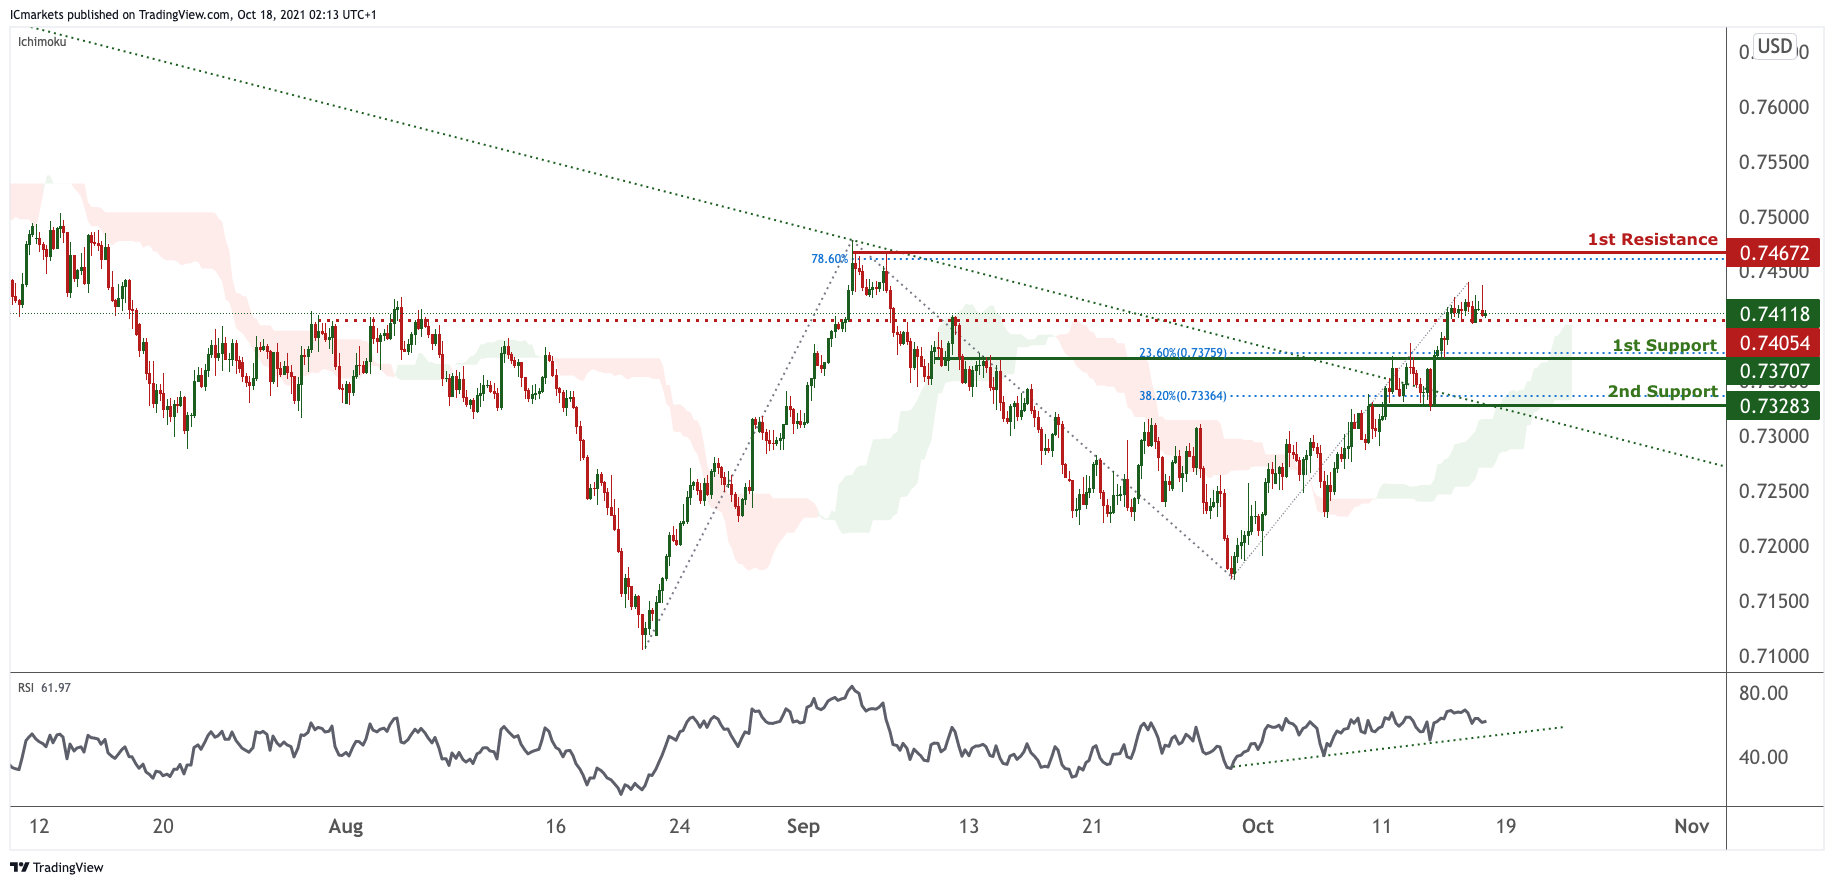
On the H4, price is seen to have broken out of the descending trendline resistance, signifying a bullish momentum. Prices have bounced off the 1st support, and broke past the intermediate resistance we were looking at, this shows a further upside confirmation. We can expect the price to push towards the 1st Resistance in line with the 78.6% Fibonacci projection. Our bullish bias is further supported by the RSI indicator abiding to the ascending trendline and Ichimoku cloud providing a strong support.
Areas of consideration:
- H4 1st resistance level 0.74672
- H4 1st support level 0.73707
NZD/USD:
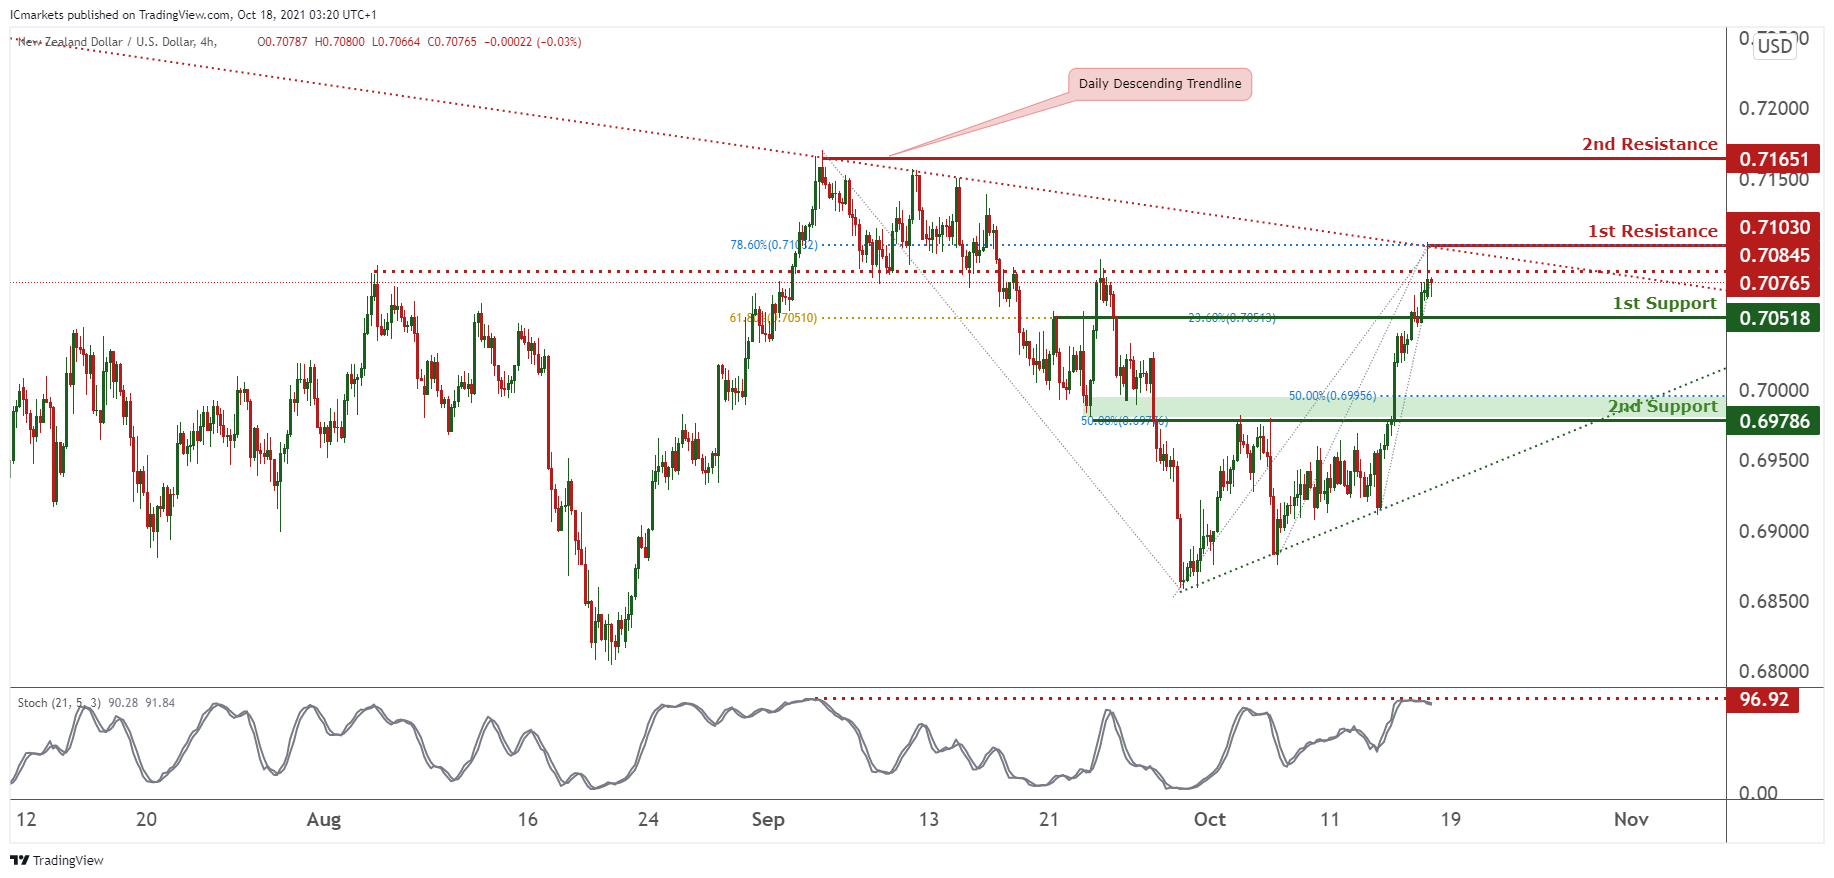
On the H4 timeframe, price is consolidating in a triangle. Price could potentially enter for shorts from our intermediate resistance at 0.70845 which is a graphical overlap towards our 1st support at 0.70518 which is a graphical overlap and in line with 23.6% and 61.8% Fibonacci retracement towards our 1st support at 0.70518 in line 61.8% and 23.6% Fibonacci retracement and graphical overlap. Stochastics are at a level where dips happened previously. Alternatively, if prices breaks our 1st resistance, it might potentially climb higher towards our 2nd resistance at 0.71651.
Areas of consideration:
- H4 time frame, 1st support at 0.70518
- H4 time frame, 1st resistance at 0.71030
- H4 time frame, intermediate resistance at 0.70845
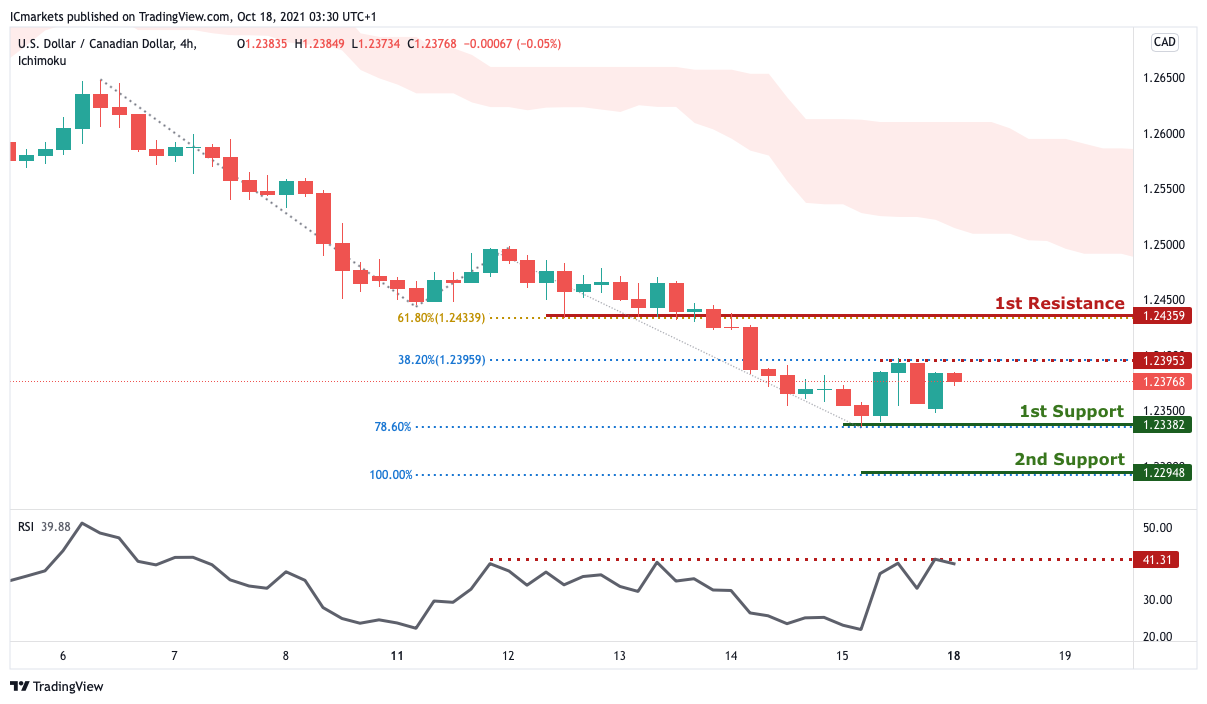
USD/CAD:
On the H4, we can see price approaching the intermediary resistance at 1.23953 in line with the 38.2% Fibonacci retracement. With the existing bearish sentiment where price is moving below the ichimoku and in a downwards trend, we may expect to see price head for 1st support at 1.23382 in line with the 78.6% Fibonacci extension and possibly even 2nd support at 1.22948 in line with the 100% Fibonacci extension level from the intermediary resistance. Alternatively, we may see price to a retest at 1st resistance at 1.24359 in line with the 61.8% Fibonacci retracament.
Areas of consideration:
- H4 time frame, support at 23382
- H4 time frame, resistance at 24359
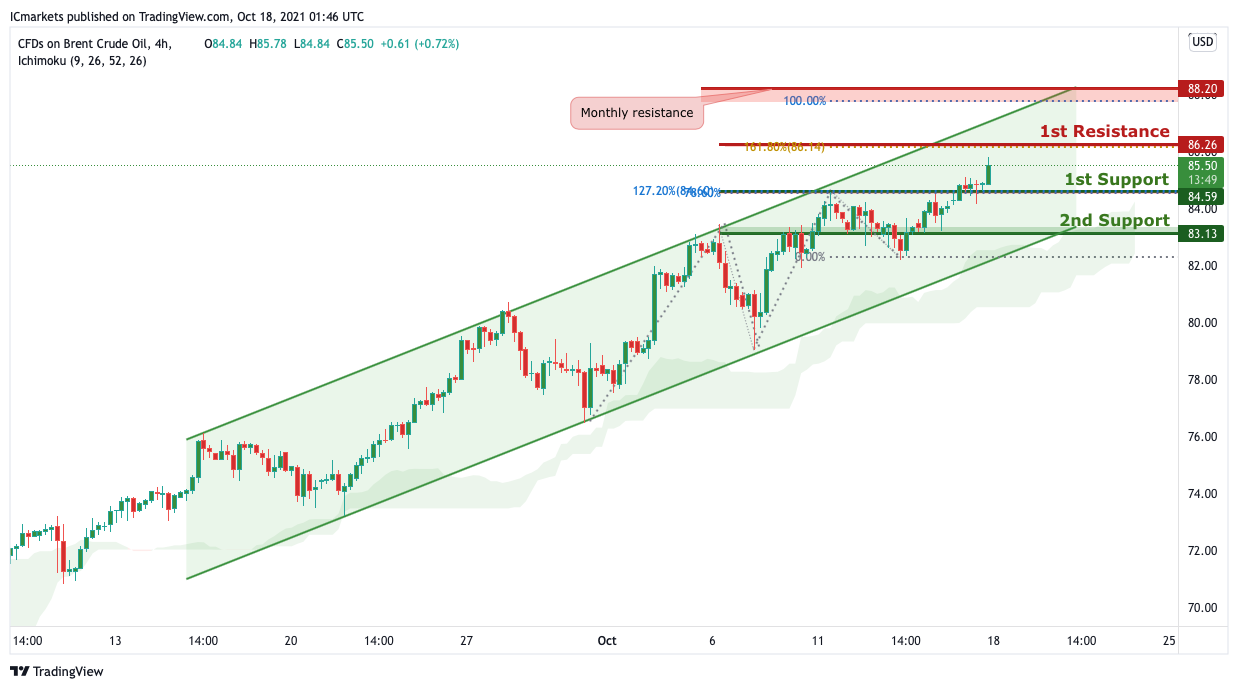
OIL:
On the H4 timeframe, we have a bullish bias which is supported by the ichimoku indicator and the ascending channel. From 1st support at 84.59 in line with the we may see price head for 1st resistance at 86.26 in line with 161.8% Fibonacci extension which is also a weekly and daily resistance and possibly even to 2nd resistance at 88.20 which is our monthly high in line with the 100% Fibonacci extension. Alternatively, we may break 1st support structure at 84.59 which is our horizontal overlap support and head for 2ns support at 83.13.
Areas of consideration:
- H4 time frame, 1st resistance of 86.26
- H4 time frame, 1st support of 84.59
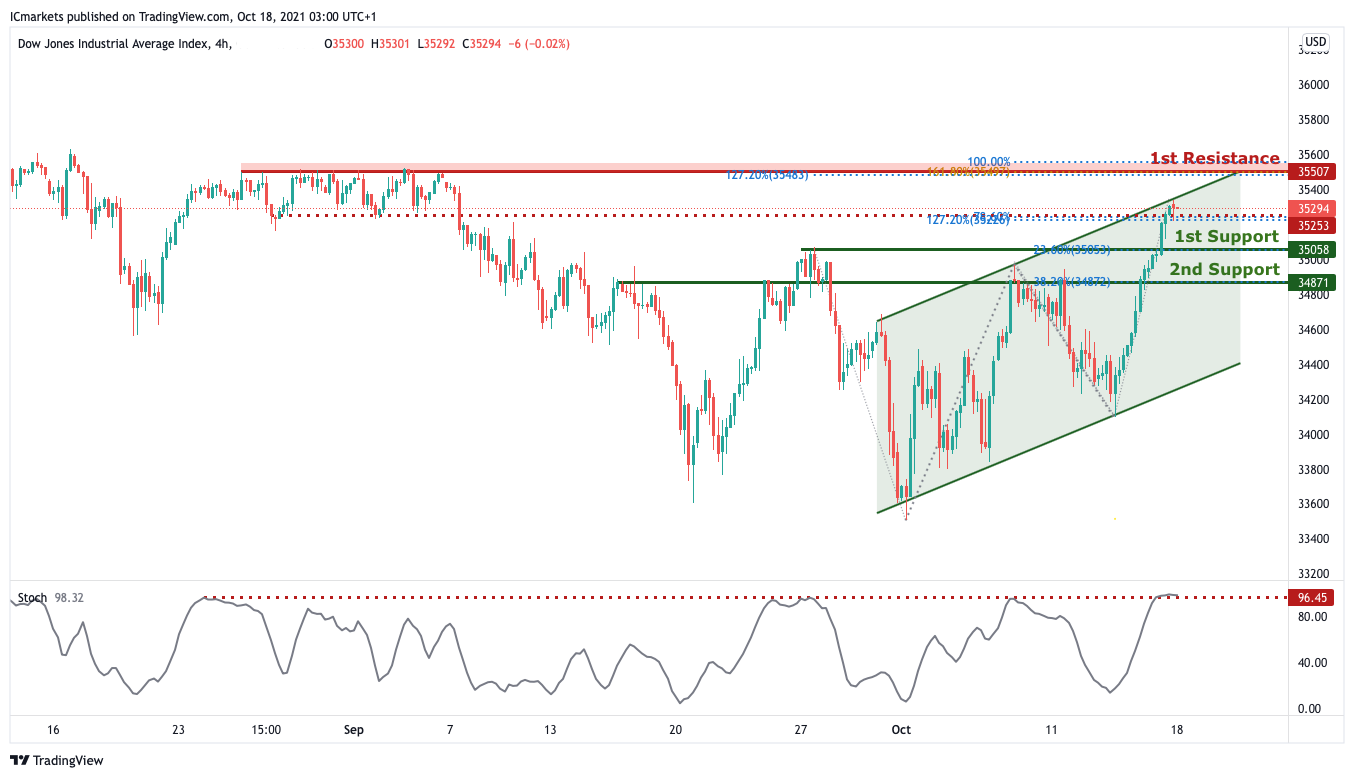
Dow Jones Industrial Average:
On the H4, with the stochastic indicator and the ascending channel showing that price is at a resistance, it strengthens our bias that there may be a short term bearish move where price will head down from current price. We are likely to see price head for 1st resistance at 35058 in line with the 23.8% Fibonacci retracement. This is considering price manages to break the intermediary resistance at 25294 which is a horizontal overlap resistance. If it continues to stay above this intermediary resistance, we may see price continue its upwards momentum to 35507 which is the 1st resistance in line with 100%, 127.2%, 161.8% Fibonacci extension.
Areas of consideration:
- 4H resistance at 35058
- 4H support at 35507
The accuracy, completeness and timeliness of the information contained on this site cannot be guaranteed. IC Markets does not warranty, guarantee or make any representations, or assume any liability regarding financial results based on the use of the information in the site.
News, views, opinions, recommendations and other information obtained from sources outside of www.icmarkets.com.au, used in this site are believed to be reliable, but we cannot guarantee their accuracy or completeness. All such information is subject to change at any time without notice. IC Markets assumes no responsibility for the content of any linked site.
The fact that such links may exist does not indicate approval or endorsement of any material contained on any linked site. IC Markets is not liable for any harm caused by the transmission, through accessing the services or information on this site, of a computer virus, or other computer code or programming device that might be used to access, delete, damage, disable, disrupt or otherwise impede in any manner, the operation of the site or of any user’s software, hardware, data or property.


