Key risk events today:
China Industrial Production y/y; China Fixed Asset Investment ytd/y; G7 Meetings; US Empire State Manufacturing Index.
(Previous analysis as well as outside sources – italics).
EUR/USD:
Weekly gain/loss: -1.61%
Weekly close: 1.1103
Weekly perspective:
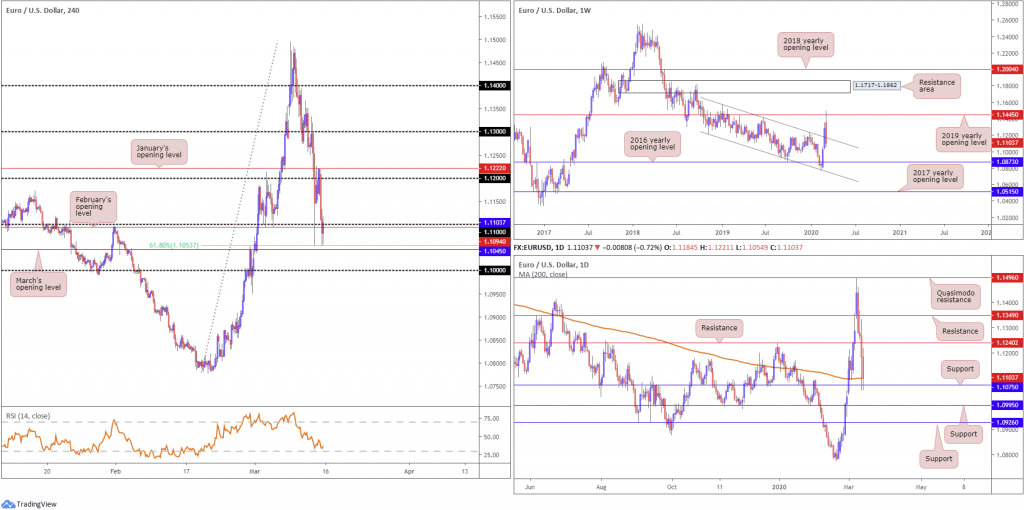
The 2019 yearly opening level from 1.1445 elbowed its way back into the spotlight last week, with bears reasserting their dominance and snapping a three-week winning streak. Down more than 180 points, price dipped its toes back within a descending channel formation (1.1569/1.1215), and is poised to revisit support priced in at 1.0873 (the 2016 yearly opening level) this week, in line with the primary trend, drifting south since 2018.
Daily perspective:
Following a near-to-the-point test of Quasimodo resistance at 1.1496, EUR/USD went back to playing on the defensive last week. Nudging through support at 1.1349 on Tuesday, the pair eventually went on to shake hands with the 200-day SMA (orange – 1.1100) and support at 1.1075 Friday. A rejection here has resistance at 1.1240 to target.
Focus shifts to nearby support at 1.0995, followed by another layer of support at 1.0926, in the event we push for lower ground this week.
H4 perspective:
After a fleeting move north of 1.12, feeling January’s opening level at 1.1222, EUR/USD spun off into a phase of selling amid coronavirus-led USD strength Friday. Down moves probed 1.11 and February’s opening level at 1.1094, consequently retesting a familiar 61.8% Fibonacci retracement level at 1.1053, sited north of March’s opening level at 1.1045. South of 1.1045, eyes are also likely on the widely watched figure 1.10. The relative strength index (RSI) is also seen mildly bottoming a few points ahead of oversold waters.
Meanwhile, on the news front, US President Trump declared a national emergency over the coronavirus, allowing the government to tap up to $50bn in emergency relief funds. In addition to this, (Abc News) the Fed accelerated its bond purchases to address ongoing disruptions in the Treasury bond market, the largest and one of the most important financial markets in the world.
Areas of consideration:
A decisive move north of 1.11 this week could rejuvenate intraday buying, bolstered by the current daily supports, targeting the 1.12ish region. Conservative traders will likely want a retest at 1.11 to form before committing. If the retest forms by way of a H4 bullish candlestick formation, this will likely add weight.
Breaking 1.1045, however, will possibly trigger intraday bearish scenarios to 1.10, followed by daily support at 1.0995.
GBP/USD:
Weekly gain/loss: -5.89%
Weekly close: 1.2277
Weekly perspective:
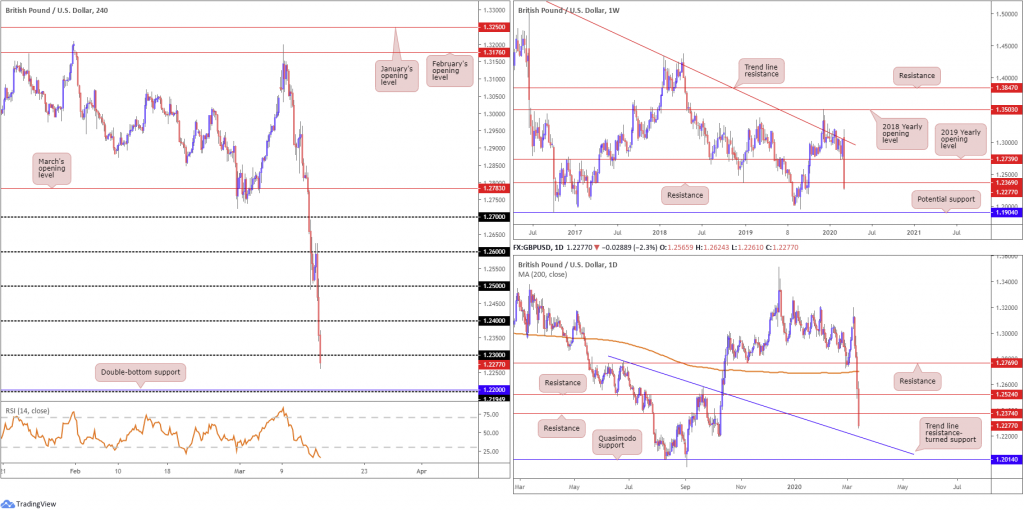
Pound markets were pummelled last week; GBP/USD erased 760 points as recent events drew USD haven demand back in play. Closing a touch off lows and recording its heaviest loss since 2008, the pair wrapped up the session beneath the 2019 yearly opening level at 1.2739 and support at 1.2369, both now potentially serving resistances. Support resides around 1.1904, a level that capped downside in early October 2016, and is sited just south of the 1.1958 September 2nd low.
Daily perspective:
The sharp slump in the pound saw price refresh multi-month lows at 1.2261 at the tail end of the session. The ride down swept through a number of key support levels, including 1.2374, consequently positioning the unit within touching distance of trend line resistance-turned support, extended from the high 1.2783. Chart studies reveal that a move beyond the said trend line this week could see the daily timeframe welcome Quasimodo support at 1.2014.
H4 perspective:
Robust dollar bidding had intraday movement revisit the underside of 1.26 and go on to clear three big figures Friday, closing a touch south of 1.23. Though the relative strength index (RSI) is establishing a position within the borders of oversold ground, the close beneath 1.23 may have prepped the ground for an approach to the 1.22 vicinity, which also represents a double-bottom support drawn from October 2019.
Areas of consideration:
While there’s a possibility a bout of short covering may emerge this week, potentially reclaiming 1.23+ status and targeting 1.2369 (weekly resistance), follow-through selling is equally probable.
A retest at the underside of 1.23 that holds in the form of a H4 bearish candlestick signal tilts the probability in favour of selling, offering traders high-probability entry into the market, targeting 1.22.
1.22, although a downside target, also represents an area of strong support to keep an eye on this week. Not only a widely watched psychological figure by and of itself, 1.22 comes with the RSI treading water within oversold terrain, a H4 double-bottom support and an intersecting daily trend line resistance-turned support, taken from the high 1.2783.
AUD/USD:
Weekly gain/loss: -6.95%
Weekly close: 0.6183
Weekly perspective:
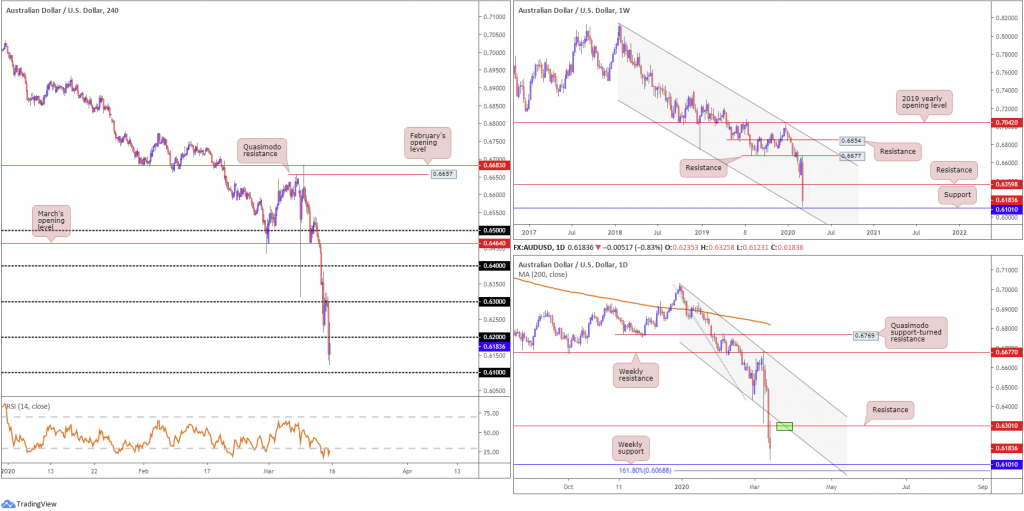
Subject to broad risk sentiment and related moves in the US Dollar, AUD/USD cemented losses in excess of 450 points over the course of last week. Moves lower followed a near-to-the-point retest at resistance drawn from 0.6677, tunnelling through support at 0.6359 and closing within a few points of support at 0.6101, levels not seen since 2008. What’s also notable from a technical perspective is channel support intersects with the current support.
Daily perspective:
The Aussie surrendering ground last week watched channel support, taken from the low 0.6433, and support at 0.6301, give way, now both serving resistance levels. In similar fashion to the weekly timeframe, support is seen at 0.6101, though on the daily scale technicians will note additional support derived from a 161.8% Fibonacci extension point at 0.6068.
Resistance at 0.6301 and the intersecting channel support-turned resistance (green) may be of interest to some traders this week.
H4 perspective:
A brief recap of Friday’s session on the H4 timeframe observed an attempt to reclaim 0.63 during Asia and most of London’s session. Things turned sour in early US – in one fell swoop we crashed through 0.62 and clocked lows of 0.6123.
Remaining beneath 0.62 into the close, focus now shifts towards the 0.61 handle which merges with weekly support priced in at 0.6101 and the weekly channel support. The relative strength index (RSI) on the H4 also concluded the session within oversold ground.
Areas of consideration:
According to the primary trend and higher-timeframe structure, the outlook is not bright for AUD/USD, at least until reaching 0.61ish.
H4 price closing beneath 0.62 Friday likely tripped sell-stops from those long the round number, and drew in breakout sellers. An interesting scenario, for those attempting to trade moves lower this week, is for H4 price to form a bearish candlestick signal off 0.62. Entry/risk can then be calculated based on this signal, with a downside objective set at 0.61, which also represents a possible reversal zone, given weekly support confluence.
USD/JPY:
Weekly gain/loss: +2.49%
Weekly close: 107.96
Weekly perspective:
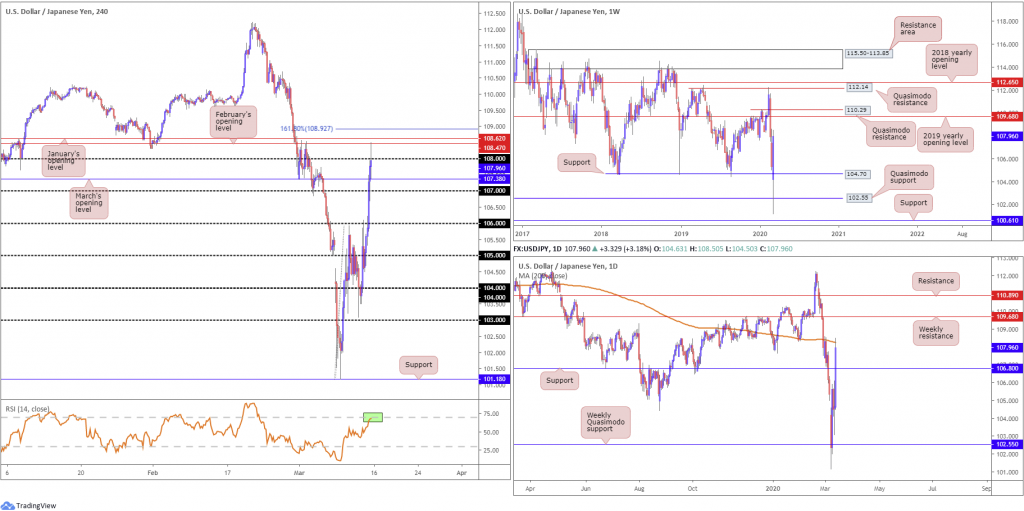
Following two weeks of dominant selling, USD/JPY witnessed a resurgence of bidding take hold last week, reclaiming approximately 50% of recent losses. 104.70 enters the new week as support while the next upside target lies at the 2019 yearly opening level from 109.68, closely followed by Quasimodo resistance coming in at 110.29.
Daily perspective:
Closer analysis on the daily timeframe has the pair searching for bidders north of resistance at 106.80 (now a serving support), after testing the underside of the widely watched 200-day SMA (orange – 108.25). Though the said SMA may appeal as resistance, clearance of this level focuses the limelight on weekly resistance highlighted above at 109.68, the weekly Quasimodo resistance at 110.29 and daily resistance at 110.89.
H4 perspective:
Friday had the USD/JPY exchange rate rise from an open of 104.63 to a high of 108.50, clearing several big figures, including the 107 handle and resistance formed by way of March’s opening level at 107.38.
At the tail end of the week, price dipped its toes in waters above 108 and tested February’s opening level at 108.47, located just south of January’s opening level at 108.62 and a 161.8% Fibonacci extension point at 108.92. Price settled south of 108 with 107.38 potentially calling for attention this week, followed by 107. Also of note is the relative strength index (RSI) seen testing overbought territory (green).
Areas of consideration:
The combination of the 200-day SMA and 108 holding on the H4 may send USD/JPY lower today/early week, with traders likely to embrace 107.38 and 107 on the H4 timeframe as support. A break lower, though, lands the unit within striking distance of daily support at 106.80.
However, longer term, based on the weekly timeframe, provides a foundation for an approach to the 2019 yearly opening level mentioned above at 109.68. Therefore, the pullback from 108 is likely to be brief.
USD/CAD:
Weekly gain/loss: +2.87%
Weekly close: 1.3805
Weekly perspective:
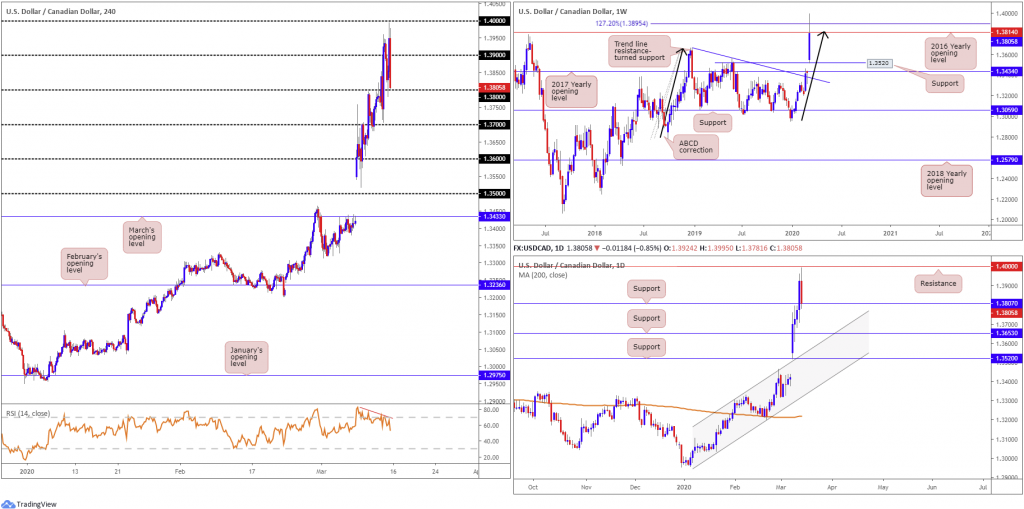
USD/CAD bulls went on the offensive in recent trading, adding 385 points into the close. In light of broad-based USD strength and waning oil prices, it’s difficult to rule out the possibility of fresh upside attempts this week. However, technical structure recently completed a 127.2% ABCD bearish pattern (black arrows) at 1.3895, a touch above potential resistance in the form of the 2016 yearly opening level at 1.3814.
A pullback from said resistances has the 1.3661 December 24th high to target, followed by support at 1.3520 and the 2017 yearly opening level at 1.3434.
Daily perspective:
Snapping a six-day bullish phase, price action on the daily timeframe retreated just ahead of resistance at 1.4000 Friday and retested 1.3807 as support. A break lower here could see another support at 1.3653 enter this week that aligns closely with channel resistance-turned support, taken from the high 1.3303.
H4 perspective:
Friday witnessed the Bank of Canada (BoC) cut its key overnight interest rate to 0.75% from 1.25%. The central bank said the unscheduled rate decision is a proactive measure taken in light of the negative shocks to Canada’s economy arising from the COVID-19 pandemic and the recent sharp drop in oil prices.
Technically speaking, USD/CAD bulls lost their flavour a few points beneath the widely watched psychological figure 1.40, running through 1.39 and testing levels a touch off 1.38. Indicator-based traders will also note the relative strength index (RSI) is currently seen producing bearish divergence.
Areas of consideration:
With weekly price threatening a pullback this week, traders may view a close beneath the current daily support at 1.3807, as well as the 1.38 handle on the H4 scale, as confirmation to the downside.
A H4 close beneath 1.38, followed up with a retest in the shape of a bearish candlestick signal, therefore, may encourage selling this week, targeting 1.37 as the initial port of call.
USD/CHF:
Weekly gain/loss: +1.46%
Weekly close: 0.9506
Weekly perspective:
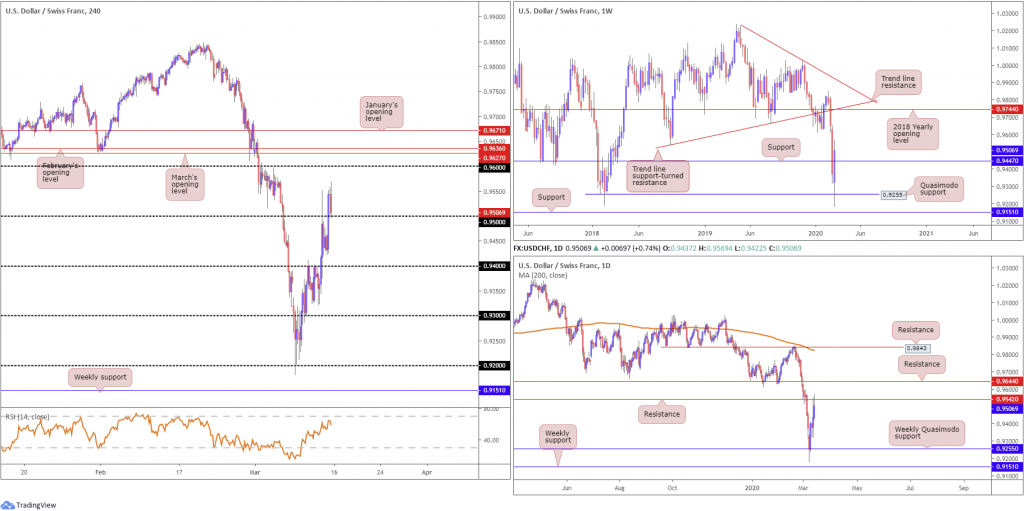
Quasimodo support at 0.9255 capped downside last week, albeit following a brief spell to lows at 0.9182 (levels not seen since June 2015). Recovery from here saw resistance from 0.9447 come under fire, with buy stops north of the level releasing another wave of buying to highs of 0.9569. The general sense on this timeframe is that continued buying this week will draw the spotlight towards the 2018 yearly opening level at 0.9744, joined closely by two trend line resistances (0.9542/1.0226). Though before we reach these levels, traders may want to pencil in the possibility of a retest at 0.9744.
Daily perspective:
Recent buying could be tested sooner than expected, according to the daily timeframe, with resistance at 0.9542 entering the fight at the tail end of the week. A violation of this level could lead to some headway being made towards 0.9644, another layer of resistance.
H4 perspective:
Broad-based USD strength allowed the pair to preserve its bullish momentum Friday, reclaiming 0.95+ status and pulling the RSI value higher in the process. To the left of current price, a portion of supply resides around the 0.9550ish region, with a break exposing the 0.96 handle, closely shadowed by March and February’s opening level at 0.9627 and 0.9636, respectively.
Areas of consideration:
A retest at 0.95 came to fruition in the last hour Friday. Knowing we’re coming from daily resistance at 0.9542, buyers may be nervous off 0.95. The flip side to this, of course, is the space available to run higher this week on the weekly timeframe.
Round numbers such as 0.95 are prone to whipsaws, therefore traders are urged to consider the possibility of a fakeout through the level being seen before buyers step in. To help avoid falling victim to a fakeout scenario traders may wait and see if a H4 bullish candlestick pattern forms. Not only does this identify buyer intent, it provides entry and risk levels to work with.
Dow Jones Industrial Average:
Weekly gain/loss: -11.52%
Weekly close: 22828
Weekly perspective:
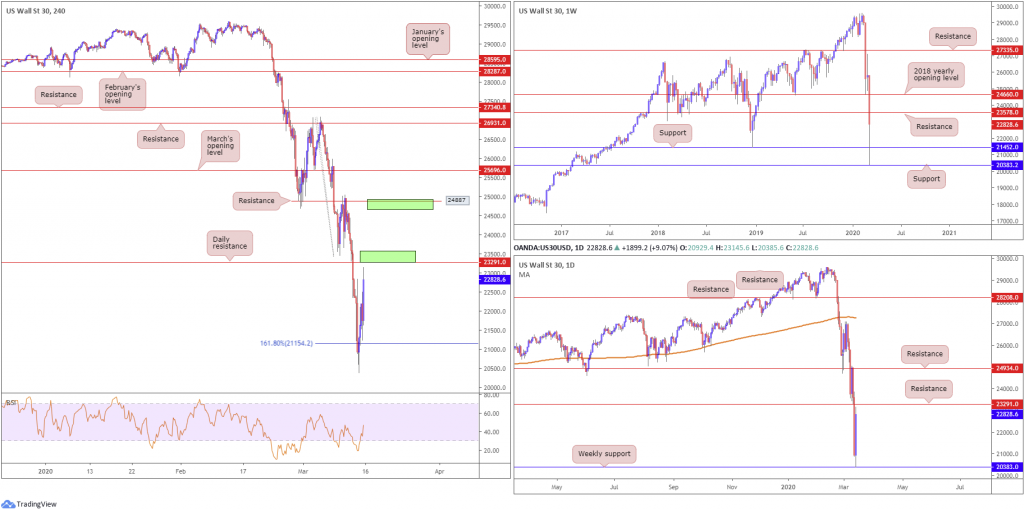
The 2018 yearly opening level at 24660, despite containing downside for a brief spell, collapsed last week, with price action scoring lows at 20385, levels not seen since February 2017.
The unit found support a touch north of 20383, after crunching through support at 23578 and another support base at 21452, with 23578 now a serving resistance level heading into the new week.
Daily perspective:
In similar fashion to the weekly timeframe, we can see price derived support above 20383, though based on the daily scale resistance could develop off 23291. A break higher could lead to some headway being seen towards resistance at 24934.
H4 perspective:
US stocks rallied Friday following US President Donald Trump declaring the coronavirus outbreak a national emergency, freeing up money to fight the spread of the disease. The Dow Jones Industrial Average added 1985.00 points, or 9.36%; the S&P 500 also firmed 230.38 points, or 9.29% and the tech-heavy Nasdaq 100 ended higher by 731.61 points, or 10.07%.
Areas of consideration:
The H4 zone marked in green (lower area) between 23578/23291 represents nearby weekly and daily resistances, an area sellers may have on the radar this week for potential shorting opportunities. Another area of interest (upper green zone), in the event 23578/23291 fails to produce much, is seen between 24934/24660, a zone made up of the 2018 yearly opening level at 24660, daily resistance at 24934 and H4 resistance at 24887.
XAU/USD (GOLD):
Weekly gain/loss: -8.59%
Weekly close: 1529.7
Weekly perspective:
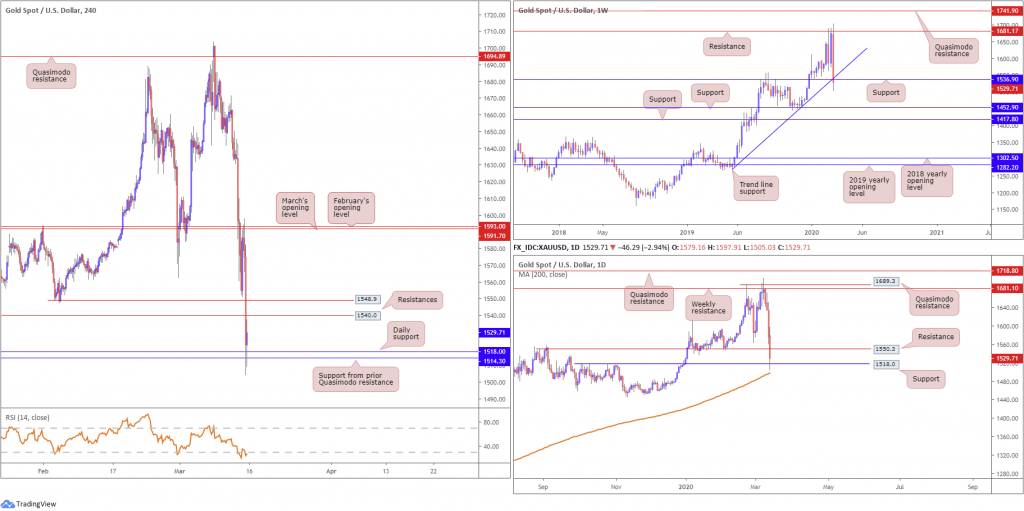
Despite an earnest attempt to sustain gains above resistance at 1681.1, sellers strengthened their grip last week leading to trend line support, extended from the low at 1269.6, and support drawn from 1536.9, entering the fold.
Note the week ended by way of a bearish outside formation, marginally breaching the said supports. This suggests scope for further downside towards another layer of support at 1452.9, followed by support priced in at 1417.8.
Daily perspective:
With upside attempts limited by weekly resistance underscored above at 1681.1, support at 1550.3 suffered a hit to the mid-section, guiding the yellow metal to support at 1518.0. Interestingly, the 200-day SMA (orange – 1497.3) is seen surfacing just beneath the said level, providing an additional support buffer, in the event we attempt to extend losses today/early week.
H4 perspective:
Gold concluded trade off fresh YTD lows at 1505.0 Friday following an almost picture-perfect retest motion off March and February’s opening levels at 1591.7 and 1593.0. Spot gold modestly pared losses at support coming in from a prior Quasimodo resistance level at 1514.3, reinforced by daily support derived from 1518.0. To the upside, resistance is expected to develop off 1540.0 and 1548.9, both prior Quasimodo support levels. With respect to the relative strength index (RSI), we’re now trading within overbought terrain, but seen attempting to regroup off lows at 19.00.
Areas of consideration:
Weekly support at 1536.9 and its joining trend line support seen marginally under pressure, draws the crosshairs to daily resistance at 1550.3 this week, potentially serving as a ceiling. Note also we have H4 resistance lurking close by at 1548.9, too. As such, this could be an area worthy of the watchlist this week.
Should the market slam on the brakes and reverse higher, however, taking 1550.3 would be interesting, possibly laying the basis for an approach to March/February’s opening levels around 1590.0ish on the H4 scale.
The accuracy, completeness and timeliness of the information contained on this site cannot be guaranteed. IC Markets does not warranty, guarantee or make any representations, or assume any liability regarding financial results based on the use of the information in the site.
News, views, opinions, recommendations and other information obtained from sources outside of www.icmarkets.com.au, used in this site are believed to be reliable, but we cannot guarantee their accuracy or completeness. All such information is subject to change at any time without notice. IC Markets assumes no responsibility for the content of any linked site.
The fact that such links may exist does not indicate approval or endorsement of any material contained on any linked site. IC Markets is not liable for any harm caused by the transmission, through accessing the services or information on this site, of a computer virus, or other computer code or programming device that might be used to access, delete, damage, disable, disrupt or otherwise impede in any manner, the operation of the site or of any user’s software, hardware, data or property.
