
EUR/USD:
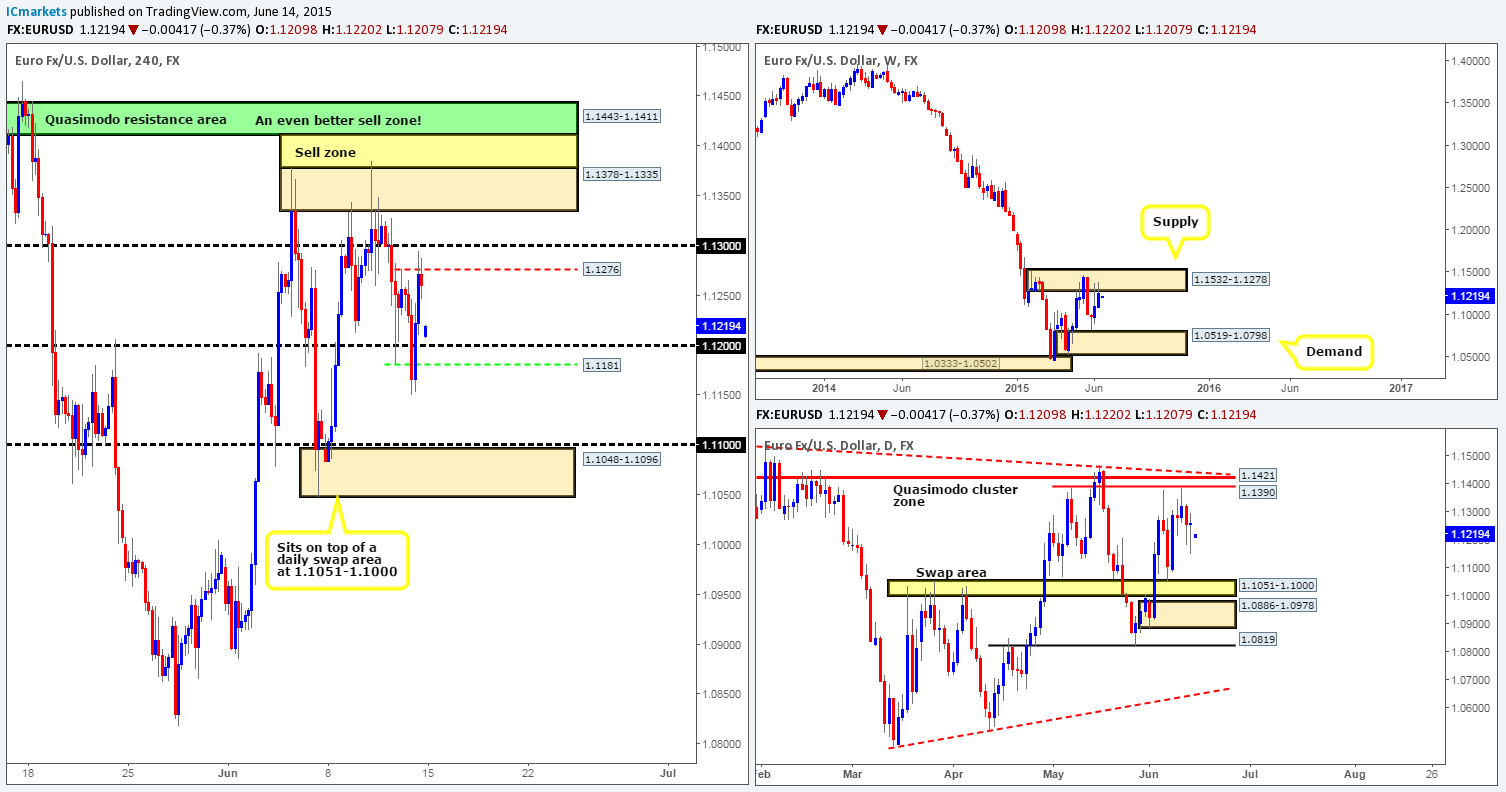
Weekly view: Last week’s trading action saw the Euro market close at 1.1261 – a mere seventeen pips below a clear area of weekly supply coming in at 1.1532-1.1278. Therefore, for anyone considering longs on this pair this week, you may want to take a note of this. This supply zone, at least to us anyway, is a very significant hurdle (held price lower since the 11th May) since if there’s a sustained break above this area, our long-term bias (currently short) on this pair will very likely shift north.
Daily view: From this angle, however, we can see that after price connected with the lower limits of a daily Quasimodo cluster zone at 1.1390/1.1421 (located relatively deep within the aforementioned weekly supply area) on Wednesday, price reverted into what we like to call a mid-range phase. Essentially, all this means is that price is currently trading in no man’s land between the aforementioned daily Quasimodo cluster zone and a daily swap area seen in yellow at 1.1051-1.1000.
4hr view: The open 1.1209 saw price gap down 52 pips, placing the Euro only a few pips above round-number support at 1.1200.
Large weekend gaps such as this tend to get filled pretty quickly. And we’re sure that most would agree that the obvious place to try and take a long is around 1.1200. That said though, if you look just below this number, you’ll see a 4hr Quasimodo support level in green at 1.1181. This is where we have placed our buy order – 1.11845 to be exact, with a stop set just below 1.11474. Round numbers tend to see fakeouts from time-to-time; this to us is a hunt for liquidity i.e. stops. What we’re essentially trying to do here is catch this stop hunt by entering below the psychological number. Our target, if our order gets filled, will be set just below the 4hr Quasimodo resistance level in red (1.1276) at 1.12698.
In addition to the above, we believe that between 1.1276 and the round number just above it at 1.1300 is a great place to look for (lower timeframe) confirmed sells into this market today if price should reach this high. The reason we say this is simply because of where price is located on the weekly timeframe at the moment (see above – weekly supply). If we time the entry short correctly, we could be in for a nice ride south this week down to at least the 4hr demand area coming in at 1.1048-1.1096, which sits just above the yellow daily swap area at 1.1051-1.1000.
Levels to watch/live orders:
- Buys: 1.11845 (Stop loss: 1.11474).
- Sells: 1.1276/1.1300 [Tentative – confirmation required] (Stop loss: dependent on where one confirms this area).
GBP/USD:
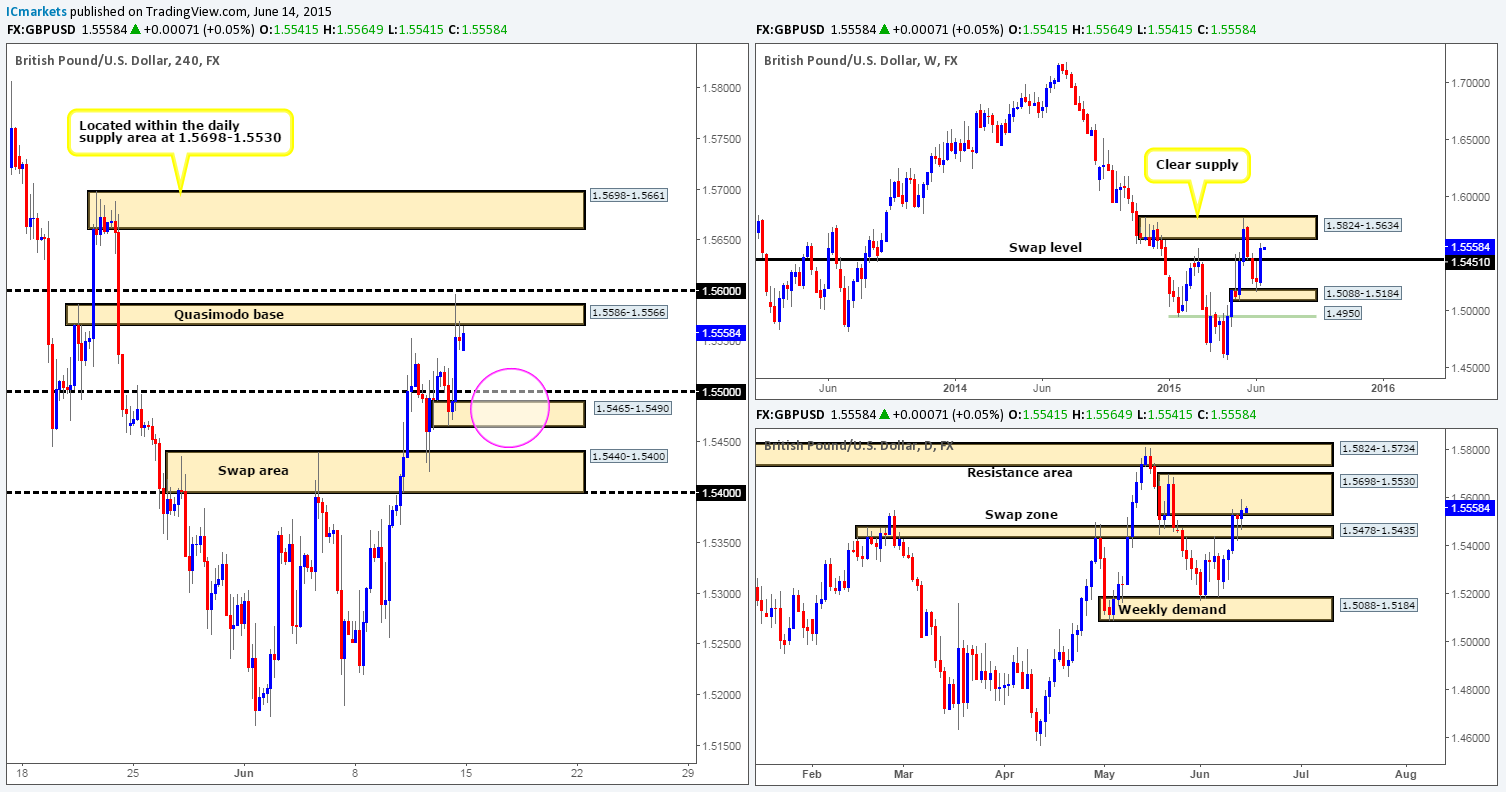
Weekly view – The latest coming in from this timeframe shows us that price printed a strong bull candle going into last week’s close 1.5551, consequently engulfing the previous two weekly bear candles. This move, as you can see, also forced price above a weekly swap level at 1.5451, which in turn likely opened the gates for the market to challenge the weekly supply area at 1.5824-1.5634 sometime this week.
Daily view: Throughout the course of Thursday and Friday’s trading, the buyers managed to hold out above the daily swap zone seen at 1.5478-1.5435. This is quite a feat considering the size of the monster daily supply area seen just above it at 1.5698-1.5530 (located just below the aforementioned weekly supply area). Should we see further buying take place this week, and the current daily supply zone taken out (which is a strong possibility considering last week’s close [see above – weekly view]), then the next objective to reach is the daily resistance area directly above at 1.5824-1.5734 (located deep within the aforementioned weekly supply area).
4hr view: Friday’s trading saw price aggressively rally going into the U.S session. This took out not only 1.5500, but also spiked above a 4hr Quasimodo resistance base sitting at 1.5586-1.5566 just missing 1.5600 by a couple of pips!
The open 1.5541 shows that no big changes took place over the weekend. At the time of writing, however, price is seen nibbling at the underside of the aforementioned 4hr Quasimodo base, which in our opinion, will likely repel the market today. This is what we hope anyway since there is a terrific buy zone (pink circle) located just below at the 4hr demand area at 1.5465-1.5490. If price reaches this low, and you’re also considering buys here, we would urge you to consider waiting for lower timeframe confirmation due to the fact that the weekly swap level 1.5451 is sitting just below – hence a fakeout is likely.
Below are the reasons why we consider our buy zone to be high probability:
- The round number sitting just above it at 1.5500 will be a natural magnet to price, and as we all know these barriers tend to see fakeouts. And this fakeout will play right into our zone of interest!
- The weekly timeframe indicates there is room for this market to move north (see above).
- The daily swap area at 1.5478-1.5435 is currently holding as support. Granted there is daily supply just above at 1.5698-1.5530 (located just below the weekly supply area at 1.5824-1.5634), but with the weekly timeframe in the position that it is, we’re not too concerned by this.
If all of the above plays out and we manage to find an entry long, our first take-profit target will obviously be dependent on how price approaches the 4hr demand zone. Overall though, we’d be looking to take full profits between 1.5600 and 1.5630, as we would then be very close to entering the aforementioned weekly supply area, and this is not really somewhere where one wants to be long the market!
Levels to watch/ live orders:
- Buys: 1.5465-1.5490 [Tentative – confirmation required] (Stop loss: 1.5459).
- Sells: Flat (Stop loss: N/A).
AUD/USD:
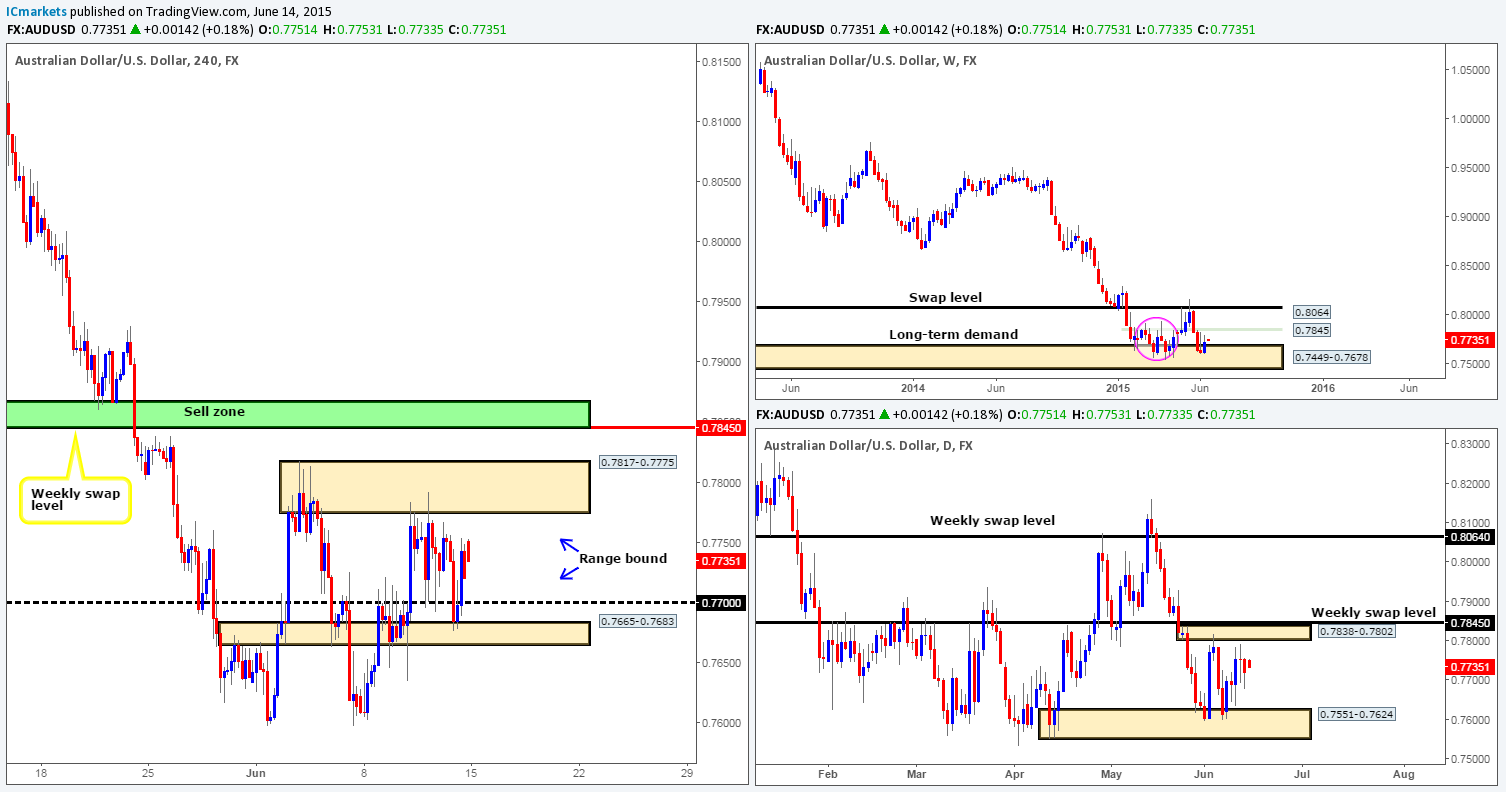
Weekly view – Last week saw buying interest come into the market from within the weekly demand area at 0.7449-0.7678. In the event that the buyers can continue with this intensity going into this week, we see very little stopping price from connecting with the minor weekly swap level at 0.7845. However, judging by the sloppy reaction seen (pink circle – 02/02/15-06/04/15) between these two aforementioned weekly areas a few months earlier, things could potentially get messy here once again before we see any decisive move take place. From a long-term perspective, nonetheless, the trend direction on this pair is still very much south in our opinion, and will remain this way until we see a convincing break above 0.8064.
Daily view: From the pits of the daily scale, it appears that price has begun to chisel out a consolidation zone between a small daily supply area at 0.7838-0.7802 (positioned just below a minor weekly swap level at 0.7845), and a daily demand area coming in at 0.7551-0.7624.
4hr view: Last Thursday, we mentioned that the Aussie pair appeared to have entered into a phase of consolidation on the 4hr timeframe between the 4hr supply area at 0.7817-0.7775, and a round number 0.7700. This 4hr range saw what we like to call a perfect fakeout. Check out how it how price faked below 0.7700 into a near-term 4hr swap area coming in at 0.7665-0.7683 – just beautiful. Well done to anyone who managed to catch this move!
The open 0.7751 saw price gap up 31 pips, which from a technical standpoint has not made much of a difference on the 4hr timeframe as price still remains range bound.
Much like Friday’s report, trading in between this 75-pip range is certainly a possibility today (potential buys: 0.7705 sells: 0.7770). Nonetheless, we would strongly advise only doing so once you see some sort of confirmation signal from the lower timeframes, since as we just saw, fakeouts are so very common within ranging environments such as this. Whether or not this market remains range bound for the entire week is very difficult to say. What we will say though is considering where price is located on the higher timeframe picture (see above) at the moment; we feel price will eventually break out north from this range. This, as you can see on the 4hr timeframe, would likely force price to collide with the weekly swap level 0.7845 – a perfect sell zone (green area: 0.7867/0.7845). We firmly believe that this area will at the very least likely see a bounce, and in preparation for this, our team has placed a pending sell order just below this zone at 0.7842 with a stop set above at 0.7875.
Levels to watch/ live orders:
- Buys: 0.7705 [Tentative – confirmation required] (Stop loss: 0.7656).
- Sells: 0.7770 [Tentative – confirmation required] (Stop loss: 0.7821) 0.7842 (Stop loss: 0.7875).
USD/JPY:
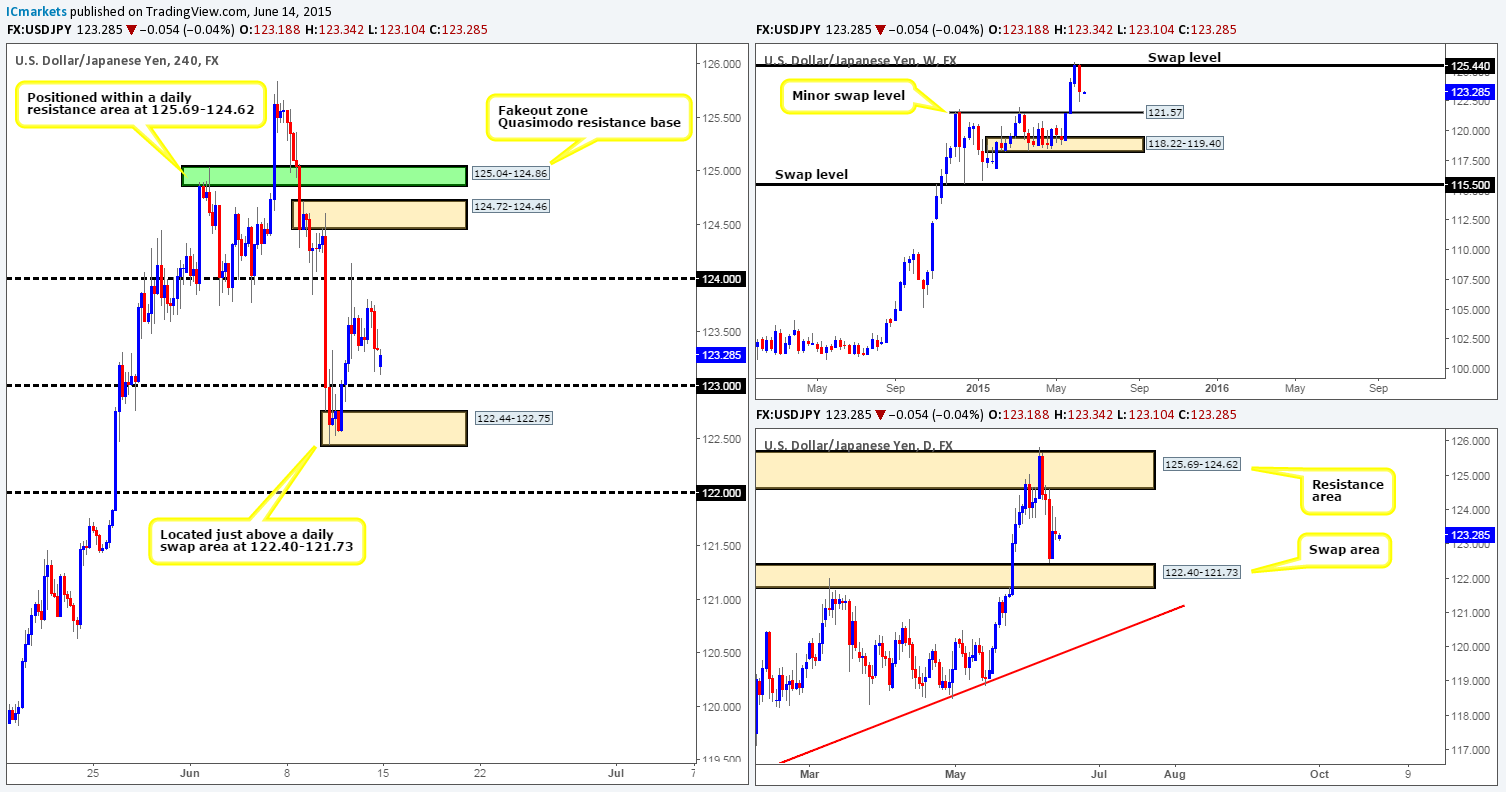
Weekly view – Last week’s activity saw the USD/JPY sell off from a weekly swap level at 125.44, consequently wiping out any gains accumulated the week before last. On the assumption that the sellers can continue with this tempo coming into this week, we believe there’s a very good chance that price will greet the minor weekly swap level seen at 121.57. Despite this recent decline in value, however, the long-term uptrend on this pair is still very much intact, and will remain that way in our opinion until the weekly swap level 115.50 is consumed.
Daily view: The daily timeframe on the other hand, shows that buying interest came into the market last Thursday from a just above a long-term daily swap area at 122.40-121.73. This barrier, as you can probably see, remains a key obstacle to a move towards the aforementioned minor weekly swap level sitting just below it.
4hr view: From this angle, we can see that price gapped down 15 pips at the open 123.18. This, from a technical perspective made very little difference on the 4hr timeframe.
Taking into account the somewhat mixed signals we’re receiving from the higher timeframes at the moment (see above in bold), it, as far as we can see, is very difficult to judge direction. Therefore, until we see more conducive higher timeframe action, the best we can do today and possibly into the week is watch levels of interest for lower timeframe confirming price action, and trade them accordingly.
Buy zones we have on our watch list are as follows:
- The round number 123.00.
- The 4hr demand area at 122.44-122.75 (located just above the aforementioned daily swap area).
Sell zones we have on our watch list are as follows:
- The round number 124.00.
- The 4hr supply area coming in at 124.72-124.46 (located just below the daily resistance area at 125.69-124.62). Something to note regarding this 4hr supply zone is the 4hr Quasimodo resistance base seen just above it. Keep a close eye on this area as fakeouts above supply (in this case) into obvious Quasimodo bases are very common.
Levels to watch/ live orders:
- Buys: 123.00 [Tentative – confirmation required] (Stop loss: dependent on where one confirms this level) 122.44-122.75 [Tentative – confirmation required] (Stop loss: 122.38).
- Sells: 124.00 [Tentative – confirmation required] (Stop loss: dependent on where one confirms this level) 124.72-124.46 [Tentative – confirmation required] (Stop loss: 125.08).
USD/CAD:
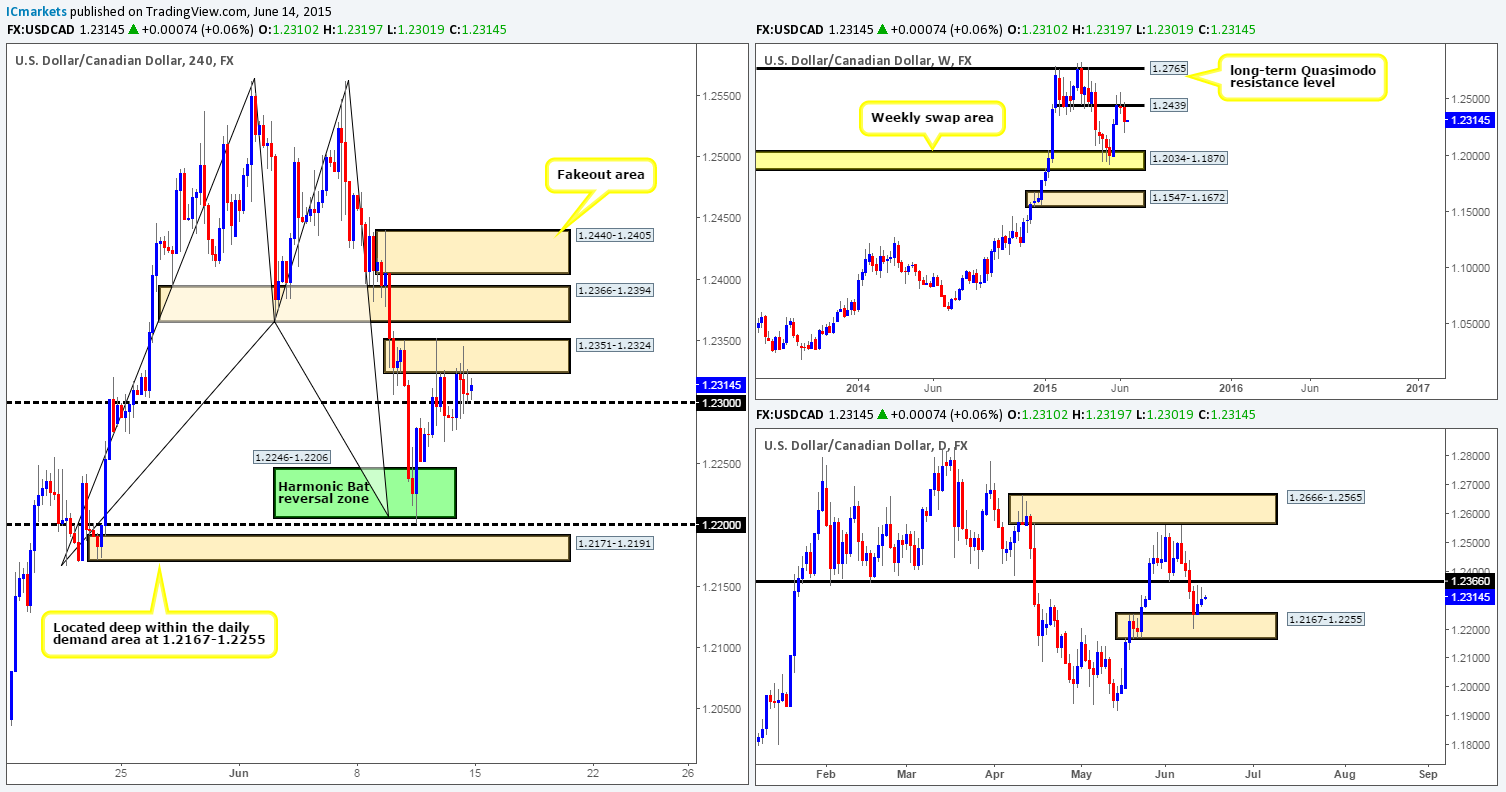
Weekly view – During last week’s trading, it is clear to see that the sellers were the more dominant force in the market. Price sold off from a weekly swap level at 1.2439 forcing the USD/CAD to close at 1.2307. Despite the fact that this market is now in the red so to speak, our long-term bias on this pair remains long, and it will only be once/if we see a break below the weekly swap area at 1.2034-1.1870 would our present bias likely shift.
Daily view: The daily timeframe on the other hand shows that buyers begun defending a daily demand barrier at 1.2167-1.2255 from Thursday onwards last week. Nonetheless, until we see a clean break above the immediate daily swap level at 1.2366, it is difficult for us to be bullish on this pair going into this week. It will be interesting to see what the 4hr timeframe has to say…
4hr view: Following last week’s reaction from the 4hr Harmonic Bat reversal zone seen in green at 1.2246-1.2206 (located deep within the aforementioned daily demand area), price has come to a halt. The 4hr supply area at 1.2351-1.2324 has been holding the market lower now since Thursday.
Going forward, we can see that price remained unaffected during the weekend as the market opened a mere three pips above Friday’s close (1.2307) at 1.2310. With regards to today’s trading, we do not see any immediate opportunities, since price is currently confined between the round number support at 1.2300 and the aforementioned 4hr supply area. An area we are interested in, however, is the 4hr swap zone seen just above at 1.2366-1.2394. The reason for why simply comes from looking at the higher timeframe structure. This 4hr swap zone lines up nicely with the daily swap level 1.2366, and assuming that this 4hr area holds as resistance (if price reaches this high of course), the sell off from here could be large considering we have just seen price sell off from a weekly swap level at 1.2439. However, even though we’re relatively confident a bounce at the very least will be seen from here, it does not mean we’re confident enough to set a pending sell order. Swap areas do tend to fakeout on occasion, and as such we have to be prepared for a spike above this 4hr swap zone into a very obvious 4hr supply area seen at 1.2440-1.2405 (labeled fakeout area). If a fakeout does take place, this will likely be where it will likely end. Therefore in effect, one could simply place a pending short order below the 4hr swap area at 1.2366-1.2394 and a stop above the 4hr supply (fakeout) zone we just mentioned. As you can see though, this would be an incredibly large stop, waiting for lower timeframe confirming price action would likely lessen the stop thus increase the risk/reward on the trade.
Levels to watch/ live orders:
- Buys: Flat (Stop loss: N/A).
- Sells: 1.2366-1.2394 [Tentative – confirmation required] (Stop loss: 1.2443).
USD/CHF:
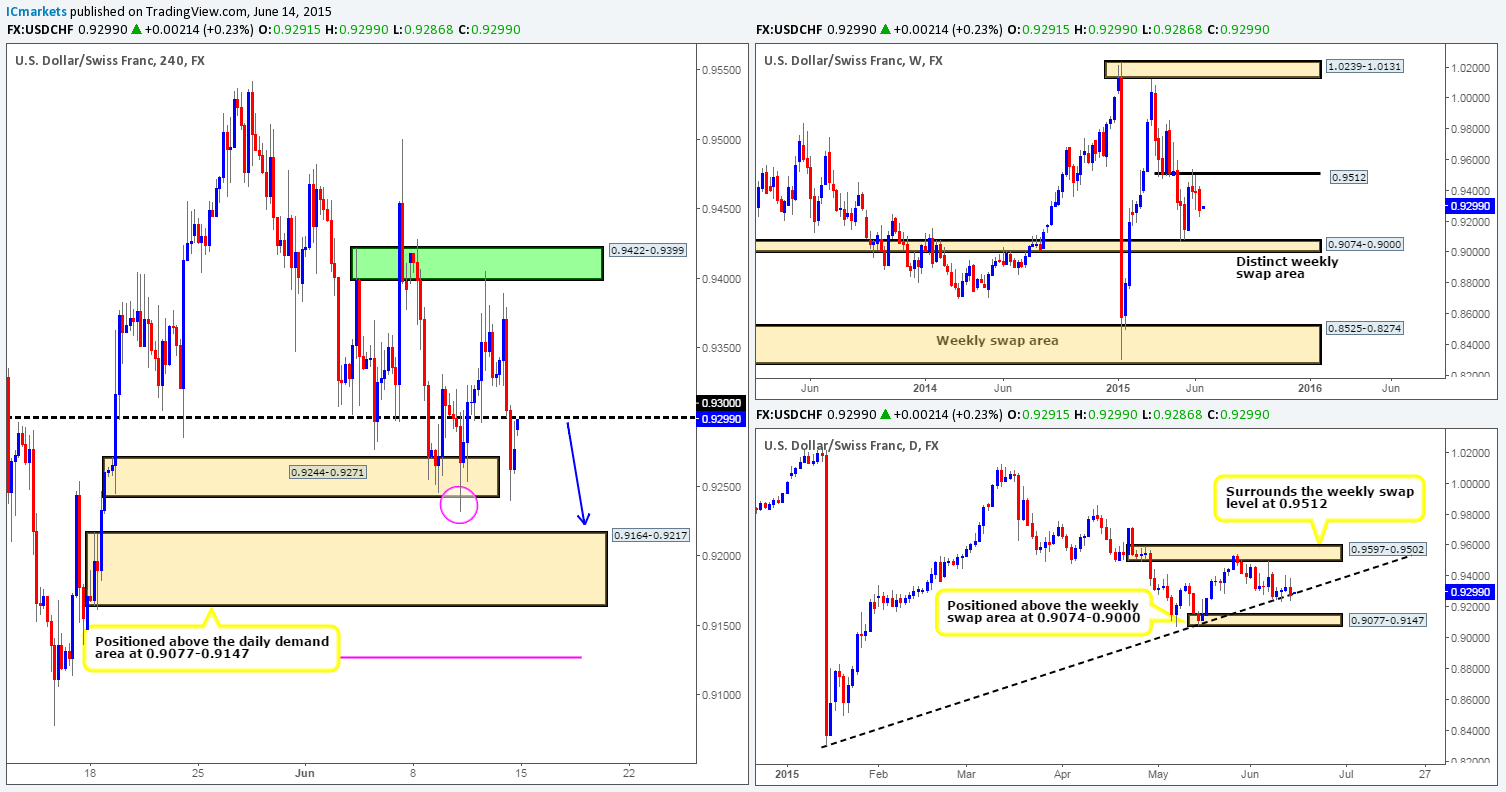
Weekly view – Following the rebound seen from the weekly swap level at 0.9512, price extended lower last week closing near its lows at 0.9277. In the event that the buy-side liquidity remains weak in this market, it is likely we’ll see price shake hands with the weekly swap area seen below at 0.9074-0.9000 sometime this week.
Daily view: For the best part of last week, we saw the buyers struggling to hold out above the daily trendline level taken from the low 0.8299. In the event that we see this limit taken out this week (which we think is highly possible), this would likely attract further selling down towards the daily demand area seen at 0.9077-0.9147 (located just above the aforementioned weekly swap area).
4hr view: Price heavily sold off during Friday’s sessions, which as you can see, aggressively took out round number support at 0.9300 and once again spiked below the 4hr demand area seen at 0.9244-0.9271.
Moving forward, we can see that price gapped up 14 pips at the open 0.9291. As a result, this placed price right around a sell zone – the round number 0.9300. The reason why we believe this to be a sell zone is as follows:
- A spike below (pink circle) the 4hr demand area at 0.9244-0.9271 likely consumed the majority of buyers within this zone, thus potentially clearing the path south down towards 4hr demand at 0.9164-0.9217 (located just above the aforementioned daily demand area) – a fantastic target for any shorts taken at 0.9300.
- Very little support seen in the way of price on the weekly scale.
- Price is showing weakness around the daily trendline level extended from the low 0.8299, thus a break lower is imminent in our opinion.
- Price will naturally want to fill the weekend gap; hence a sell off from 0.9300 is even more likely.
With everything taken into consideration, we would strongly advise against entering short at 0.9300 using a pending order (lower timeframe confirmation here is a must for us), since price could effectively ignore this number and head back up to the origin – the 4hr Quasimodo base in green at 0.9422-0.9399 (pending sell order still remains in position here at 0.9395).
Levels to watch/ live orders:
- Buys: Flat (Stop loss: N/A).
- Sells: 0.9300 [Tentative – confirmation required] (Stop loss: dependent on where one confirms this level) 0.9395 (Stop loss: 0.9505).
US 30:
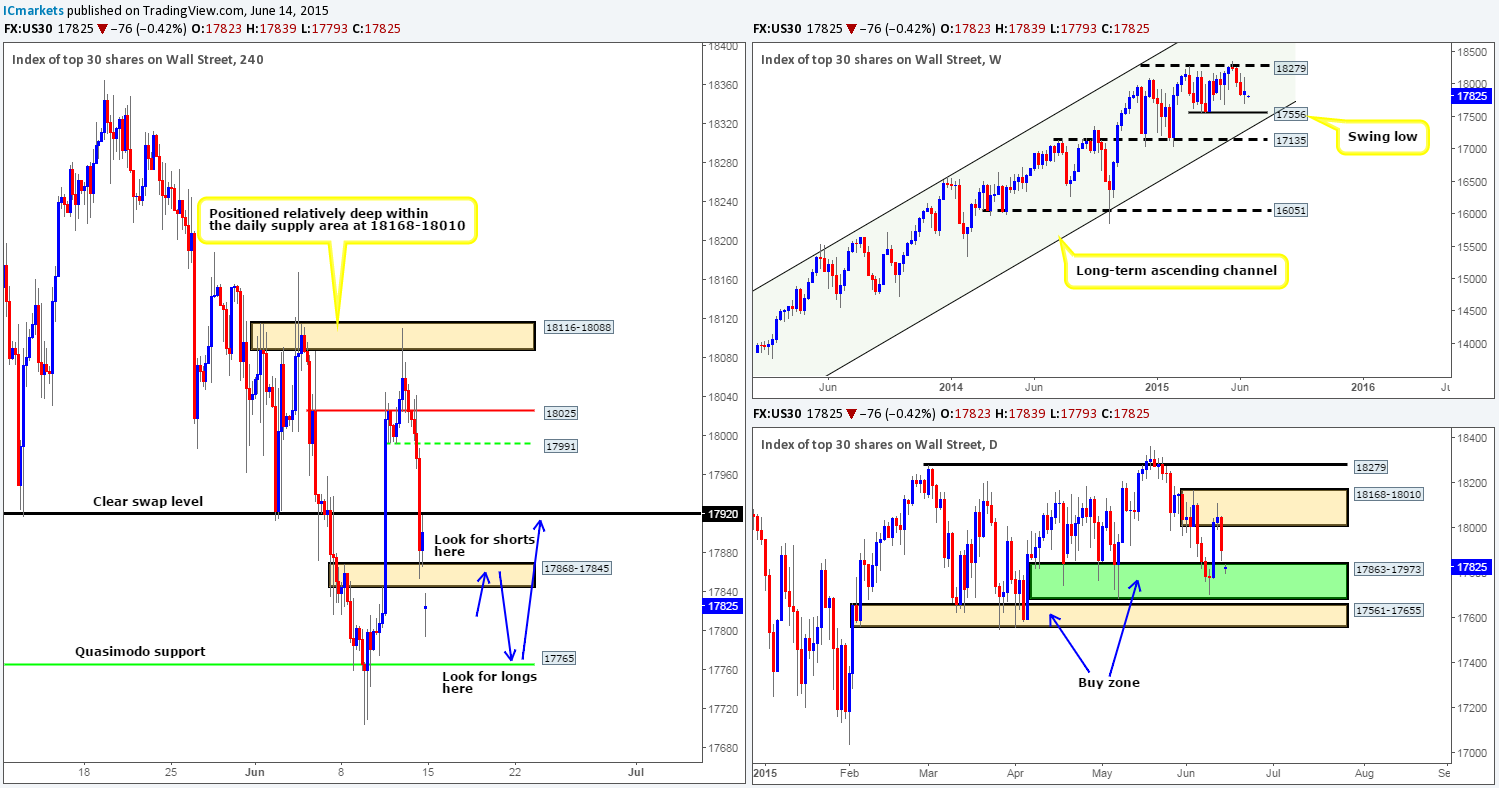
Weekly view – Following the two-week sell off from 18279, the buyers finally made an appearance last week around the 17703 mark, consequently printing a poorly formed weekly indecision candle going into the close 17901. At the time of writing though, it is very difficult to say which way the market may head this week. It could rally back up to test 18279, or it could just as well continue south down towards the weekly swing low 17556. It will be interesting to see what the lower timeframes have to offer…
From a longer-term perspective, however, the overall uptrend on this index is still very strong, and will remain this way in our opinion until we see a convincing push below 16051.
Daily view: Last week’s action shows that the buyers and sellers were seen trading in between a daily supply area at 18168-18010, and a daily buy zone seen in green at 17863-17973. Now, from this angle, we can see a cluster of support below current price – the daily buy zone we just mentioned and also another daily buy zone seen just below this one coming in at 17561-17655 (surrounds the aforementioned weekly swing low). Therefore, from looking at only the weekly and daily timeframes at the moment, our team is swaying more to longs at the moment.
4hr view: Friday’s descent, as you can see, took out a 4hr swap level at 17920 and slammed into a 4hr swap area at 17868-17845 going into the close 17901.
Today’s open 17823, however, saw price gap down 78 points, consequently engulfing this 4hr swap zone. There is a good chance that the weekend gap will be filled before today day is out. As such, we’re going to keep a close eye on the recently consumed 4hr swap area for potential intraday shorting opportunities (waiting for lower timeframe confirmation is recommended here). Nonetheless, the most we see price declining from here is down to the 4hr Quasimodo support barrier coming in at 17765 (located deep within the daily buy zone mentioned above at 17863-17973). And it would be from this level that we’d exit any shorts we may have in play and begin looking for confirmed long entries into the market, since based on where price is located on the higher timeframes at the moment (see above), this is the direction this market will likely take this week.
Levels to watch/ live orders:
- Buys: 17765 [Tentative – confirmation required] (Stop loss: dependent on where one confirms this level).
- Sells: 17868-17845 [Tentative – confirmation required] (Stop loss: 17874).
XAU/USD (Gold)
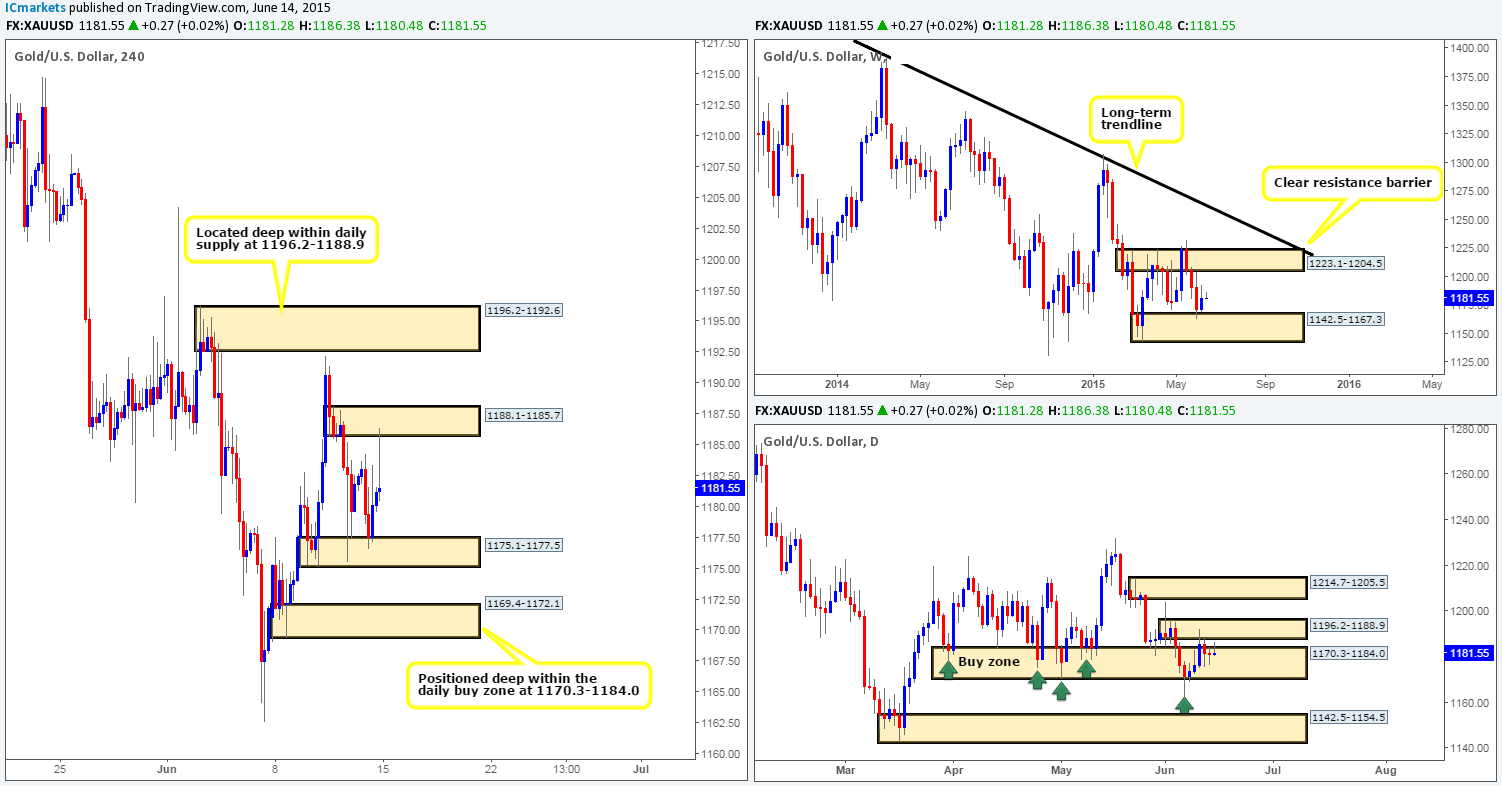
Weekly view – Relatively moderate buying interest came into the market last week from the upper limits of a weekly demand area sitting at 1142.5-1167.3, which resulted in price forming a weekly inside candle pattern going into the close 1181.2. From a long-term perspective, however, gold is still trending south in our opinion, and It will only be once/if we see a close above the weekly trendline extended from the high 1488.0 would we begin to feel that this market may be reversing.
Daily view: This past week’s action saw the buyers and sellers battling for position between two compact daily areas – a daily buy zone at 1170.3-1184.0, and a small daily supply area at 1196.2-1188.9. Should we see a break below the aforementioned daily buy zone this week, the next objective to reach will likely be the daily demand area coming in at 1142.5-1154.5 (located deep within the aforementioned weekly demand area). On the other hand, if a break above the aforementioned daily supply area takes place, the path north will likely be free up to a daily supply area seen at 1214.7-1205.5.
4hr view: The open 1181.2 saw gold aggressively rally and connect with a near-term 4hr supply area seen at 1188.1-1185.7, which as you can see has repelled the market nicely.
At current price, 1181.5, we do not see any immediate trading opportunities, since as far as we’re concerned, price action is now trading mid-range between the aforementioned 4hr supply area and a 4hr demand area below at 1175.1-1177.5. Looking for trades at these two zones is certainly a viable option today; nonetheless, we would only trade these areas with lower timeframe confirmation. Something else to keep in mind this week is the 4hr areas seen outside of these two zones. The 4hr supply area at 1196.2-1192.6 (located deep within daily supply at 1196.2-1188.9), and 4hr demand at 1169.4-1172.1 (positioned deep within the daily buy zone mentioned above at 1170.3-1184.0) are certainly zones to have noted on your watch list this week for potential buying and selling opportunities, since as you can see, they are encompassed by daily timeframe areas of supply and demand (see above).
Levels to watch/ live orders:
- Buys: 1175.1-1177.5 [Tentative – confirmation required] (Stop loss: 1174.5) 1169.4-1172.1 [Tentative – confirmation required] (Stop loss: 1168.9).
- Sells: 1188.1-1185.7 [Tentative – confirmation required] (Stop loss: 1188.4) 1196.2-1192.6 [Tentative – confirmation required] (Stop loss: 1196.4).