
A note on lower timeframe confirming price action…
Waiting for lower timeframe confirmation is our main tool to confirm strength within higher timeframe zones, andhas really been the key to our trading success. It takes a little time to understand the subtle nuances, however, as each trade is never the same, but once you master the rhythm so to speak, you will be saved from countless unnecessary losing trades. The following is a list of what we look for:
- A break/retest of supply or demand dependent on which way you’re trading.
- A trendline break/retest.
- Buying/selling tails – essentially we look for a cluster of very obvious spikes off of lower timeframe support and resistance levels within the higher timeframe zone.
- Candlestick patterns. We tend to only stick with pin bars and engulfing bars as these have proven to be the most effective.
EUR/USD:
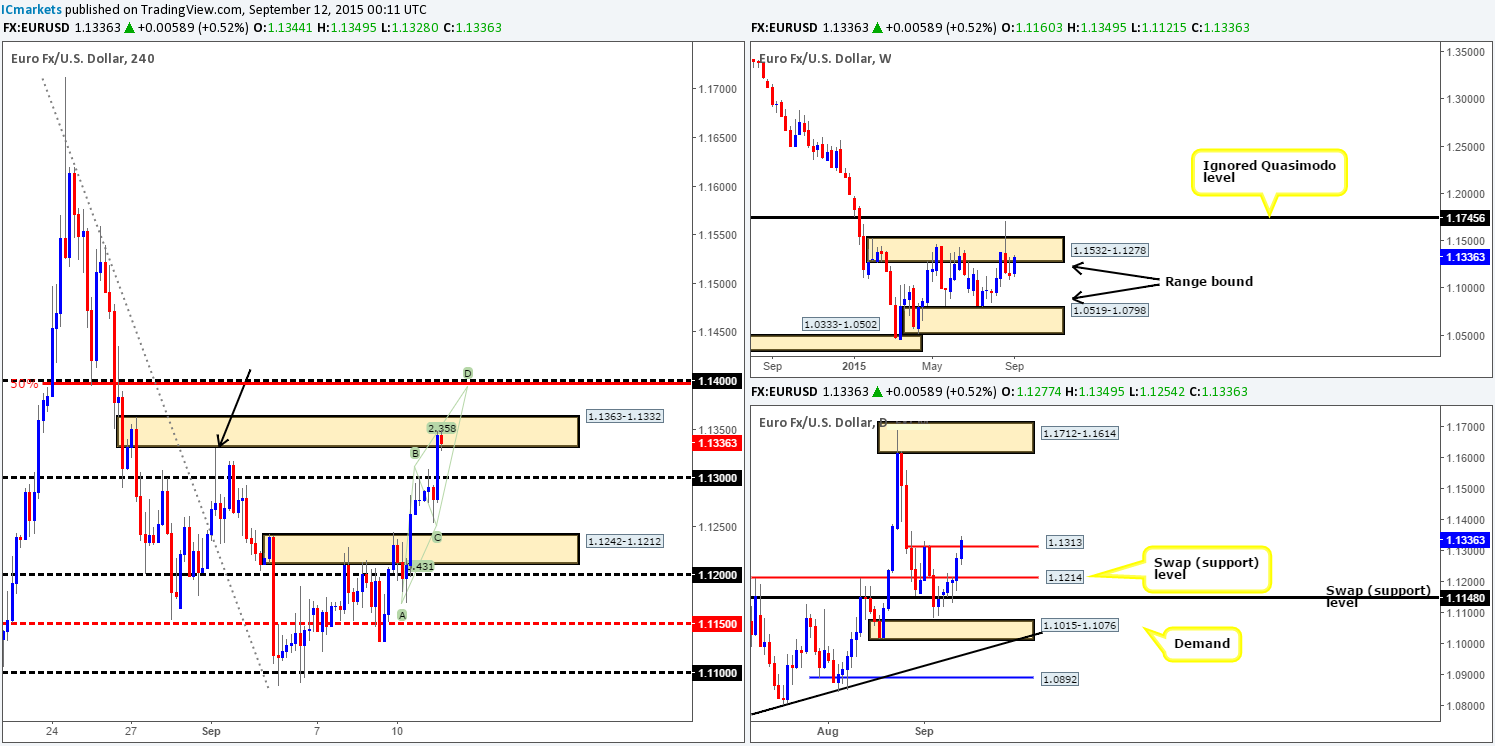
Weekly view:The EUR/USD edged higher last week, gaining close to 200 pips into the close 1.1336. Admittedly, we were expecting more selling due to price not only positioned just below supply at 1.1532-1.1278, but also because of the recent bearish selling wicks. Instead of this renewed buying interest was seen, bringing this market back into the jaws of the aforementioned supply. Could this lack of selling interest here be a sign that things are becoming more positive for the EUR currency? Let’s see what the lower timeframes have to say on the matter…
Daily view:Daily action shows that this market did not really see much activity until Thursday/Friday. Price broke above two key swap resistance levels seen at 1.1214/1.1313. Friday’s close, however, was very significant to our team, since assuming that the buyers manage to maintain their position above 1.1313 this week, we see very little resistance overhead until supply at 1.1712-1.1614.
4hr view: Coming down into the pits of the 4hr timeframe, we can see that price hesitated around psychological resistance 1.1300 for the best part of the London morning session on Friday. It was only once the U.S traders joined in the party did we see the EUR surge higher, taking out 1.1300 and connecting with a 4hr supply area at 1.1363-1.1332. Trade concluded the week with a slight bearish reaction from this zone.
With the above in mind, do we believe the current 4hr supply zone is worth shorting from today? In all honesty, we would not feel comfortable selling from here. The reasons for why is that we’re quite concerned about the 4hr wick seen on the 01/09/15 at 1.1331. Although this wick did not actually touch this area (missed by a pip or two) it was enough to weaken offers in our opinion. Secondly, there is a far more attractive sell zone sitting just above this area comprising of psychological resistance at 1.1400, 50% Fibonacci resistance at 1.1398 and a potential AB=CD completion point at 1.1397.
Therefore, to sum up, we’re going to be eyeing 1.1400 for a bounce south today/tomorrow. The reason we’re only expecting a bounce from here simply comes down to what we’ve been seeing on the higher timeframe structures (see above). Once, or indeed if, price breaks above 1.1400, this will be our cue to begin looking for longs into this market on the retest since there is ample roomabove this figure.
Levels to watch/live orders:
- Buys:Watch for offers to be consumed around 1.1400 and then look to enter on any retest seen at this number (confirmation required).
- Sells: 1.1400 [Tentative – confirmation required] (Stop loss: dependent on where one confirms this level).
GBP/USD:
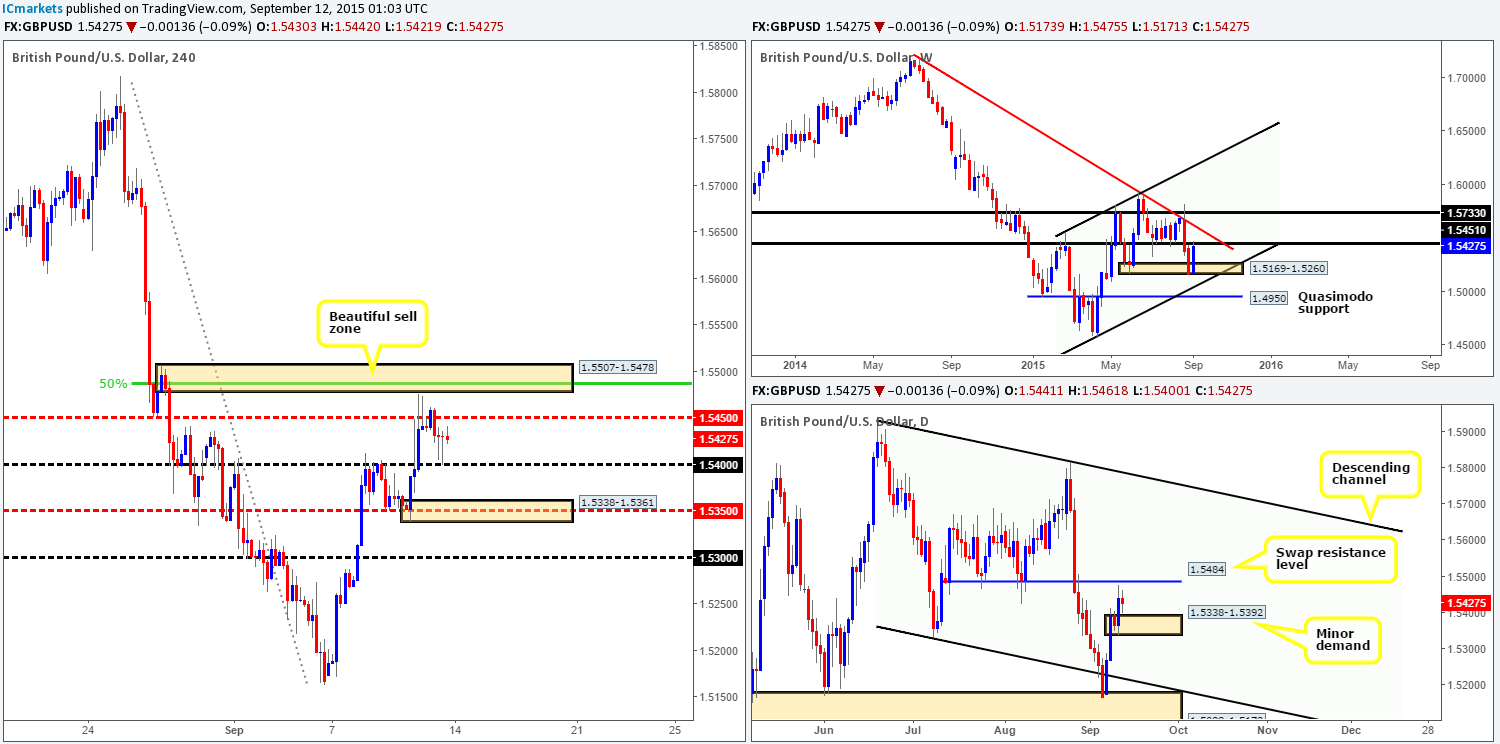
Weekly view:Following a two-week slide, renewed buying interest came into this market from demand at 1.5169-1.5260, increasing its value by 260 pips at the close 1.5427. This move not only erased losses from the prior week’s trade, but also closed within shouting distance of a swap resistance level seen at 1.5451.
Daily view: Similar to the weekly timeframe, price closed the week out in close proximity to a swap resistance level at 1.5484. However, as you can see from the daily chart, there is also a minor demand area lurking just below current price at 1.5338-1.5392 which could potentially be problematic for sellers. With an indecision candle forming during Friday’s trade in between the two above said areas, direction is not really clear until one of these zones are violated.
4hr view: From this angle, Friday’s trade was relatively quiet in comparison to Thursday’s more upbeat sessions. Price sold off from the mid-level number 1.5450 down to a well-bid psychological support 1.5400, which, as a result, saw two back-to-back bullish pins form.
Assuming that the higher timeframe resistances hold firm this week (see above), we do not see price getting above supply at 1.5507-1.5478. Not only has this beauty got higher timeframe backing, it also converges with the psychological resistance 1.5500 and a 50% Fibonacci resistance level at 1.5485. As such, we still believe this to be an awesome area to look for shorts this week.
Levels to watch/ live orders:
- Buys: Flat (Stop loss: N/A).
- Sells: 1.5507-1.5478 [Tentative – confirmation required] (Stop loss: dependent on where one confirms this area).
AUD/USD:
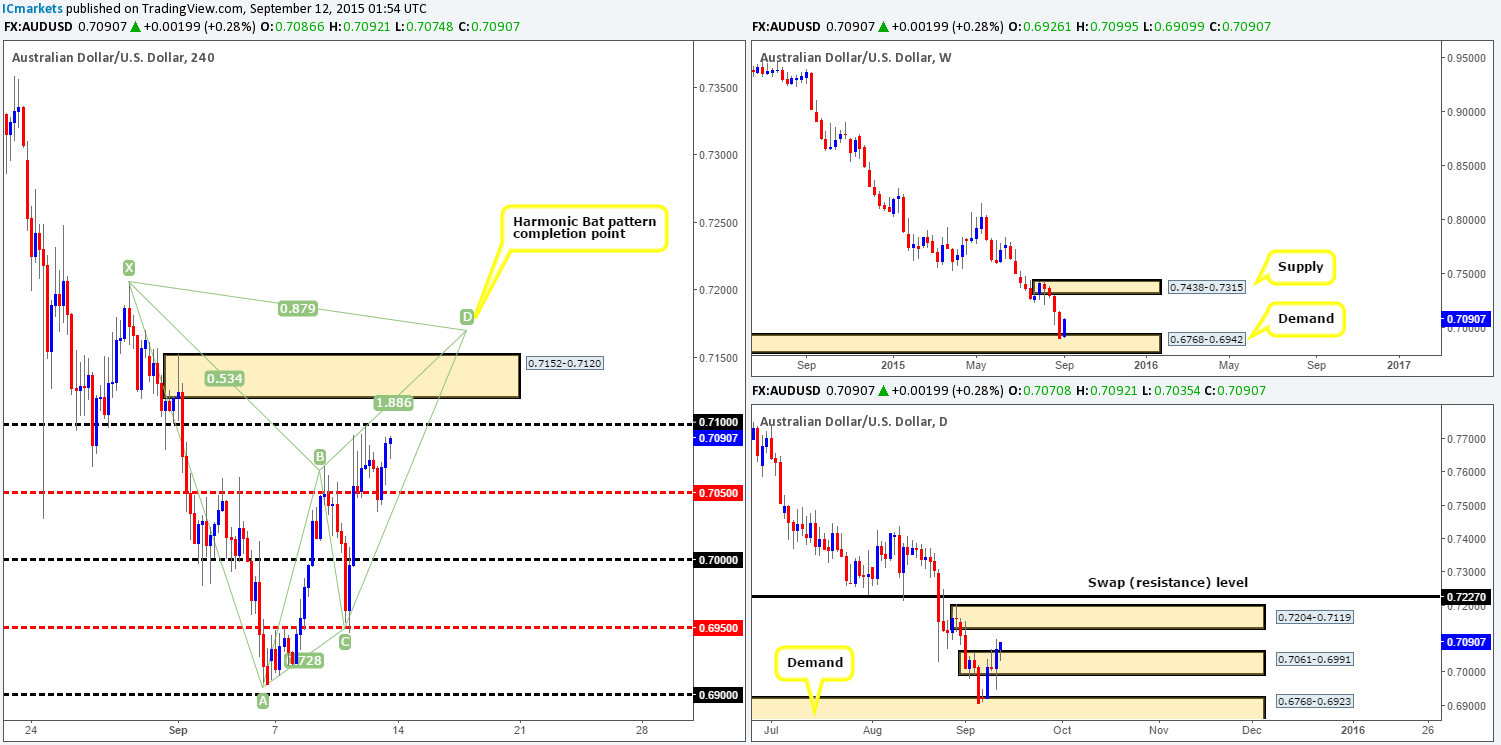
Weekly view: A stronger than expected rebound was seen from demand coming in at 0.6768-0.6942 last week, taking back 70% of the prior week’s losses and accumulating gains of over 180 pips into the close 0.7090. In the event that the buyers manage to sustain this momentum going into the week, we see little stopping price from advancing up to supply at 0.7438-0.7315.
Daily view: The recent buying on this pair pushed price above near-term supply at 0.7061-0.6991. However, it was only once price successfully retested this barrier as support on Friday was we convinced that the majority of offers were cleared out from here. Consequent to this, we firmly believe the path north is now freeup to supply drawn from 0.7204-0.7119.
4hr view: Overall, Friday’s trade was relatively dull. Price, once again, drew support from the mid-level number 0.7050 and spring boarded itself north reaching highs of 0.7092 on the day. Due to this lackluster performance, much of Friday’s analysis on this pair still holds weight…
With the Aussie holding firm above 0.7050 support, we believe we may see the D-leg of a Harmonic Bat pattern terminating around the 0.7170 area complete this week. This is certainly somewhere we’d consider selling if price reaches this high, since it sits within a daily supply zone coming in at 0.7204-0.7119. We also like the way this Harmonic pattern completes just above the supply area at 0.7152-0.7120 – this has fakeout written all over it!
However, even if price does reach our Harmonic zone this week, we still need to tread carefully. Let’s not forget that even though price is currently trending south, we have recently seen buying pressure from weekly demand at 0.6768-0.6942. This warrants caution. Unless we are able to spot lower timeframe selling confirmation around this Harmonic sell zone, we’ll quite happily pass on the trade, since getting caught on the wrong side of weekly flow will not do your account any favors!
Levels to watch/ live orders:
- Buys: Flat (Stop loss: N/A).
- Sells: 0.7071 [Tentative – confirmation required] (Stop loss: dependent on where one confirms this level).
USD/JPY:
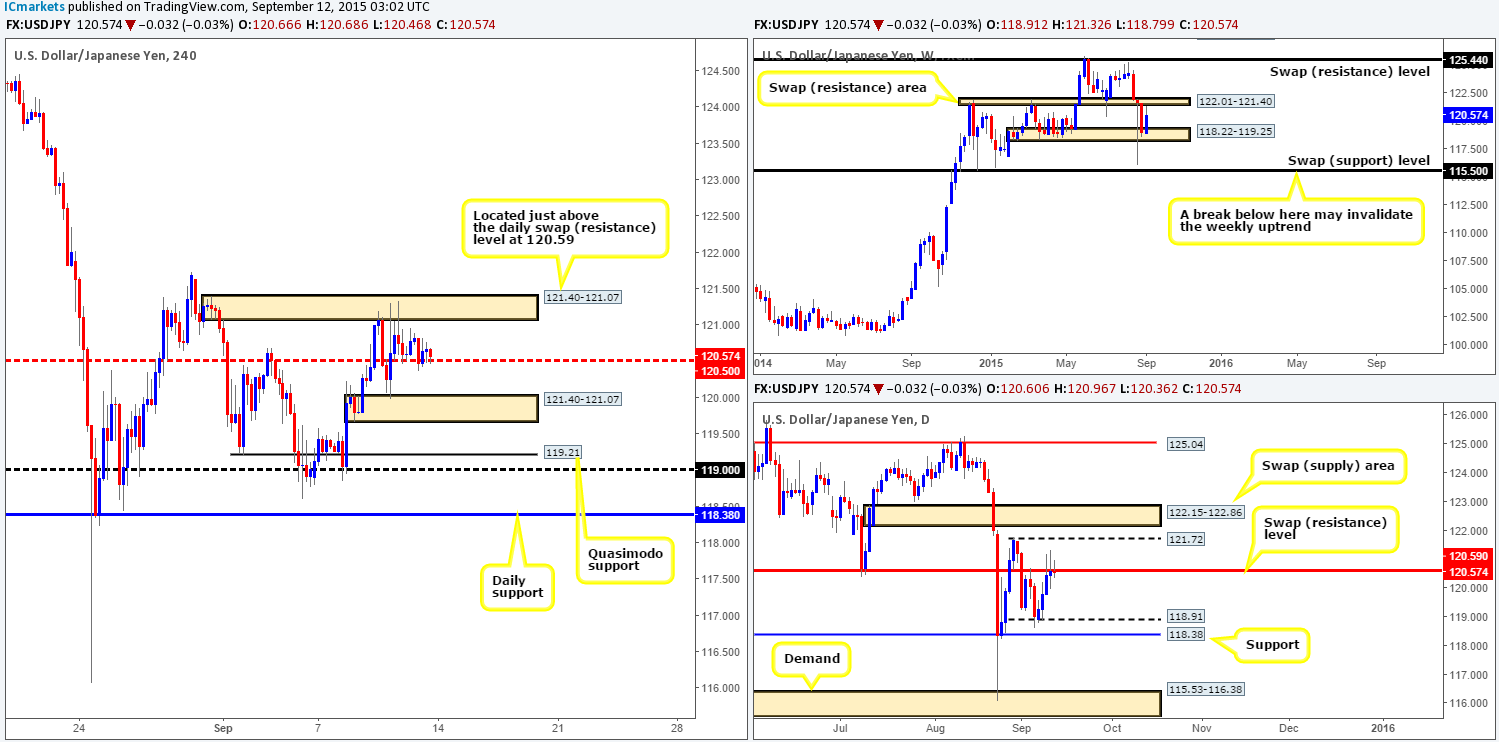
Weekly view: Although the USD/JPY increased a little over 150 pips last week, price still closed (120.57) mid-range between a swap resistance area at 122.01-121.40 and a support base coming in at 118.22-119.25. This, at least to us, makes it very difficult to judge possible direction going into this week’s trade. It will be interesting to see what the lower timeframe have to offer…
Daily view: Turning our attention to the daily timeframe reveals that from Wednesday onwards, price spent much of its time nibbling at offers around a swap resistance level taken from 120.59. Price actually ended the week closing two pips below this barrier. Our team likes the collection of selling wicks above this number, but dislikes the candle closes – it just doesn’t emphasize bearish strength to us unfortunately.
Above this level, 121.72 continues to be the area to watch, followed closely by the swap supply zone at 122.15-122.86. To the downside, however, we do not see anything of interest until the 118.19/118.38 region.
4hr view: Other than the EUR/USD, the GBP/USD, AUD/USD and now the USD/JPY all had relatively quiet sessions on Friday. Even though price remained well-bid above the mid-level number 120.50, there was little noteworthy buying seen from here.
At the time of writing, we see very little room for this market to move. To the upside, we have near-term supply falling in at 121.40-121.07 (located just above the daily swap [resistance] level at 120.59). Below 120.50, however, there’s a near-term 4hr demand seen at 121.40-121.07.
So, let’s see what we have here (see above for levels):
- Weekly action trading mid-range.
- Buyers and sellers indecisive around a daily swap (resistance) level.
- Little room being seen on the 4hr timeframe for price to move at present.
Therefore, given the points made above, we believe it’s best to remain on the sidelines today and wait for clearer price action to present itself.
Levels to watch/ live orders:
- Buys: Flat (Stop loss: N/A).
- Sells:Flat (Stop loss: N/A).
USD/CAD:
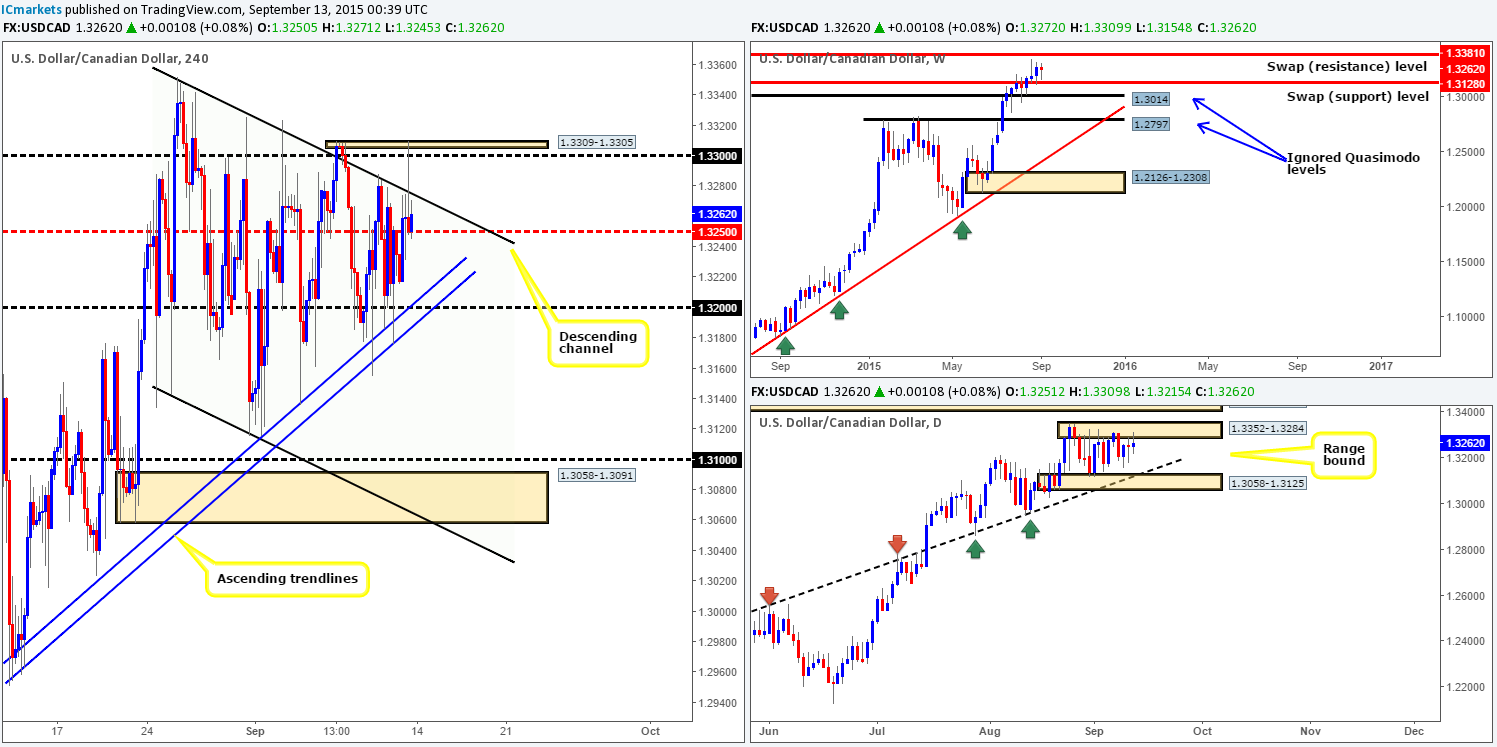
Weekly view: On the whole, the USD/CAD remained relatively unchanged at the close 1.3262 last week. However, what we did see from this viewpoint was a neat-looking buying tail that just missed connecting with 1.3128 – a swap support level. Consequent to this, we consider this week to still be positive even though around 15 pips of value was lost by the weeks end. With the trend still firmly pointing north, the next upside target to be aware of this week falls in at 1.3381 – a swap resistance level.
Daily view:Similar to last week’s report, there’s not really much to say about this timeframe other than the pair is still considered to be range bound between demand at 1.3058-1.3125 and supply at 1.3352-1.3284. We will say this though; price is currently trading within the upper band of this consolidation, so buyers beware!
4hr view: We have to be honest here. After the market closed on Friday, we were a little bummed-out. Cast your minds back to Thursday’s report http://www.icmarkets.com/blog/thursday-10th-september-keep-an-eye-on-the-gbp-markets-around-11am-gmt-traders/. Check out how we mentioned to watch for a fakeout up to the small supply zone at 1.3309-1.3305, and look what happened late Friday! We completely missed this entire move! The stop would have been no more than fifteen pips, and the reward was well over fifty pips – what a shame. Well done to any of our readers who managed to catch this move!
As a result of price selling off from here, we can see that this market has been forced back within the limits of a 4hr descending channel (1.3352/1.3142). This, as can be seen from the 4hr chart, has placed the buyers and sellers in very cramped trading conditions today between the mid-level number 1.3250 and the descending channel resistance.
Just so that we’re all on the same page here, let’s just recap a little:
- The weekly chart, in our opinion, resembles bullish strength from the top-side of a swap support barrier at 1.3128.
- Daily action, however, shows price lodged beneath supply at 1.3352-1.3284.
- 4hr timeframe is, as we just mentioned, now tightly confined between 1.3250 and the upside of the 4hr descending channel.
Given the somewhat conflicting signals we’re seeing from the weekly and daily timeframes at the moment, and the somewhat lack of space to move on the 4hr scale, we are going to remain on the sidelines today and see what occurs. Overall though, we do believe price is eventually going to be heading higher, whether that be today, or next week, it is difficult to judge.
Levels to watch/ live orders:
- Buys:Flat (Stop loss: N/A).
- Sells: Flat (Stop loss: N/A).
USD/CHF:
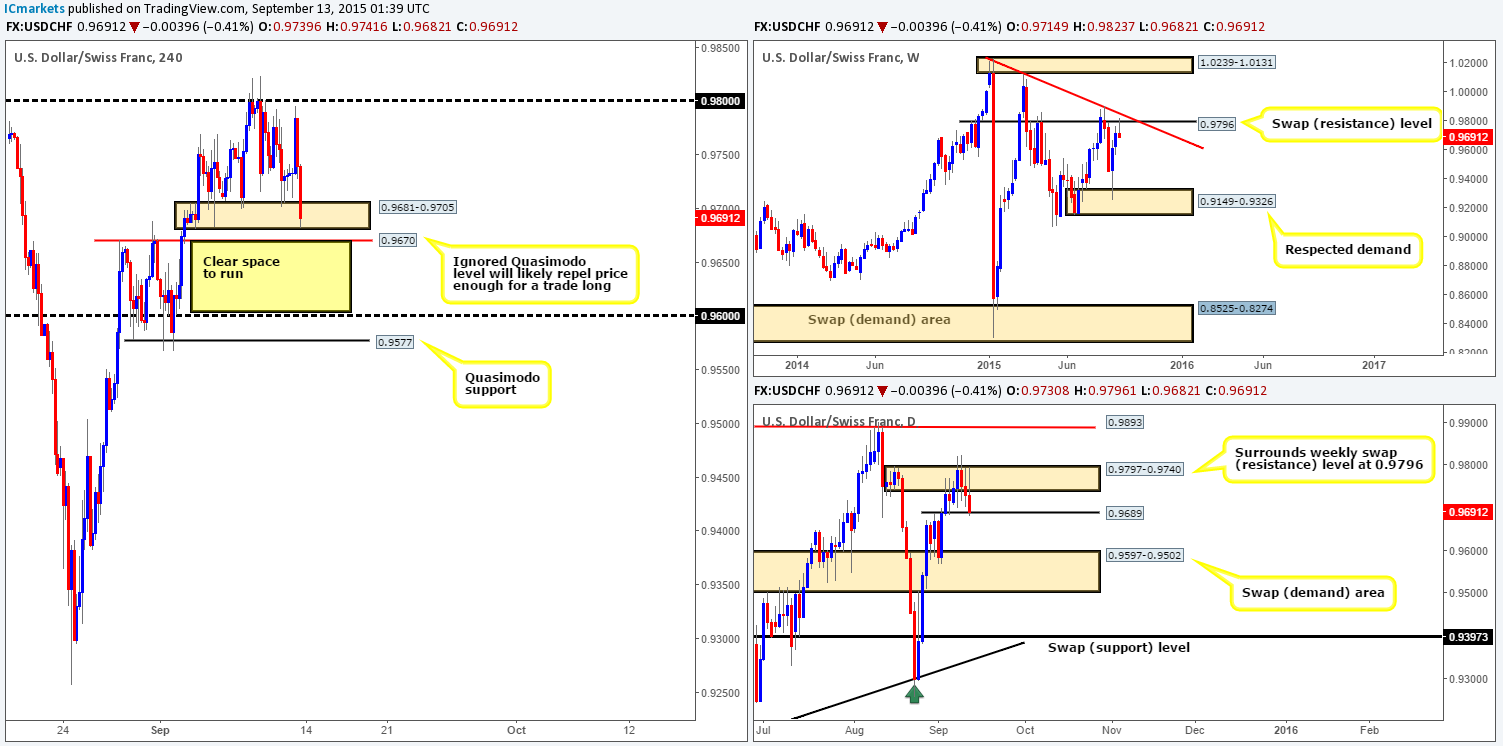
Weekly view: Following two weeks of consecutive buying, renewed selling interest came into this market last week from the underside of a swap resistance level at 0.9796. This resulted in price printing a beautiful-looking selling wick (a pin-bar), closing near its lows at 0.9691. There is, as far as we can see, now a clear run down to demand coming in at 0.9149-0.9326.
Daily view: From this angle, it’s clear that price faked above daily supply on two occasions early on in the week. We can also see that there was enough liquidity (buy stops) trawled in the net from this move to sell down to the jaws of a minor swap support barrier at 0.9689. In the event of a breakdown below here, further downside is expected back down towards a swap demand area at 0.9597-0.9502.
4hr view: The pair saw little action during the Asian session on Friday; it was only once Europe/London opened for business did we see volatility pick up. An aggressive influx of bids hit this market, pushing prices up to highs of 0.9796 before aggressively selling off past Thursday’s low 0.9701, and deep into a demand base at 0.9681-0.9705.
As long as the aforementioned daily swap (support) level gets taken out, we see little reason why this pair will not continue to sell off. In spite of this, there is a very tasty near-term ignored Quasimodo level at 0.9670 which will likely repel price enough at least for a scalp trade. Do yourself a favor and scroll through the history of your charts noting down how many of these beauties react – you’ll be pleasantly surprised!
Scalping long from 0.9670 is a little on the risky side, however, since we’re effectively going up against potential weekly opposition! Therefore, the safest and most logical way to approach this hurdle is to WAIT for lower timeframe confirming price action to present itself before putting your hard-earned capital on the line!
Ultimately though, we do expect this level to eventually give way and head down towards 0.9600/0.9577. Once, or indeed if this takes place, do keep your eye out for a potential retest of 0.9670 as resistance since it could provide a nice base in which to look for confirmed shorts into this market.
Levels to watch/ live orders:
- Buys: 0.9670 [Tentative – confirmation required] (Stop loss: dependent on where one confirms this level).
- Sells:Watch for bids to be consumed around 0.9670 and then look to enter on any retest seen at this number (confirmation required).
DOW 30:
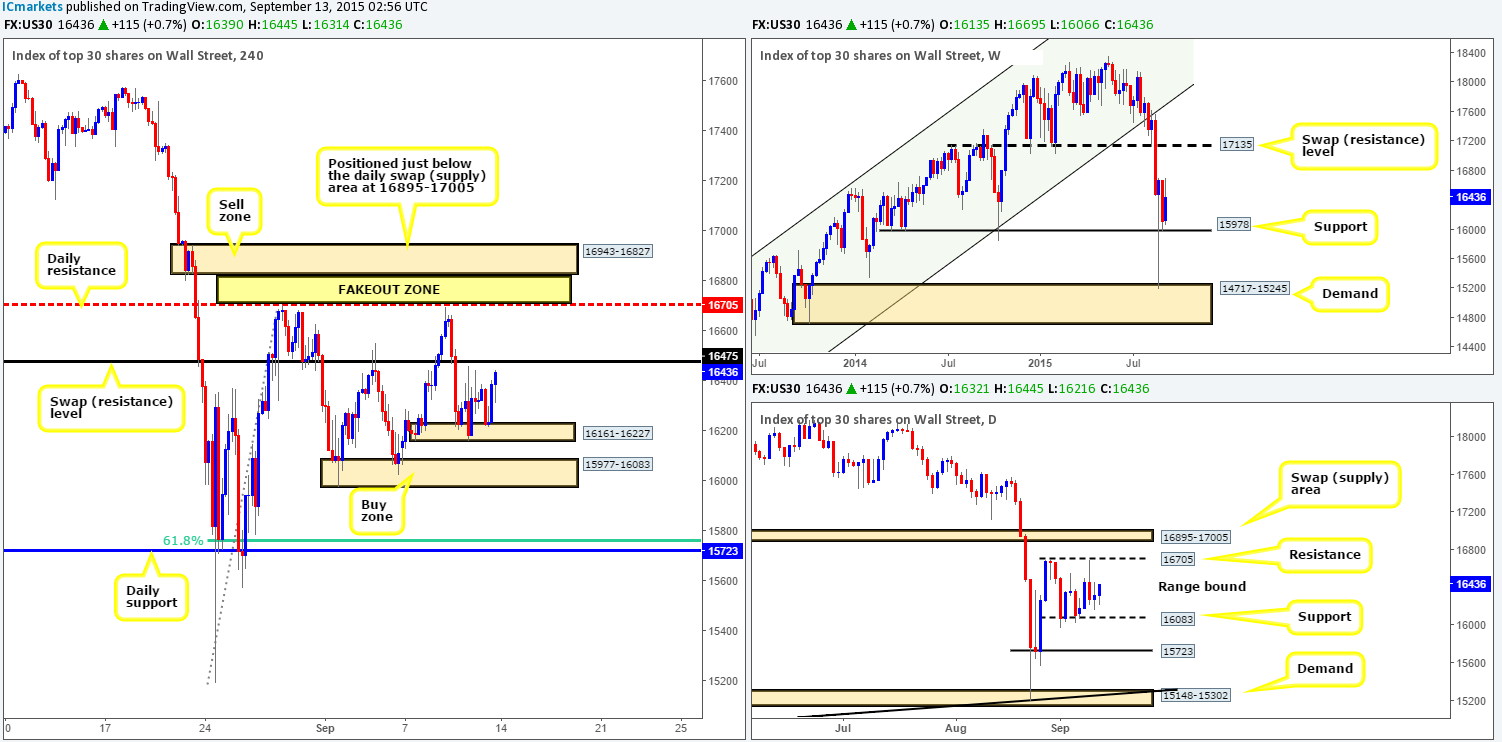
Weekly view:The DOW 30 index edged higher from support at 15978 last week, increasing its value by 322 points into the close 16436. Despite this, it’s difficult for us to judge whether this advance is legit. We only say this because of that humongous weekly spike that drove though this level three weeks ago at 15193 –bid strength could potentially be vulnerable here! Let’s see what the lower timeframes have to say on the matter…
Daily view:Down on the daily chart, we cansee last week’s movement has effectivelychiseled out a daily consolidation zone comprising of support at 16083 (located just above the aforementioned weekly support) and resistance at 16705.
4hr view:From Wednesday onwards, supportive pressure was seen from a small, yet highly resilient demand at 16161-16227, which, as you can see forced price to trade into Thursday’s high 16460 by the weeks end.
With price also now trading close to a swap resistance level at 16475, we may see some action around this barrier early on in today’s trade. This number, at least in our opinion, will likely play a key role in deciding where price will likely head to next.
On the assumption that 16475 is respected as resistance this week, we may see a sell-off back down to the aforementioned 4hr demand base. Due to the amount of times this zone has been hit though, we perceive this area to be weak, thus we’d be eyeing the 4hr demand zone below it at 15977-16083. At this point, you may be wondering why choose this area since it has already been hit (16024 – 04/09/15) and could also be weak. We agree it could be. However, what we like about this barrier is the fact that it is collectively made up of not only a weekly support at 15978, but also a daily support seen at 16083.As such this would be an area we consider buying from this week.
Supposing that16475 is taken out, however, this may not onlyentice further buying back up to the aforementioned daily resistance level, but may also give traders the chance to go long on any retest seen. Beyond the daily resistance line, we’d also be looking at a very compact supply zone coming in just above it at 16943-16827, which is neatly placed just below a daily swap (supply) barrier at 16895-17005. This is a perfect little sell zone, since there is the daily resistance level lurking just below itwhere the majority of traders will be looking to sell at. The big boys know this and also know there will be a ton of buy stops above this daily barrier. Therefore, do keep an eye out for a potential short within the yellow fakeout zone between these two areas this week to sell into all those stops!
Levels to watch/ live orders:
- Buys:15977-16083 [Tentative – confirmation required] (Stop loss: depends on where one confirms this area) Watch for offers at 16475 to be consumed and then look to enter on any retest seen at this number (confirmation required).
- Sells:16943-16827[Tentative – confirmation required] (Stop loss: depends on where one confirms this area)
XAU/USD: (Gold)
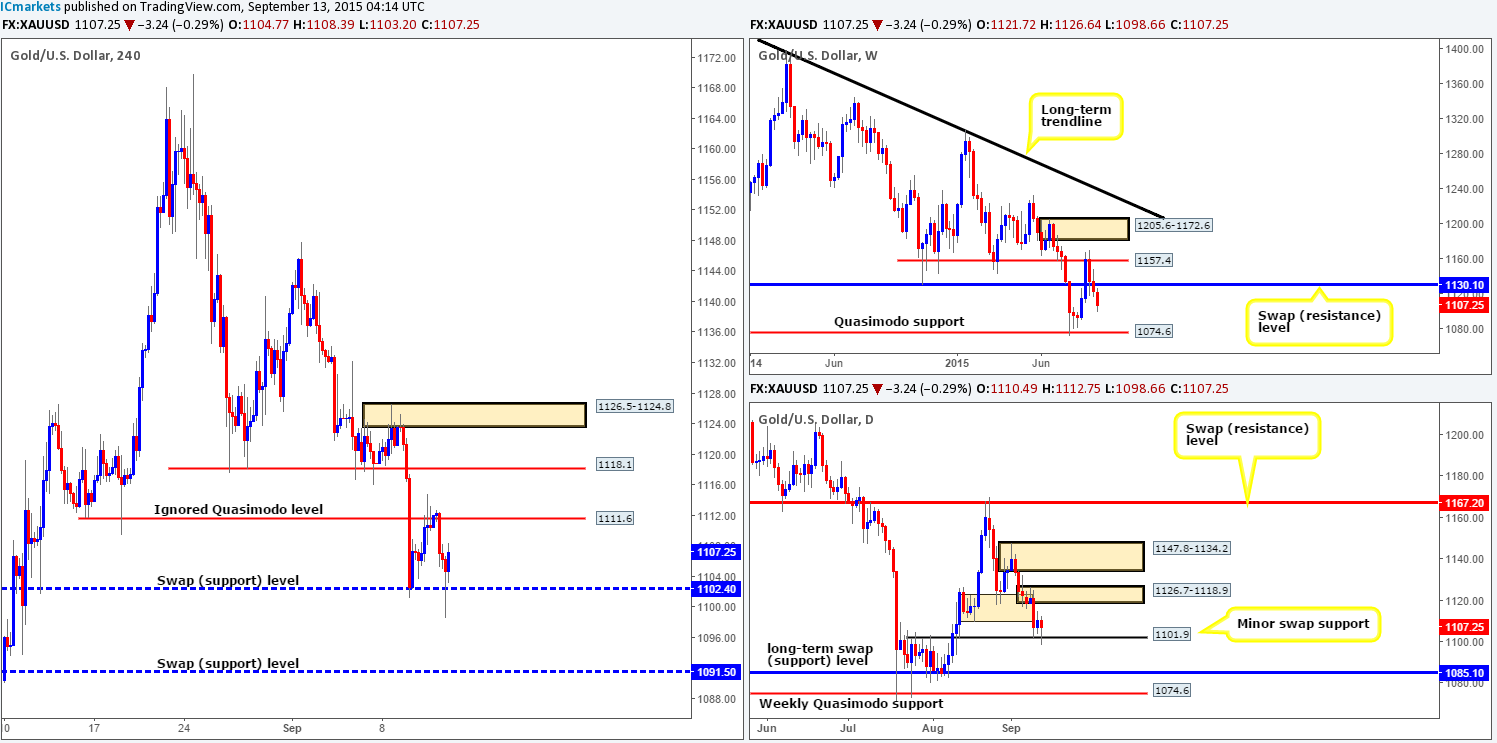
Weekly view:Gold suffered further losses for a third consecutive week last week, dropping over $15 in value (or 1560 pips) which saw price wrap up the week at 1107.2. We still believe Gold has further to decline yet since after bids were removed from the 1130.1 support, the next downside targetfrom here is situated around the Quasimodo support barrier at 1074.6.
Daily view:From the daily scale, however, we witnessed price take out demand at 1109.4-1122.7 on Wednesday, and slam dunk itself into a pile of freshly baked bids around 1101.9 – a minor swap support barrier. Thereafter we saw traders respond well to this level forming a relatively stable pin candle into the weekly close. Upside targets to keep an eye on this week come in around supply at 1126.7-1118.9, followed closely by another supply just above at 1147.8-1134.2. A breakdown through 1101.9, however, would likely place 10185.1 back in the limelight – a long-term swap support level.
4hr view:For those who read Friday’s report http://www.icmarkets.com/blog/friday-11th-september-daily-technical-outlook-and-review/ you may recall us suggesting to keep an eye on the ignored Quasimodo level at 1111.6 for potential shorts into this market. As you can see, price responded beautifully to this barrier, pushing Gold back down to swap support at 1102.4, which, as you can see, was aggressively defended around the close.
With all of the above taken into consideration, the overall structure of this market can be boiled down to the following points (levels above):
- Weekly trade shows little in the way of support to stop Gold from continuing lower this week.
- Daily action, on the other hand, reveals that supportive bids are being seen around a swap (support) level.
- On the 4hr timeframe, price is now effectively capped between the ignored Quasimodo level and a swap support barrier.
Therefore, looking to the week ahead, we are going to be closely watching both 1111.6 and 1102.4 on the 4hr timeframe for potential confirmed trades this week.
A cut through 1111.6, nonetheless would likely offer two things. Firstly, we believe it would set the stage for a continuation move north up to a swap resistance level at 1118.1 (located close to daily supply mentioned above at 1126.7-1118.9). Secondly, it may provide an opportunity to trade long should price retest 1111.6 as support (waiting for confirmation here is highly recommended). On the flip side, in case 1102.4 is engulfed, the river south should be ‘ripple free’ down to at least the 4hr swap support at 1091.5. For us to be given the green light to short following a close lower, we’d need to see price retest this area as supply together with lower timeframe selling confirmation.
Levels to watch/ live orders:
- Buys: 1102.4 [Tentative – confirmation required] (Stop loss: dependent on where one confirms this level) Watch for offers at 1111.6 to be consumed and then look to enter on any retest seen at this number (confirmation required).
- Sells: 1111.6 [Tentative – confirmation required] (Stop loss: dependent on where one confirms this level) Watch for bids at 1102.4 to be consumed and then look to enter on any retest seen at this number (confirmation required).


