A note on lower timeframe confirming price action…
Waiting for lower timeframe confirmation is our main tool to confirm strength within higher timeframe zones, and has really been the key to our trading success. It takes a little time to understand the subtle nuances, however, as each trade is never the same, but once you master the rhythm so to speak, you will be saved from countless unnecessary losing trades. The following is a list of what we look for:
- A break/retest of supply or demand dependent on which way you’re trading.
- A trendline break/retest.
- Buying/selling tails – essentially we look for a cluster of very obvious spikes off of lower timeframe support and resistance levels within the higher timeframe zone.
- Candlestick patterns. We tend to only stick with pin bars and engulfing bars as these have proven to be the most effective.
EUR/USD:
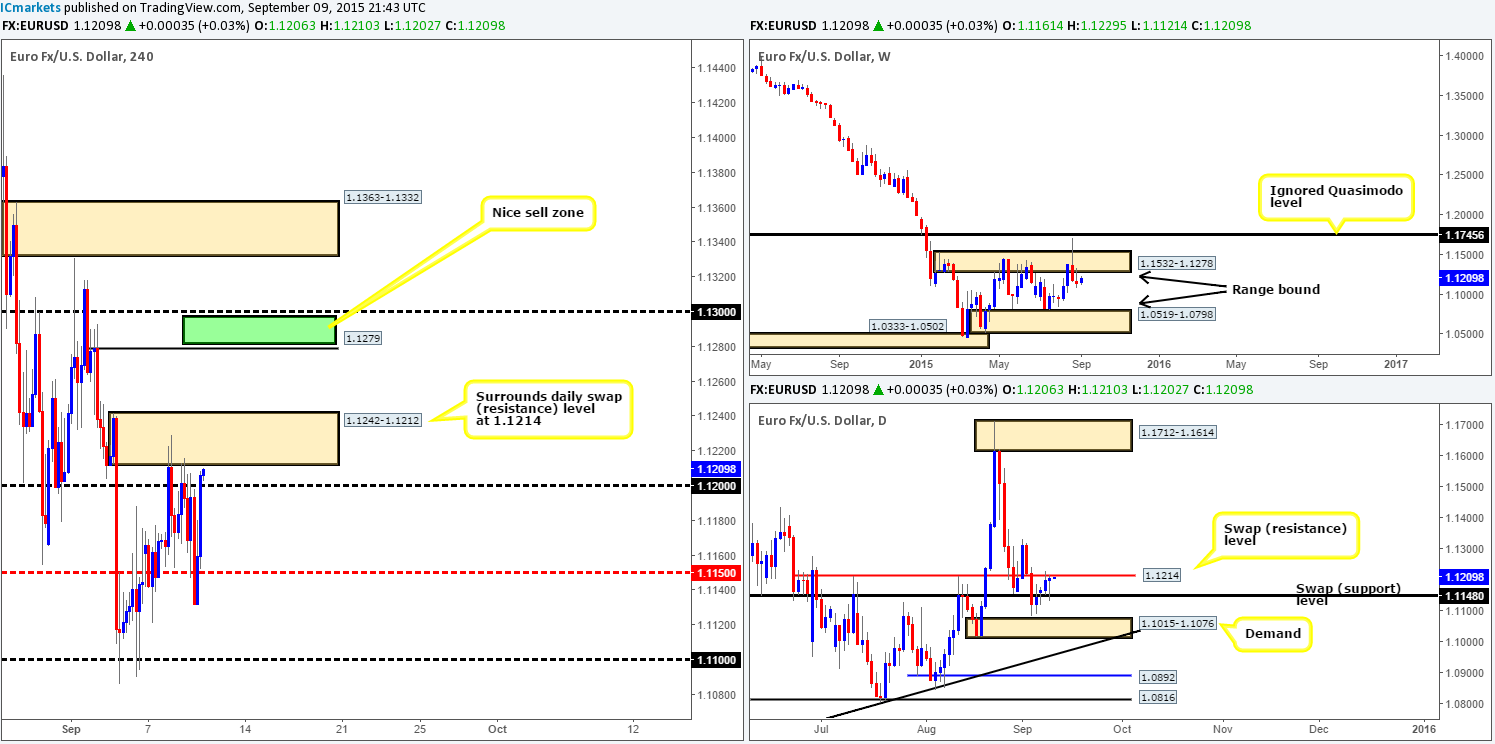
Coming at you directly from the weekly timeframe this morning, we can see that the buyers and sellers remain battling for position beneath the upper limit of weekly supply drawn from 1.1532-1.1278. Daily timeframe action on the hand, painted a nice-looking buying tail during yesterday’s session off the back of a daily swap (support) level at 1.1148. However, all this seems to have done is plant price firmly within shouting distance of a daily swap (resistance) level just above at 1.1214.
Looking across to the 4hr chart, nonetheless, shows us that 4hr supply at 1.1242-1.1212 (surrounds the aforementioned daily swap [resistance] level) held price lower during yesterday’s sessions creating an almost whipsaw effect. This saw price reach lows of 1.1131 before aggressively rebounding and closing only five pips above yesterday’s close at 1.1206.
The big question for us now is how long can the EUR bears hold the market lower here? Our guess is as long as this market remains well-bid above the 1.1200 handle during today’s sessions, it will not be too long before this 4hr supply area is consumed. With the above in mind, battle lines going into today’s sessions are as follows:
- Buys: 1.1200. If price retests this number today and holds firm, there may be a potential long opportunity from this line should corresponding lower timeframe price action be seen. Take-profit targets for this trade fall in at 1.1279/1.1300.
- Sells: 1.1279/1.1300. This region of supply not only appears fresh, but also lines up perfectly with the underside of the aforementioned weekly supply.
Levels to watch/live orders:
- Buys: 1.1200 [Tentative – confirmation required] (Stop loss: dependent on where one confirms this level).
- Sells: 1.1279/1.1300 [Tentative – confirmation required] (Stop loss: dependent on where one confirms this area).
GBP/USD:
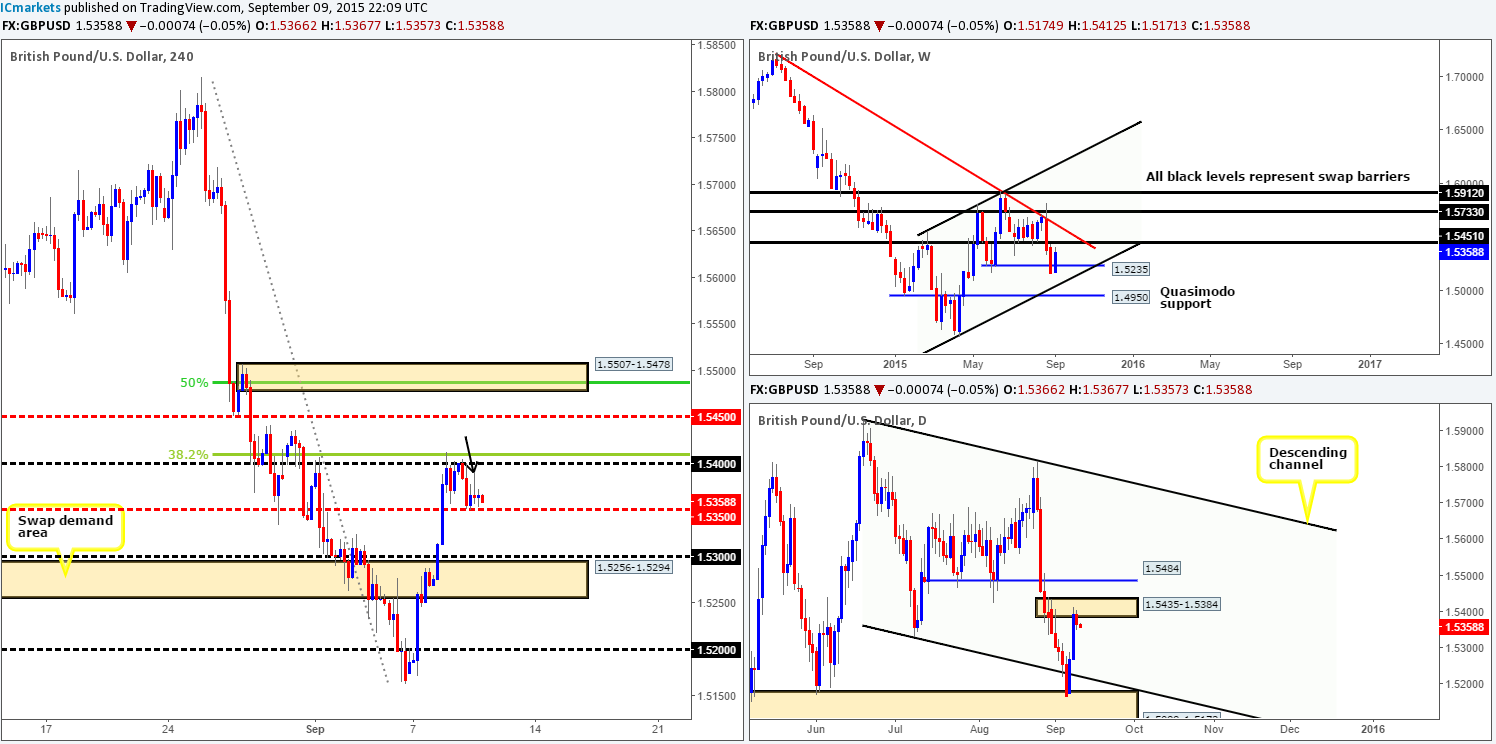
For those who follow our analysis on a regular basis you may recall us mentioning http://www.icmarkets.com/blog/wednesday-9th-september-daily-technical-outlook-and-review/ to keep an eye out for potential short trades from the 1.5400 region. As shown on the 4hr chart, price sold off from this number early on in yesterday’s trade reaching lows of 1.5349 on the day. This sell-off was, however, relatively short-lived, as price quickly drew support from the mid-level barrier 1.5350 and held steady for the rest of the day.
Looking at the weekly, daily and 4hr charts, here is what we have jotted down so far:
1.5350 will play a key role in our decision-making process today – here’s why…
- As already mentioned, 1.5350 has so far held firm. From this region there was also a push/spike higher as the U.S opened for business, reaching highs of 1.5390 (black arrow) – from a technical standpoint, this may have cleared overhead supply for this market to rally. That being the case, there could be a move up to 1.5450 (since offers at 1.5400 are potentially weak now), and quite possibly the 4hr supply just above it at 1.5507-1.5478 today. Both areas converge nicely with a weekly swap (resistance) level coming in at 1.5451. Traders wishing to try and buy this market would do well to remain patient here and only enter when/if the lower timeframe confirmation is present.
- On the flip side, let’s not forget that a break below 1.5350 is also a possibility today. The reasons? Price is currently trading from the underside of daily supply at 1.5435-1.5384 and shows very little near-term support below. By the same token, beneath 1.5350 on the 4hr timeframe, there is clear space for profit down to at least 1.5300.
On the whole, this market could go either way today especially since at around 11am GMT the BoE is set to take the stage to discuss interest rates. Our team, nonetheless favors a break lower today given where price is positioned on the higher timeframes. It will be interesting to see how this plays out.
Levels to watch/ live orders:
- Buys: 1.5350 [Tentative – confirmation required] (Stop loss: dependent on where one confirms this level).
- Sells: Watch for bids at 1.5350 to be consumed and then look to enter on any retest seen at this number (confirmation required).
AUD/USD:
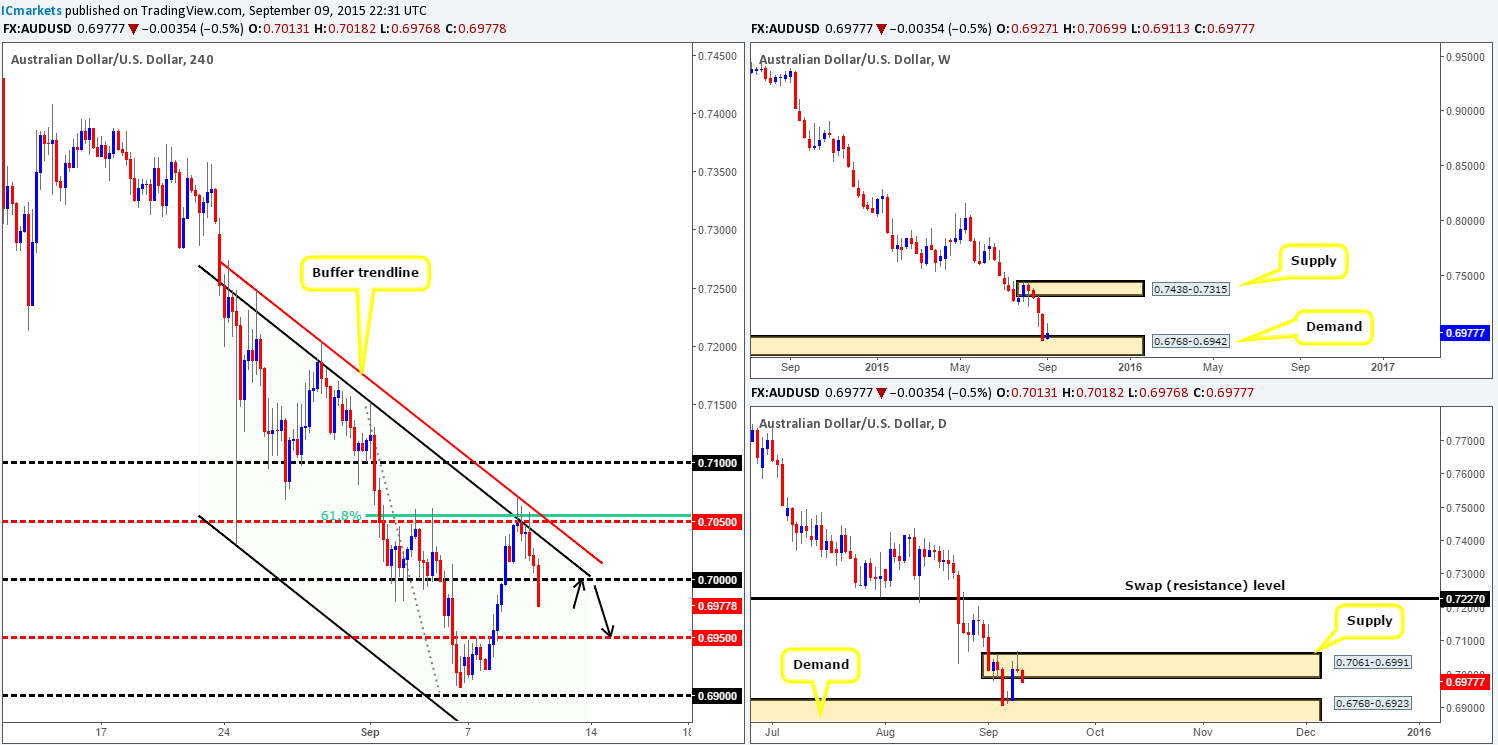
For those who read our previous report on this pair http://www.icmarkets.com/blog/wednesday-9th-september-daily-technical-outlook-and-review/ you may recall us mentioning to watch for possible shorting opportunities around the 0.7050 region. As you can see, price reacted beautifully to this area sending prices tumbling below the large psychological support 0.7000, and causing price to print a nice-looking bearish pin on the daily timeframe! Well done to any of our readers who managed to lock in some green pips from this move!
In the event that price closes below 0.7000 today, this would likely stimulate a further decline down towards the 0.6950/0.6900. However, simply selling the breakout is considered a risky trade in our book. We’d much prefer to see price retest 0.7000 as resistance before looking for a confirmed short position into this market.
Considering that the overall trend on this pair is still firmly pointing south, a trade from the underside of 0.7000 is relatively high-probability. But, there is ALWAYS a ‘but’. Like the short setup from 0.7050 yesterday, there is a catch! Price is trading around the top-side of weekly demand at 0.6768-0.6942 right now, so one has to tread very, very carefully here – hence the need for CONFIRMATION!
Levels to watch/ live orders:
- Buys: Flat (Stop loss: N/A).
- Sells: 0.7000 [Tentative – confirmation required] (Stop loss: dependent on where one confirms this level).
USD/JPY:
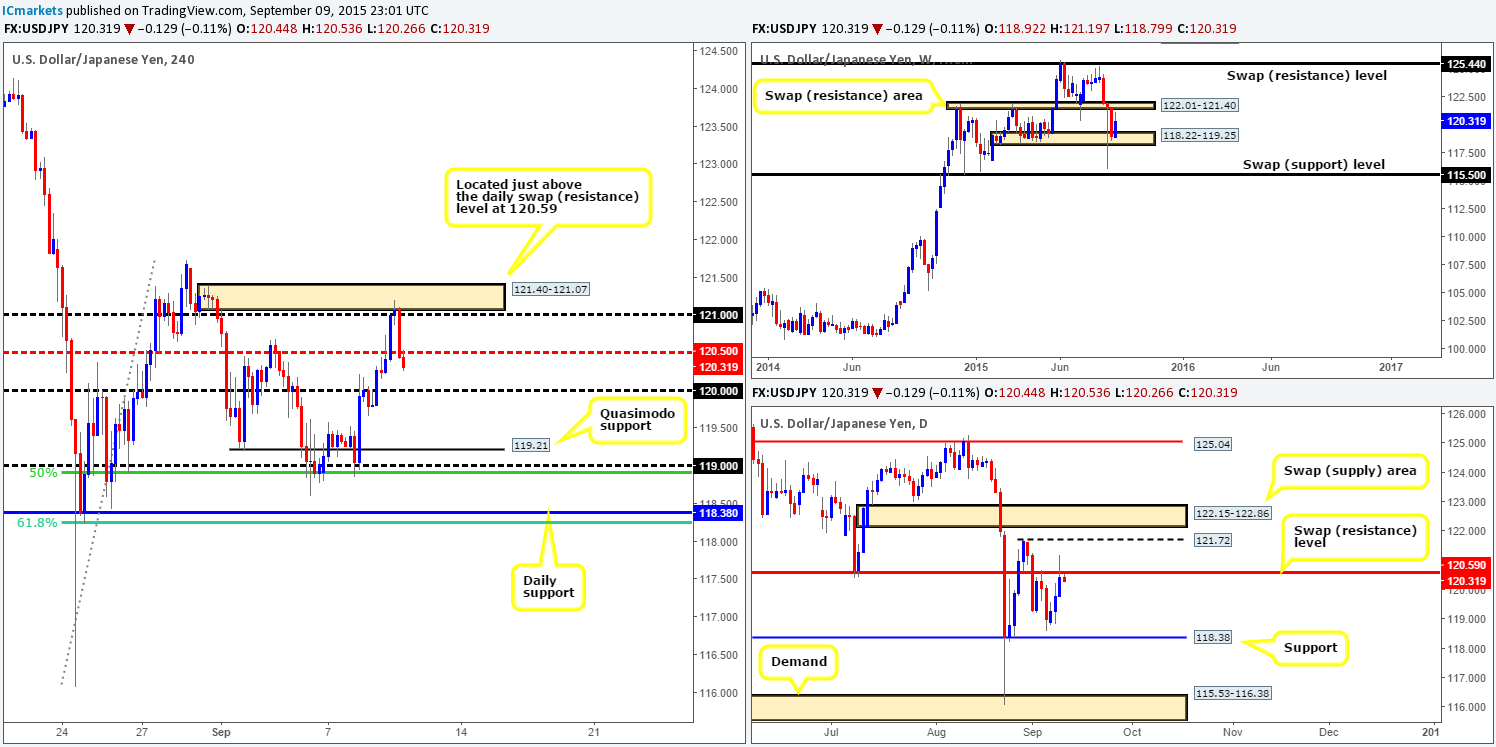
Despite resistance being seen around the underside of 120.00 on Tuesday, price eventually broke higher. This clearly encouraged further buyers into the market yesterday as price rallied a further 100 pips up to 4hr supply at 121.40-121.07 (located just above the daily swap (resistance) level at 120.59).
The response from this area of supply was absolutely beautiful! We did have this zone marked up previous to this, but completely ignored it as we were too focused on longs! Anyway, with price now steaming south from this zone, where do we see this market heading today? Well, considering that price is not only trading from a daily swap (resistance) level at 120.59, but also just below a weekly swap (resistance) area at 122.01-121.40, our team favors shorts for the time being. However, the only setup we currently see that may offer us a short is on the retest of 120.50 which already seems to have taken place! Therefore, we’re unfortunately left with waiting for price to break below and retest 120.00 as resistance, since, there appears to be a relatively clear run below this number down to a 4hr Quasimodo support at 119.21. Granted, price may react at 119.50, but we believe since there is a 50% Fibonacci level and the round number 119.00 surrounding this 4hr Quasimodo, price will be more attracted to this region.
Levels to watch/ live orders:
- Buys: Flat (Stop loss: N/A).
- Sells: Watch for bids around 120.00 to be consumed and look to enter on any retest seen at this number (confirmation required).
USD/CAD:
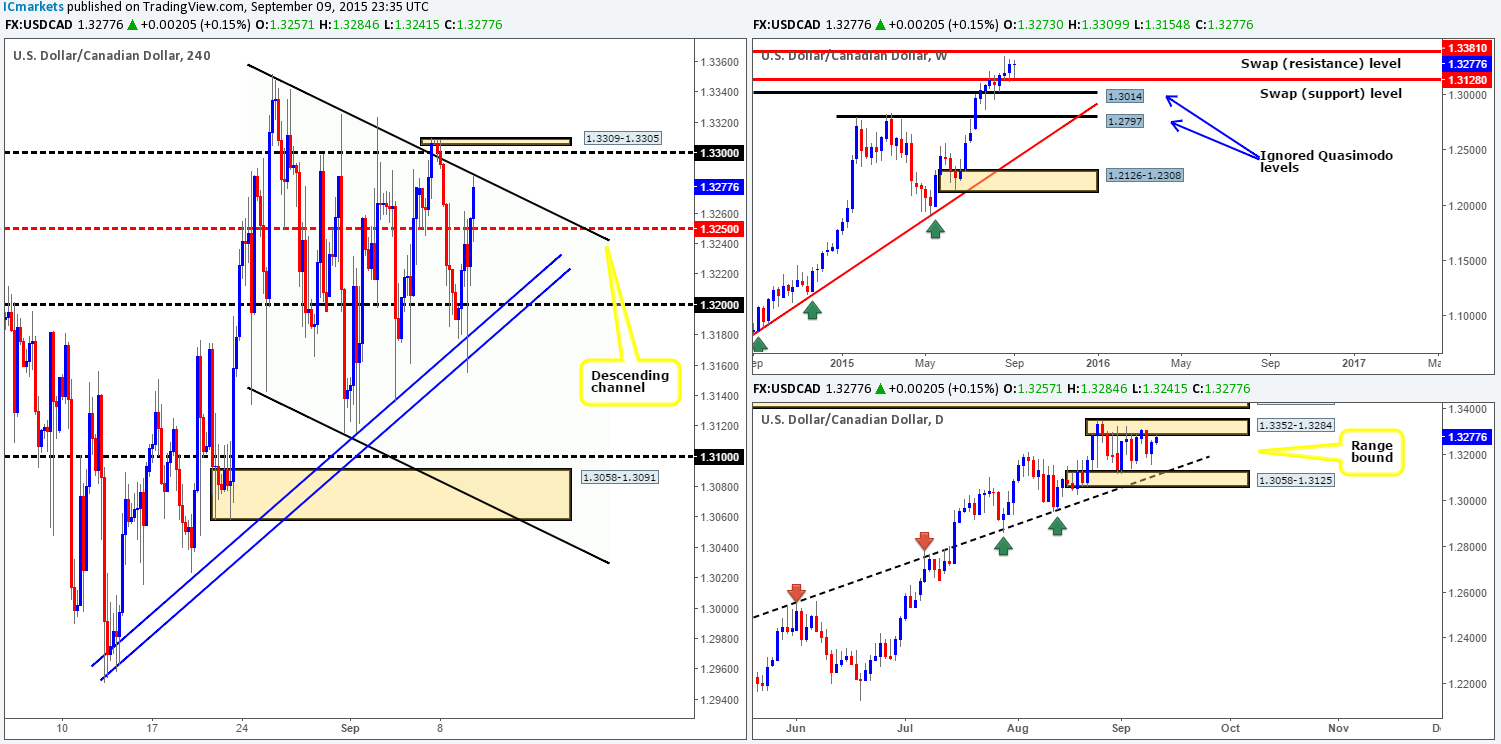
Using a top-down approach this morning, we see that price remains steady on the weekly timeframe above a weekly swap (support) barrier at 1.3128. The nest upside target on this scale falls in at 1.3381 – a weekly swap (resistance) level. Moving down to the daily timeframe, it is clear that price appears to be caught within a range comprising of daily supply at 1.3352-1.3284 and daily demand drawn from 1.3058-1.3125.
Spiraling down one more to the 4hr timeframe, price action found supportive pressure from last Friday’s low 1.3161 and also the 4hr ascending trendline taken from the low 1.2950 going into U.S. trade. This, as can be seen from the chart, aggressively saw the USD/CAD rally over a 100 pips (likely caused by the BoC rate decision) and connect with the underside of the 4hr descending channel resistance extended from the high 1.3352.
In light of price currently trading around a potential sell point on the 4hr timeframe, and the fact that price is crossing swords with the upper limit of the aforementioned daily range, should traders be looking to short?! Personally, we would not be sellers in this market right now, simply because price could potentially fake above this 4hr descending channel to connect with offers around 1.3300/4hr supply at 1.3309-1.3305. A very compact sell zone! With that being said, shorting from either of the above said 4hr levels will still, at least for us, require lower timeframe confirming price action due to the following:
- This USD/CAD is in a humongous uptrend at the moment.
- Price, as mentioned above, remains steady on the weekly timeframe above a weekly swap (support) barrier at 1.3128.
Levels to watch/ live orders:
- Buys: Flat (Stop loss: N/A).
- Sells: 1.3300/1.3309-1.3305 [Tentative – confirmation required] (Stop loss: dependent on where one finds confirmation).
USD/CHF:
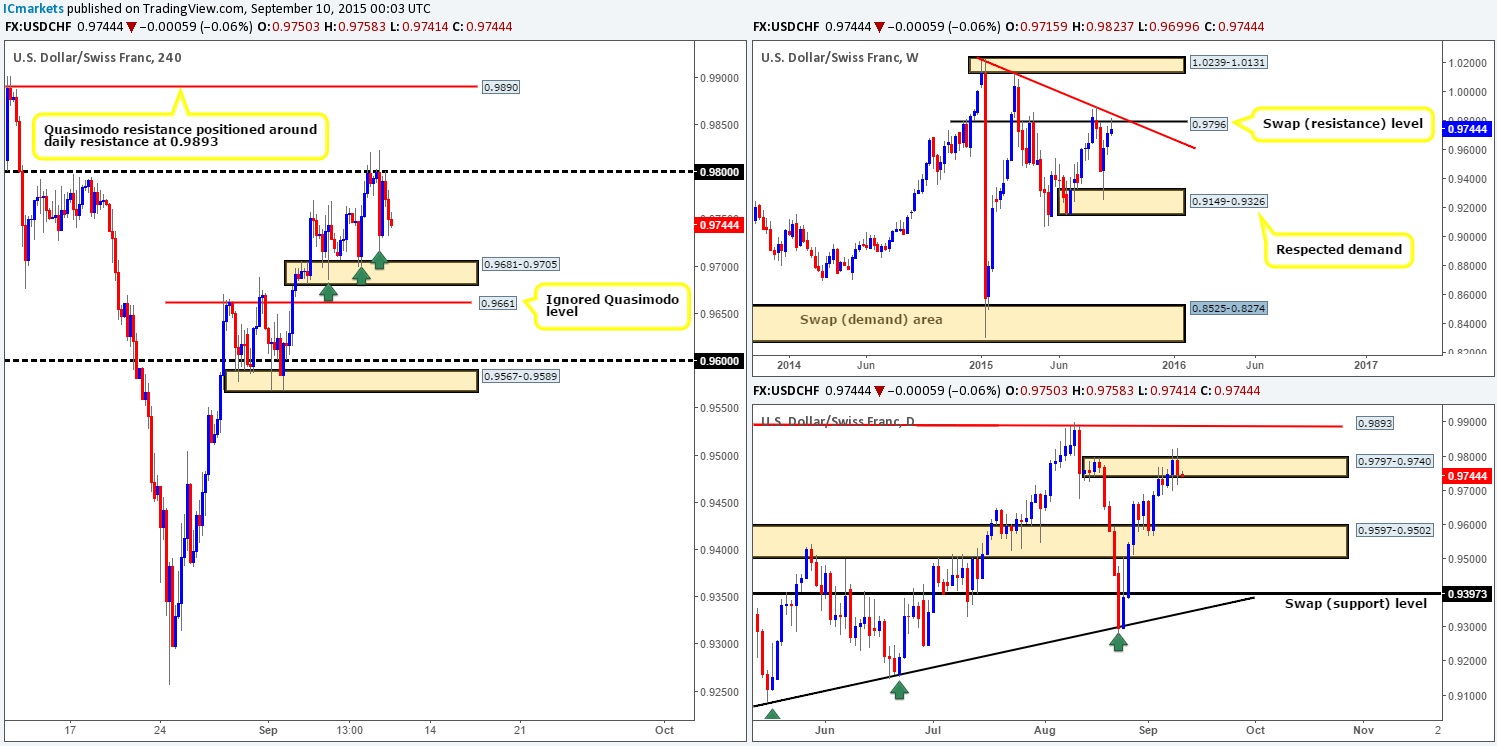
(Trade update: we were stopped out going into the European session – we believe this is called a Frankie fakeout)!!!
All in all, the 0.9800 psychological resistance held this market lower during yesterday’s trade. This should not really come as much of a surprise though, as it converges nicely with both a weekly swap (resistance) level at 0.9796 and a daily supply zone at 0.9797-0.9740.
Going forward, bids below current price appear weak. Check out the obvious 4hr demand consumption tails seen marked with green arrows at 0.9686/0.9700/0.9715. This suggests that the path is relatively free back down to at least the 4hr demand zone coming in at 0.9681-0.9705, and very likely the 4hr ignored Quasimodo level below it at 0.9661. Although our bias is firmly south on this pair for the moment, 0.9661 is likely going to repel price. Check through the history of your charts and note down how many of these ignored Quasimodo levels actually hold – you’ll be pleasantly surprised!
With that being said, we may, depending on how the lower timeframe action responds here, take a small intraday scalp long from this Quasimodo barrier. Ultimately though, we do expect this level to eventually give way and head back down to 0.9600/4hr demand 0.9567-0.9589.
Levels to watch/ live orders:
- Buys: 0.9661 [Tentative – confirmation required] (Stop loss: dependent on where one confirms this level).
- Sells: Watch for bids to be consumed around 0.9661 and then look to enter on any retest seen at this number (confirmation required).
DOW 30:
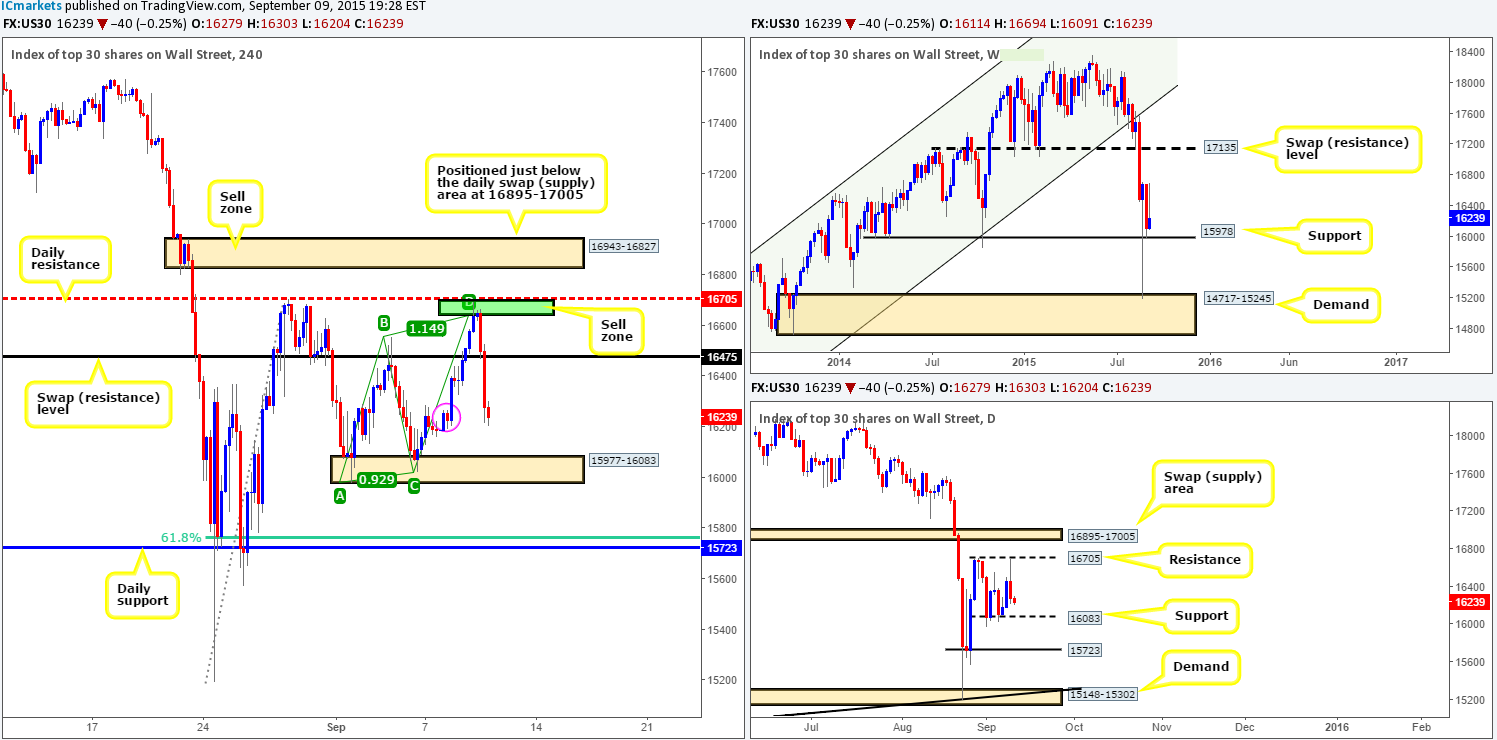
Upon opening the 4hr chart this morning, we were greeted with a picture-perfect setup! For those who read our previous report on the DOW http://www.icmarkets.com/blog/wednesday-9th-september-daily-technical-outlook-and-review/ you may recall us mentioning to keep a close eye on 16640/16705 for potential shorts. As you can see, price responded beautifully to the AB-CD completion point at 16640, which was positioned just below a daily resistance level at 16705. Well done to any of our readers who managed to lock in some green pips from this move!
Pushing forward, we can see that price now appears to be soaking up bids around a minor 4hr demand zone coming in at 16191-16267 (pink circle). Nonetheless, we are not expecting this area to hold as price is likely heading towards 16083/15978 – daily/weekly support, which collectively form the 4hr demand area just below at 15977-16083. Therefore, with this 4hr demand area clearly linked to higher timeframe support, today’s objective is simple. Wait to see if price reaches this 4hr barrier, and then begin looking for lower timeframe confirmed entries long into this market.
Levels to watch/ live orders:
- Buys: 15977-16083 [Tentative – confirmation required] (Stop loss: depends on where one confirms this area).
- Sells: Flat (Stop loss: N/A).
XAU/USD: (Gold)
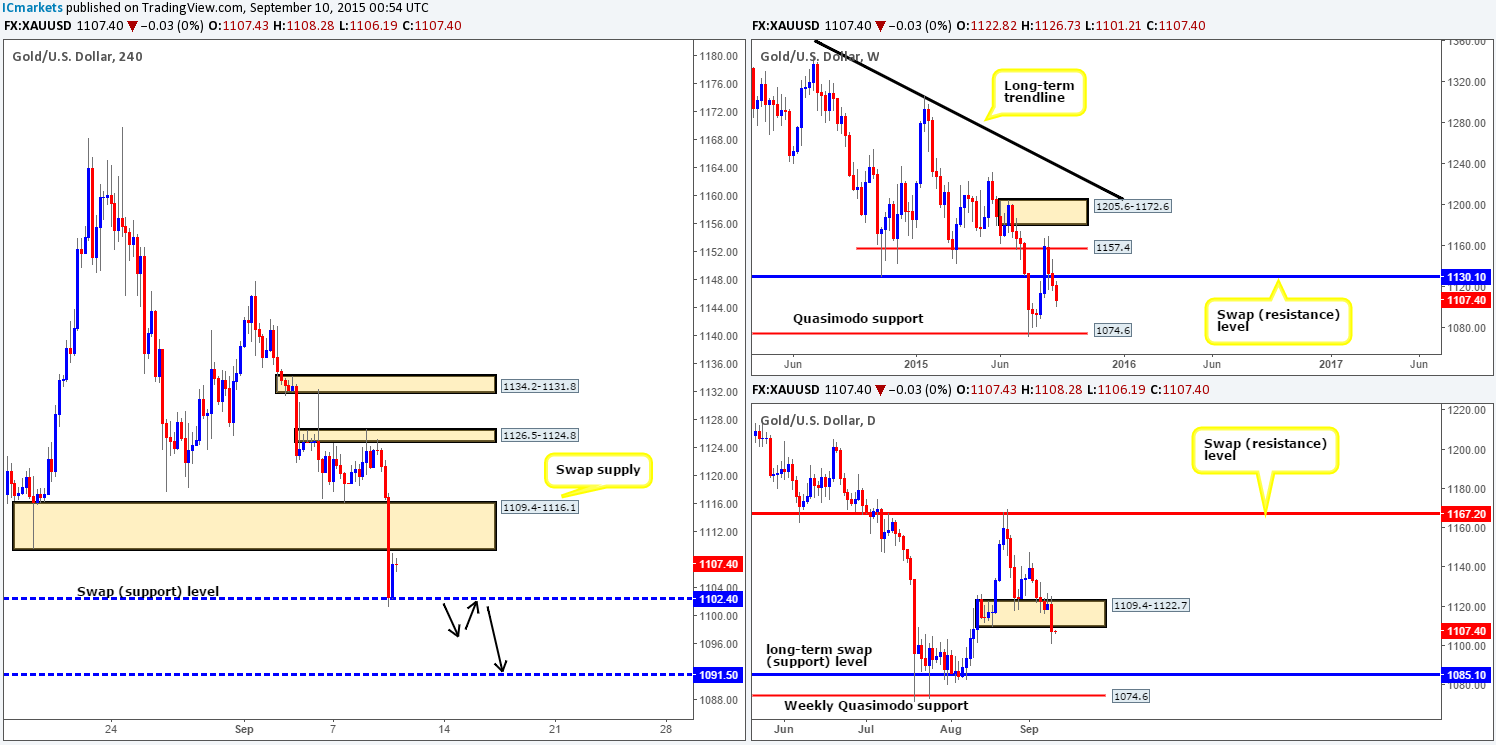
Gold took a turn for the worst during the course of yesterday’s trade, losing close to $21 off its value. This recent selling saw price take out a 4hr demand zone coming in at 1109.4-1116.1, and connect up with a 4hr swap (support) level at 1102.4. It was only once price found support at this level did the market begin to stabilize.
To our way of seeing things at the moment, the bounce from 1102.4 is questionable. The reason being is because this market not only shows room to continue lower on the weekly scale down to 1074.6, but also shows price has now closed below daily demand at 1109.4-1122.7. In addition to this, anyone buying from 1102.4 will have to deal with potentially problematic offers sitting within the recently broken 4hr demand area which should act as supply now.
Given the points made above, we are not going to be buying into this recent bounce. Instead, we’re going to be looking for it to be broken and retested as resistance (black arrows), since beneath this number there is space to run down to a 4hr swap (support) level at 1091.5. Shorting the break/retest of 1102.4 is not something we’d be comfortable entering into blindly as fakeouts around swap levels occur frequently. With that, lower timeframe confirmation is essential for us to be confident shorting this market.
Levels to watch/ live orders:
- Buys: Flat (Stop loss: N/A).
- Sells: Watch for bids to be consumed around 1102.4 and then look to enter on any retest seen at this number (confirmation required).