A note on lower timeframe confirming price action…
Waiting for lower timeframe confirmation is our main tool to confirm strength within higher timeframe zones, andhas really been the key to our trading success. It takes a little time to understand the subtle nuances, however, as each trade is never the same, but once you master the rhythm so to speak, you will be saved from countless unnecessary losing trades. The following is a list of what we look for:
- A break/retest of supply or demand dependent on which way you’re trading.
- A trendline break/retest.
- Buying/selling tails – essentially we look for a cluster of very obvious spikes off of lower timeframe support and resistance levels within the higher timeframe zone.
- Candlestick patterns. We tend to only stick with pin bars and engulfing bars as these have proven to be the most effective.
EUR/USD:
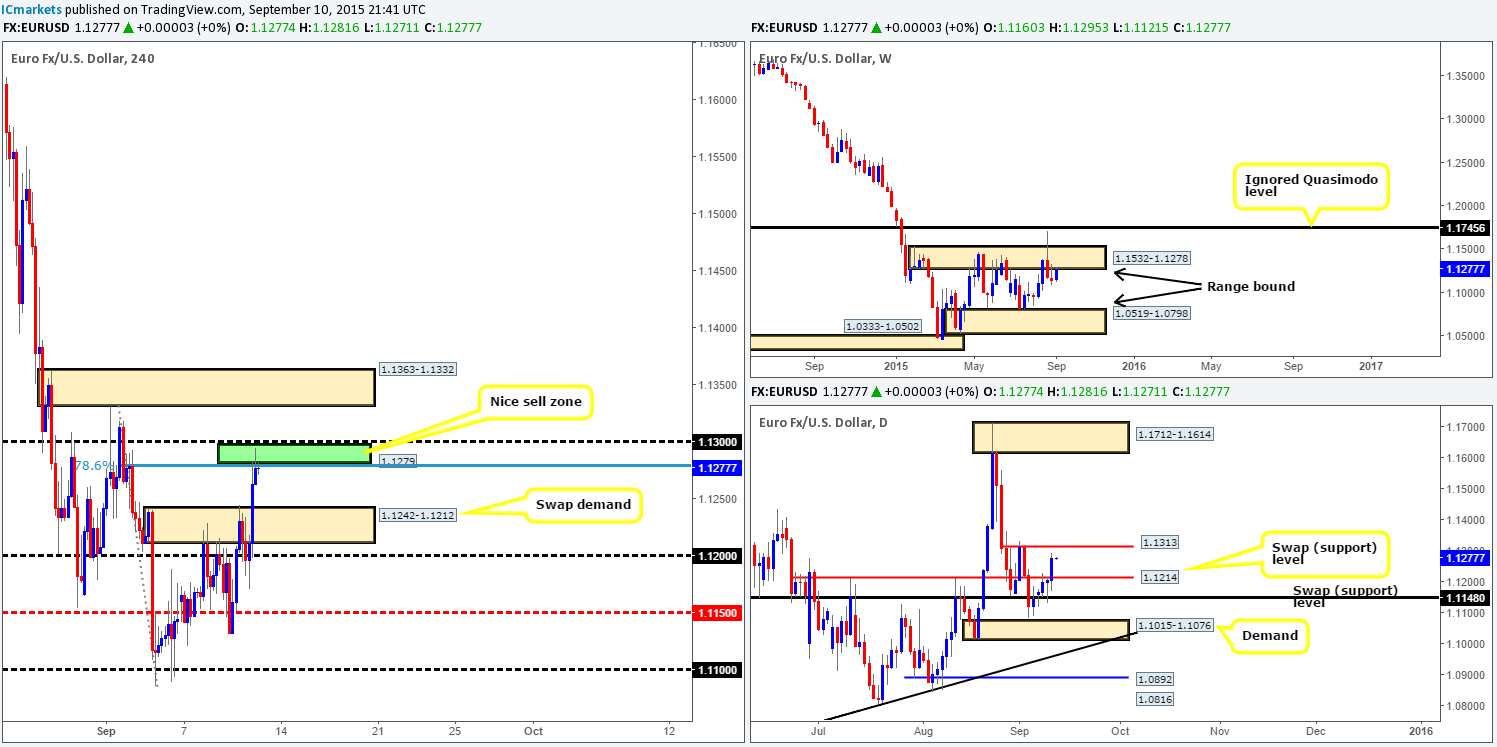
During the course of yesterday’s sessions, price violently retested the 1.1200 handle as support and aggressively rallied over a 100 pips during U.S. trade. This buying took out the 4hr supply at 1.1242-1.1212, and connected with offers sitting between 1.1279/1.1.1300 – a pre-determined 4hr sell zone of ours.
Alongside this 4hr buy zone, price is also shaking hands with the underside of a weekly supply drawn from 1.1532-1.1278, thus we feel a bounce lower could take place from here today. The cool thing about this 4hr area is there is also a deep 78.6% Fibonacci resistance level at 1.1280, and clear space to run 40 pips south to supply – turned demand at 1.1242-1.1212. With lower timeframe confirmation and a small stop here, one could possibly short from here with reasonable risk/reward.
However, there is a chance price may fake above 1.1300 today. This would not only clear out traders attempting to fade this level, but also allow price action to connect with a minor daily resistance sitting at 1.1313. This is why we insist on having confirmation from the lower timeframes before jumping in to sell this market.
Levels to watch/live orders:
- Buys:Flat (Stop loss: N/A).
- Sells:1.1279/1.1300 [Tentative – confirmation required] (Stop loss: dependent on where one confirms this area).
GBP/USD:
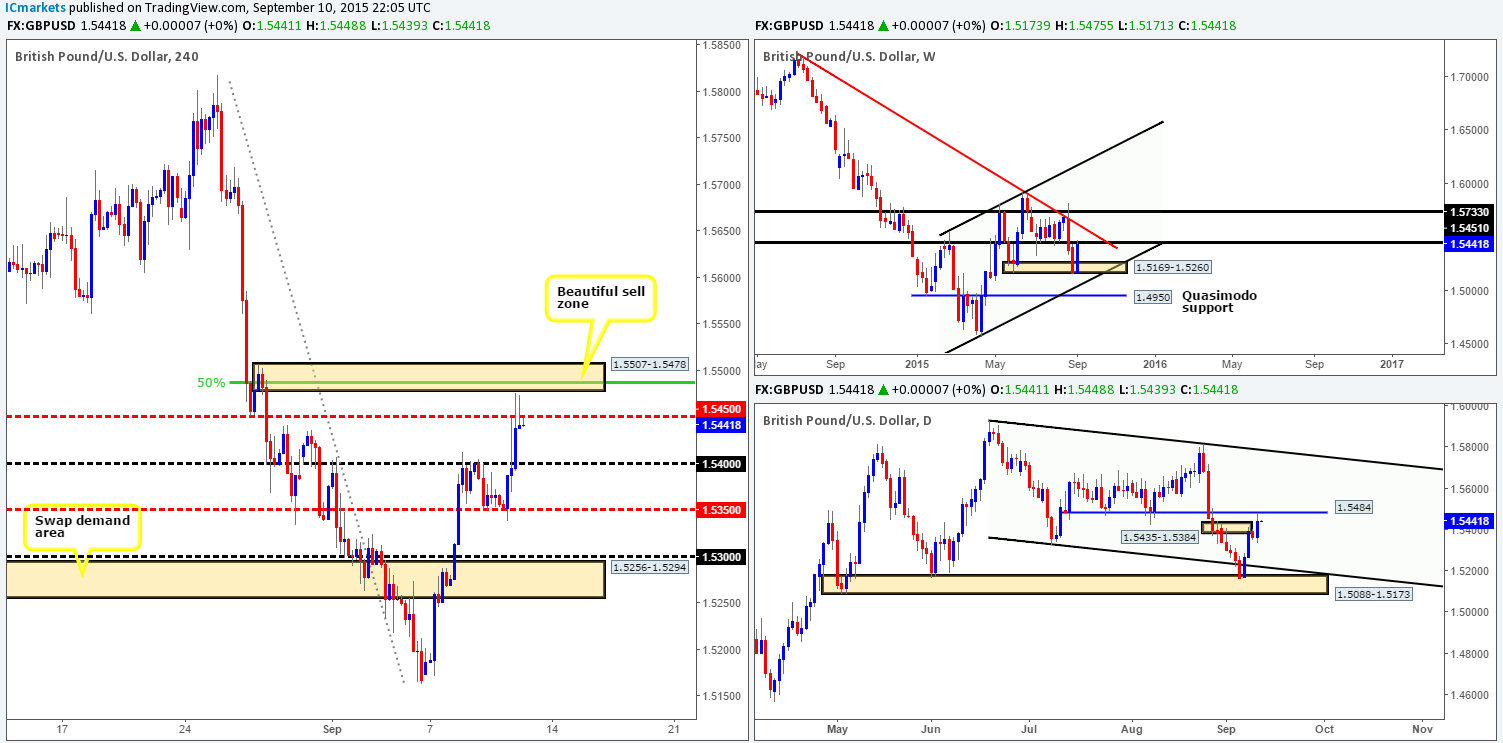
Coming from the pits of the weekly timeframe this morning, we can see that the rebound from weekly demand at 1.5169-1.5260 has forced price to kiss the underside of a weekly swap (resistance) level at 1.5451. Moving down to the daily timeframe, we witnessed price consuming daily supply at 1.5435-1.5384, and coming within a few pips of hitting a daily swap (resistance) level at 1.5484.
For those who read our previous analysis on Cable http://www.icmarkets.com/blog/thursday-10th-september-keep-an-eye-on-the-gbp-markets-around-11am-gmt-traders/ you may recall us mentioning to keep an eye out for lower timeframe buying confirmation around the 1.5350 mark. As can be seen from the 4hr chart, price responded beautifully to this level going into London trade, consequently sending this pair over a 100 pips north. Well done to any of our readers who managed to lock in some green pips from this move.
Going forward, recent price action shows back-to-back selling tails have pierced through 1.5450 and came very closeto hitting 4hr supply at 1.5507-1.5478. This – coupled with near-term higher timeframe resistance (see above) suggests Cable may weaken from here. That being the case, our analysis is relatively straightforward today. Watch for lower timeframe selling confirmation between 1.5450/1.5507-1.5478. Ideally, we’ll want to enter short as high as possible since we would not feel comfortable trading within this region unless our stop is placed above the 4hr supply zone itself.
Levels to watch/ live orders:
- Buys: Flat (Stop loss: N/A).
- Sells: 1.5450/1.5507-1.5478 [Tentative – confirmation required] (Stop loss: dependent on where one confirms this area).
AUD/USD:
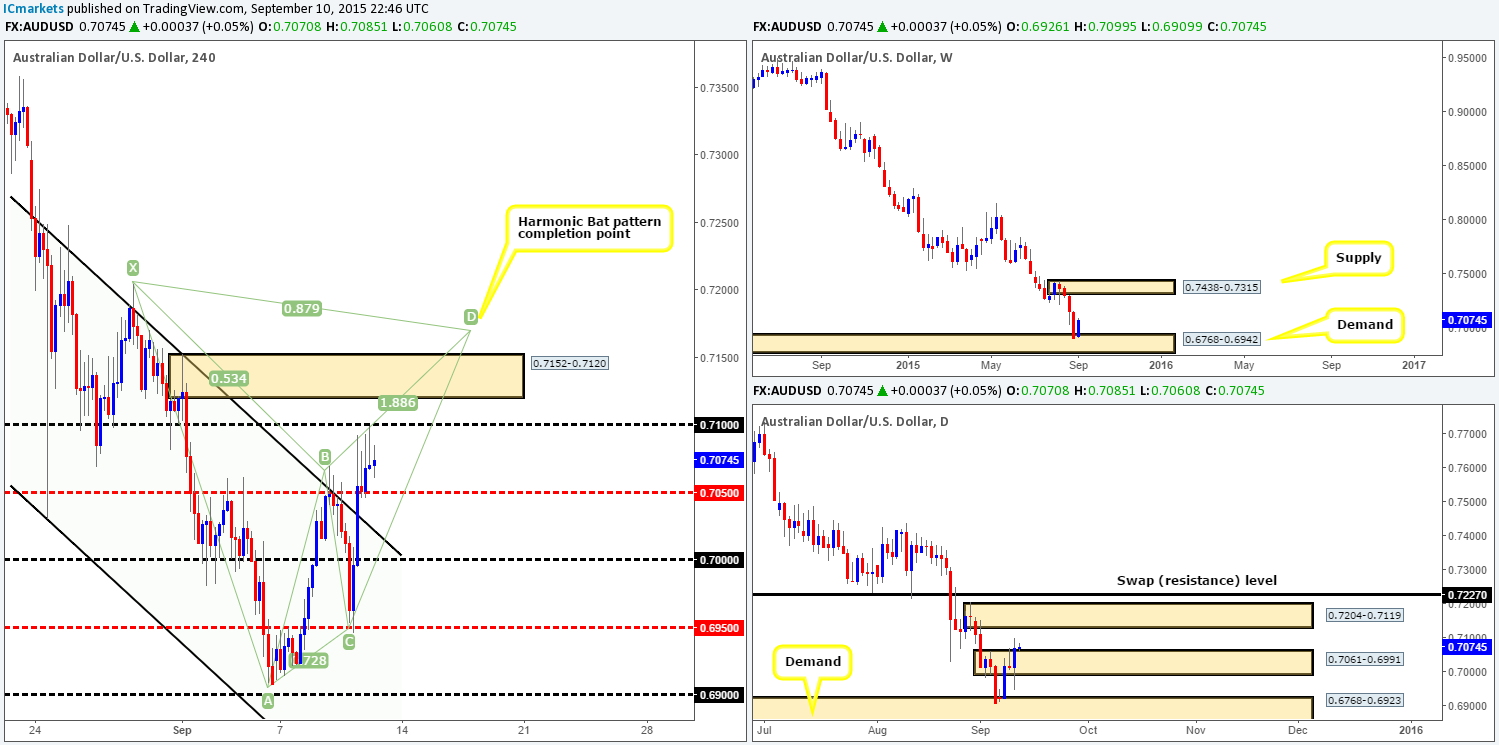
Recent events show the value of the Aussie dollar appreciated in aggressive fashion on Thursday, clearing out several 4hr technical barriers before connecting with 0.7100. It was from this region that price began to stabilize and paint a beautiful array of 4hr selling tails into the close 0.7070.
Consequent to this recent activity, price has very nearly completed the D-leg of a 4hr Harmonic Bat patternterminating around the 0.7170 area. This is certainly somewhere we’d consider selling from if price reaches this high, since it sits within a daily supply zone coming in at 0.7204-0.7119. We also like the way this Harmonic pattern completes just above the 4hr supply area at 0.7152-0.7120 – this has fakeout written all over it!
That being said, one will need do tread carefully here, as let’s not forget that even though price is currently trending south, we are seeing buying pressure from a weekly demand zone seen at 0.6768-0.6942.
Levels to watch/ live orders:
- Buys: Flat (Stop loss: N/A).
- Sells: 0.7071 [Tentative – confirmation required] (Stop loss: dependent on where one confirms this level).
USD/JPY:
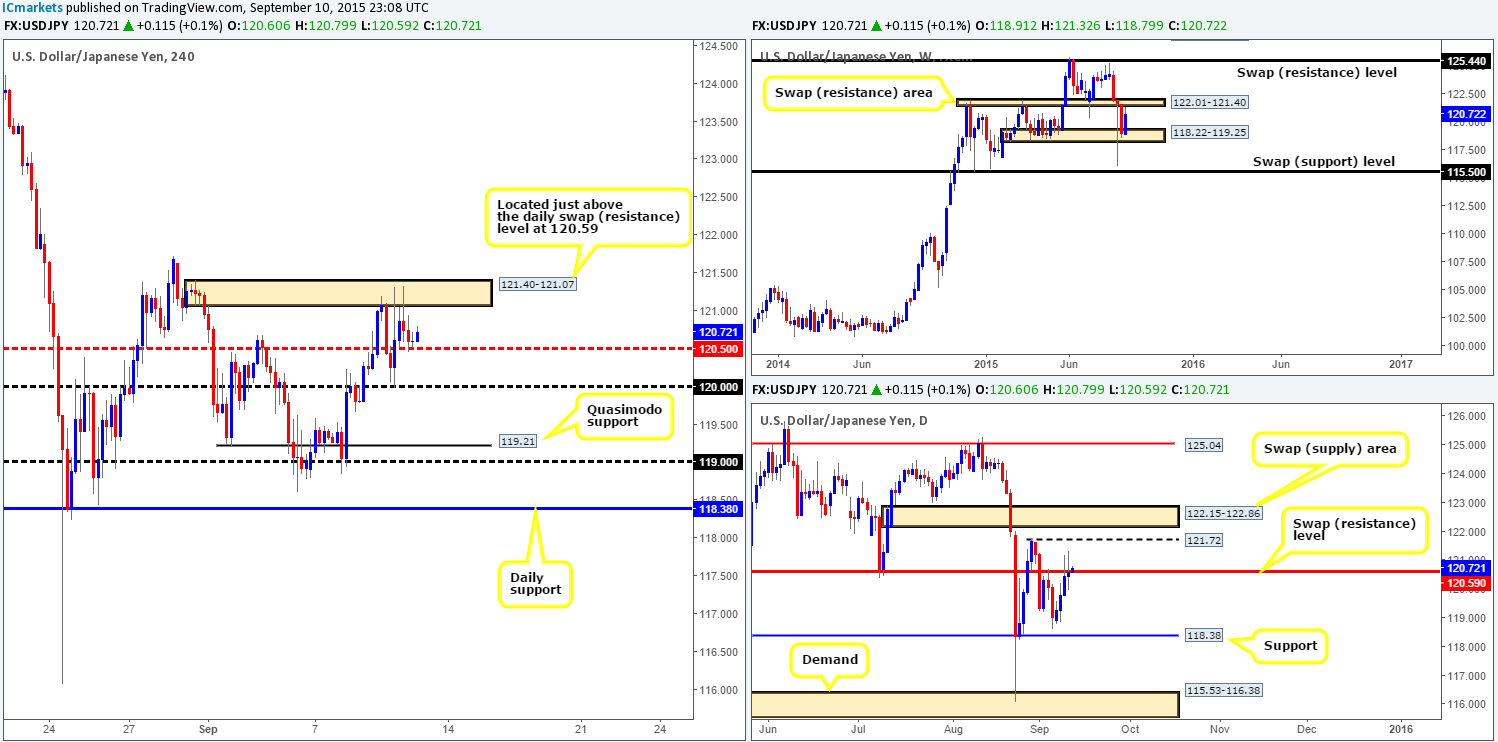
Early morning trade saw the USD/JPY pair aggressively rally 100 pips higher, which, as you can see, forced price to connect with 4hr supply at 121.40-121.07and sell-off down towards 120.50 to end the day.
We’re sure you’ll agree with us if we say current action is a little tight at the moment! A long from 120.50 has around fifty or so pips to run until hitting the aforementioned 4hr supply once again. Conversely, a violation of 120.50 has 120.00 to target. We are certainly not saying it is not worth considering a trade from either of these levels. It is just one would need to enter with a small enough stop to make it worth your while from a risk/reward perspective.
In addition to the above, we are currently receiving somewhat mixed signals from the higher timeframe structures at the moment. Check out how price is slightly rebounding lower from just below the underside of a weekly swap (resistance) area at 122.01-121.40 indicating shorts could be possible. Meanwhile, daily sellers appear to be struggling to defend the swap (resistance) level at 120.59, consequently printing an indecision candle and closing higher on the day at 120.60, suggesting possible weakness within the sellers’ camp.
For us personally, we are going to stand aside regarding this pair today simply because there are likely more attractive opportunities in different markets.
Levels to watch/ live orders:
- Buys: Flat (Stop loss: N/A).
- Sells:Flat (Stop loss: N/A).
USD/CAD:
The first words that sprung to mind upon opening the 4hr chart on the USD/CAD this morning was: ‘organized mess’. Now, we know this does sound somewhat contradictory, but when you look past the whipsawing action, price has been very well contained between a 4hr ascending trendline taken from the low 1.2950, and the 4hr channel resistance extended from the high 1.3352. By and large, price is compressing so tightly between these two lines now, it looks ready to blow at any minute!One could of course look to trade the limits here with lower timeframe confirmation, yet with the distance between the two converging levels shortening every day, we’ll humbly stand aside on this one.
The big question for us now is when price does decide to breakout, where will it head to? Well, with price technically still range bound on the daily timeframe (1.3058-1.3125/1.3352-1.3284), and the weekly timeframe trading mid-way between support and resistance (1.3128/1.3381), it is difficult to judge. However, considering that the trend is still strong on this pair and the fact that one could consider the current 4hr price action to be a bullish flag; we have a sneaking suspicion it is going to break higher.

Levels to watch/ live orders:
- Buys:Flat (Stop loss: N/A).
- Sells: Flat (Stop loss: N/A).
USD/CHF:
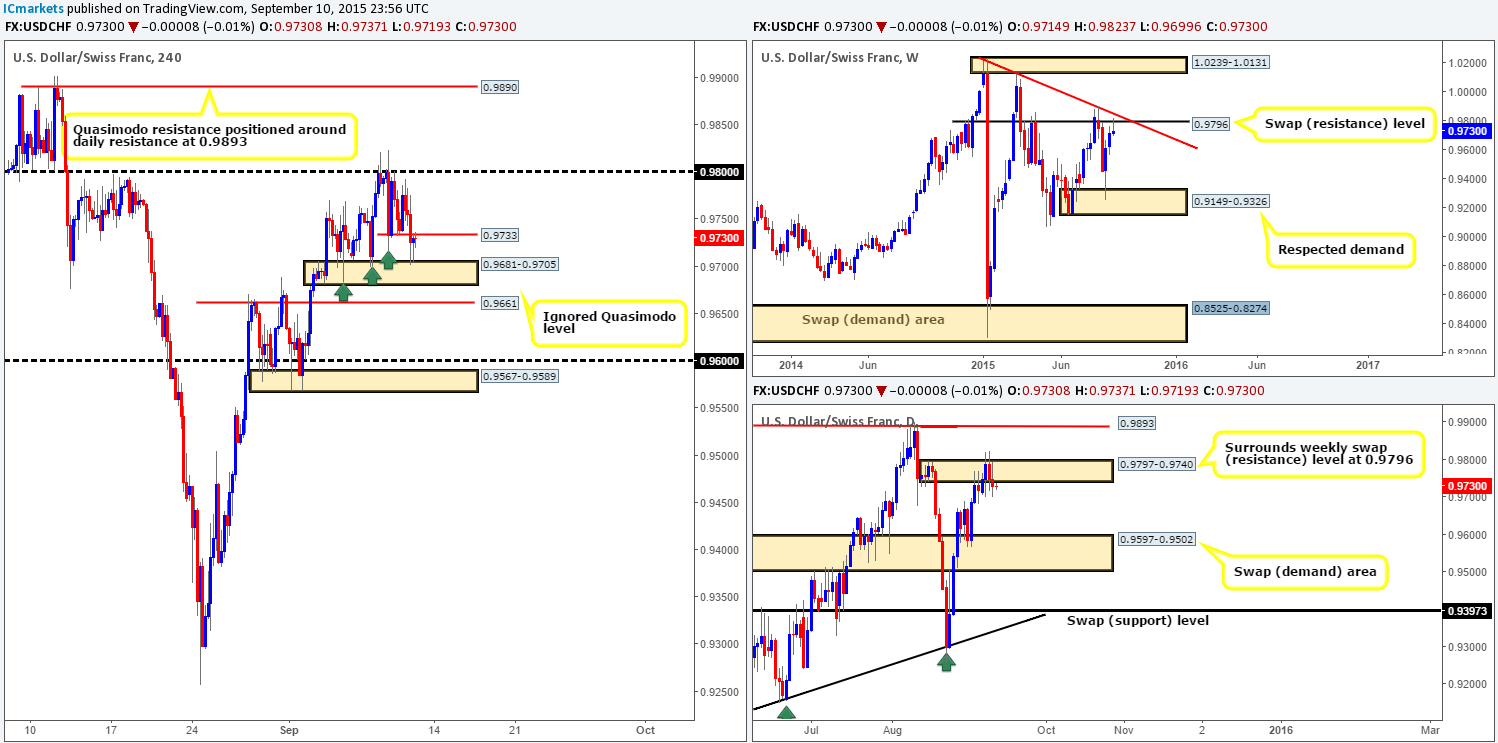
Overall, this market sold off during the course of yesterday’s trade down to 4hr demand coming in at 0.9681-0.9705, which, as you can see, is currently holding firm. However, we do not see price getting beyond the minor 4hr swap (resistance) level above at 0.9733 today – here’s why:
- A lovely-looking selling tail is currently printing on the weekly timeframe off the back of a weekly swap (resistance) level at 0.9796.
- Following a fakeout above daily supply at 0.9797-0.9740, price is presently trading lower.
In addition to the above, as we reported yesterday, we see very little active demand left below current price. Check out the obvious 4hr demand consumption tails seen marked with green arrows at 0.9686/0.9700/0.9715. This suggests that the path south could be relatively free down to a 4hr ignored Quasimodo level below at 0.9661. Although our bias remains firmly south on this pair for the moment, 0.9661 is likely going to repel price enough for a trade. That being the case, we may, depending on how the lower timeframe action responds here, take a small intraday scalp long from this Quasimodo barrier today, targeting the underside of what would then be supply at 0.9681.
Ultimately though, we do expect this level to eventually give way and head back down to 0.9600/4hr demand 0.9567-0.9589. It will be interesting to see how this plays out!
Levels to watch/ live orders:
- Buys: 0.9661 [Tentative – confirmation required] (Stop loss: dependent on where one confirms this level).
- Sells:Watch for bids to be consumed around 0.9661 and then look to enter on any retest seen at this number (confirmation required).
DOW 30:
Trade was relatively light yesterday in comparison to the past few days. Consequent to this, much of the following analysis will remain similar to the previous…
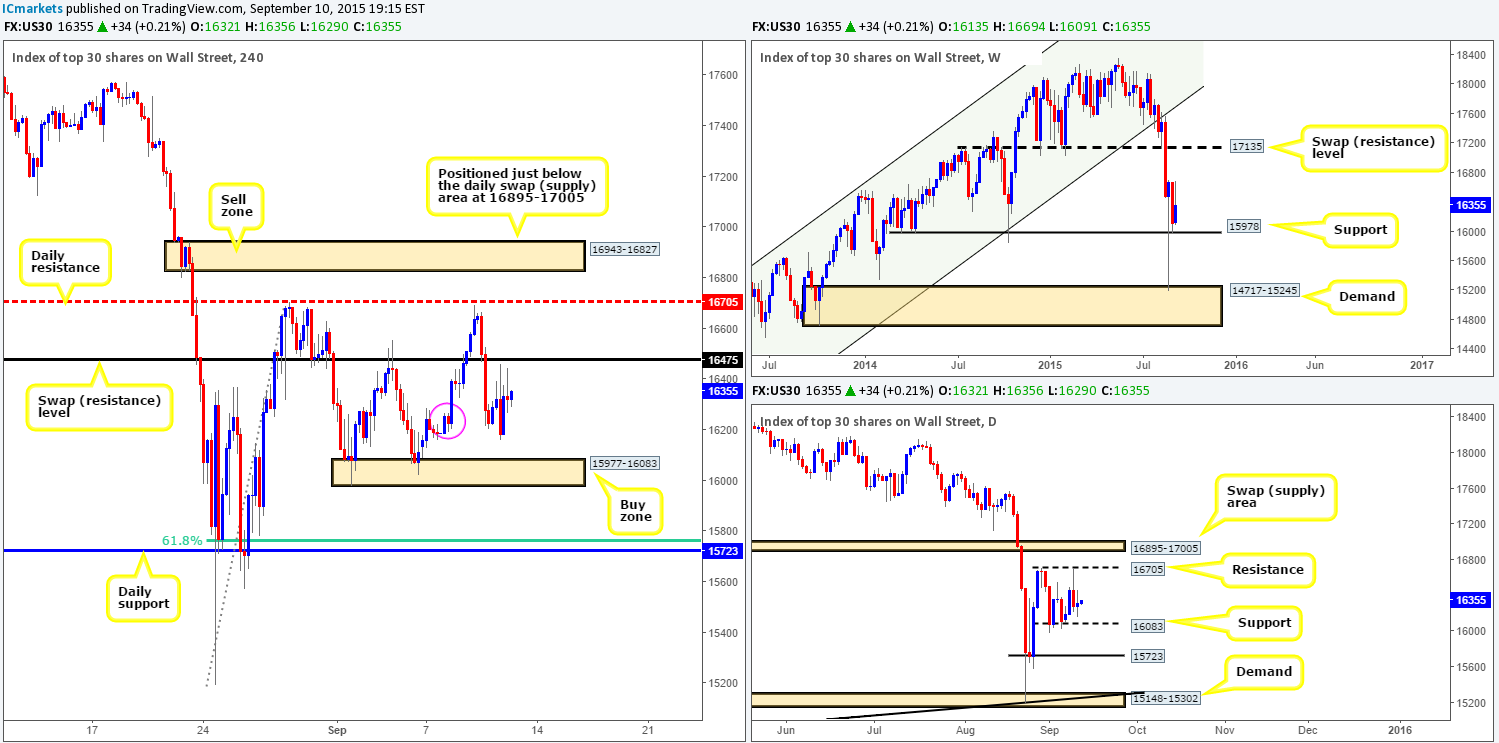
There were clearly active bids waiting in and around minor 4hr demand at 16191-16267 (pink circle) during trade yesterday. Price advanced north from here just missing the 4hr swap (resistance) level at 16475 by only a few points. However, following this flurry of buying activity, price did in fact end the day closing only 42 points higher than the open 16279, hence the indecision candle printed on the daily timeframe.
Overall, we still believe price is heading lower to the 4hr demand area at 15977-16083. The reason being is this zone is collectively made up of not only a weekly support at 15978, but also a daily support seen at 16083. Therefore, exactly the same as yesterday, today’s objective will consist of waiting to see if price reaches this 4hr barrier, and then begin looking for lower timeframe confirmed entries to buy into this market.
Levels to watch/ live orders:
- Buys:15977-16083 [Tentative – confirmation required] (Stop loss: depends on where one confirms this area).
- Sells:Flat (Stop loss: N/A).
XAU/USD: (Gold)
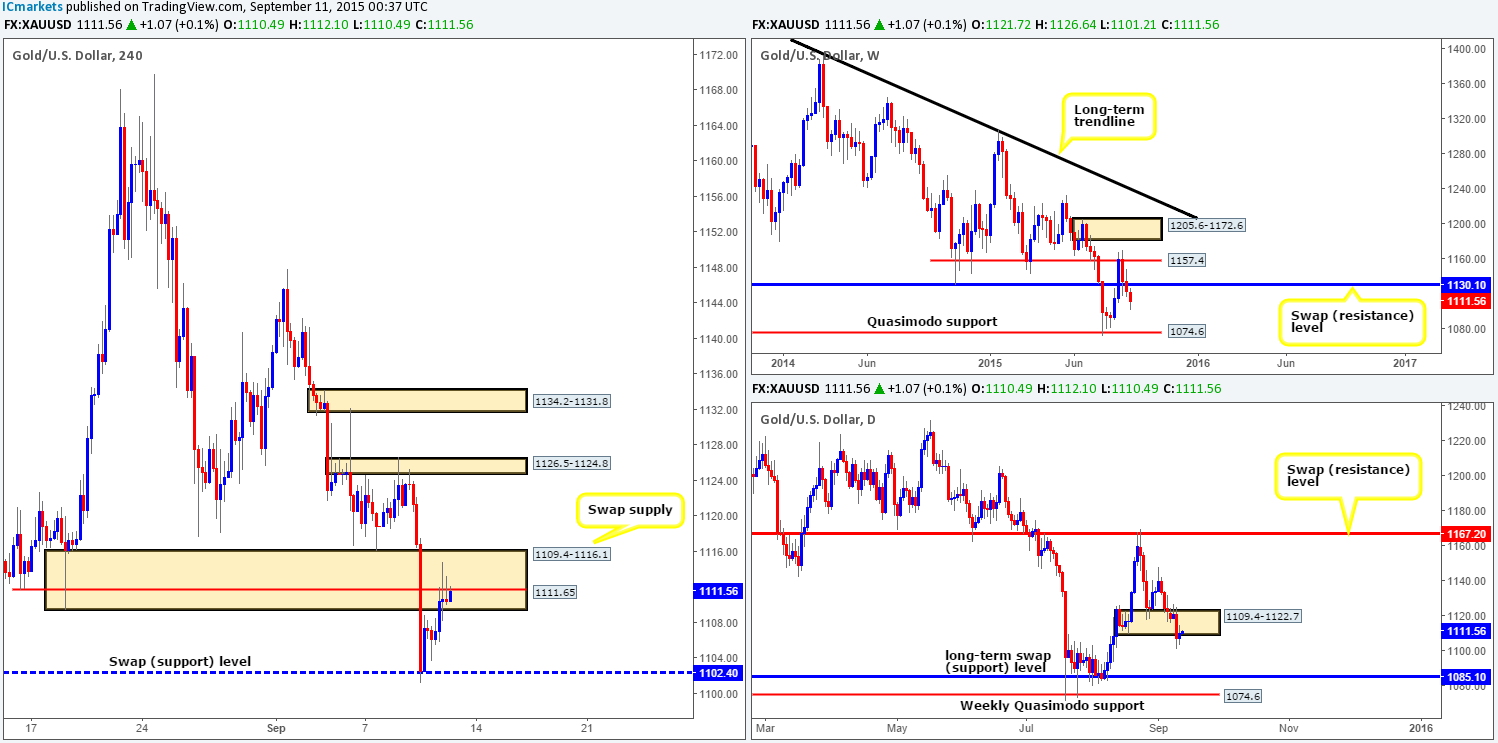
Amid yesterday’s trade, price held firm above the 4hr swap (support) level taken from 1102.4, which eventually pushed the buyers into the jaws of a 4hr swap (supply) zone at 1109.4-1116.1. What’s interesting here is the collection of selling wicks seen within this area. Check out how each wick neatly pierces a 4hr ignored Quasimodo level at 1111.6 indicating potential weakness. With this, where does our team stand in the bigger picture?
Over on the weekly timeframe we can see that following the close below support at 1130.1, price has continued to extend lower. The next downside target to keep an eye on from here, as far as we’re concerned, is situated around the weekly Quasimodo support barrier at 1074.6. Daily action on the other hand, shows that sell stops below daily demand at 1109.4-1122.7 have likely been cleared out, signaling possible room to continue lower down towards a daily swap (support) barrier at 1085.1.
Given the above, we’re satisfied there is potential weakness in this market at the moment. To that end, our attention will mostly be driven towards shorting (with lower timeframe confirmation) from the 1111.6 mark.
Levels to watch/ live orders:
- Buys: Flat (Stop loss: N/A).
- Sells: 1111.6 [Tentative – confirmation required] (Stop loss: dependent on where one confirms this level).


