
Key risk events today:
Limited.
(Previous analysis as well as outside sources – italics).
EUR/USD:
Weekly gain/loss: +0.07%
Weekly close: 1.1843
Weekly perspective:
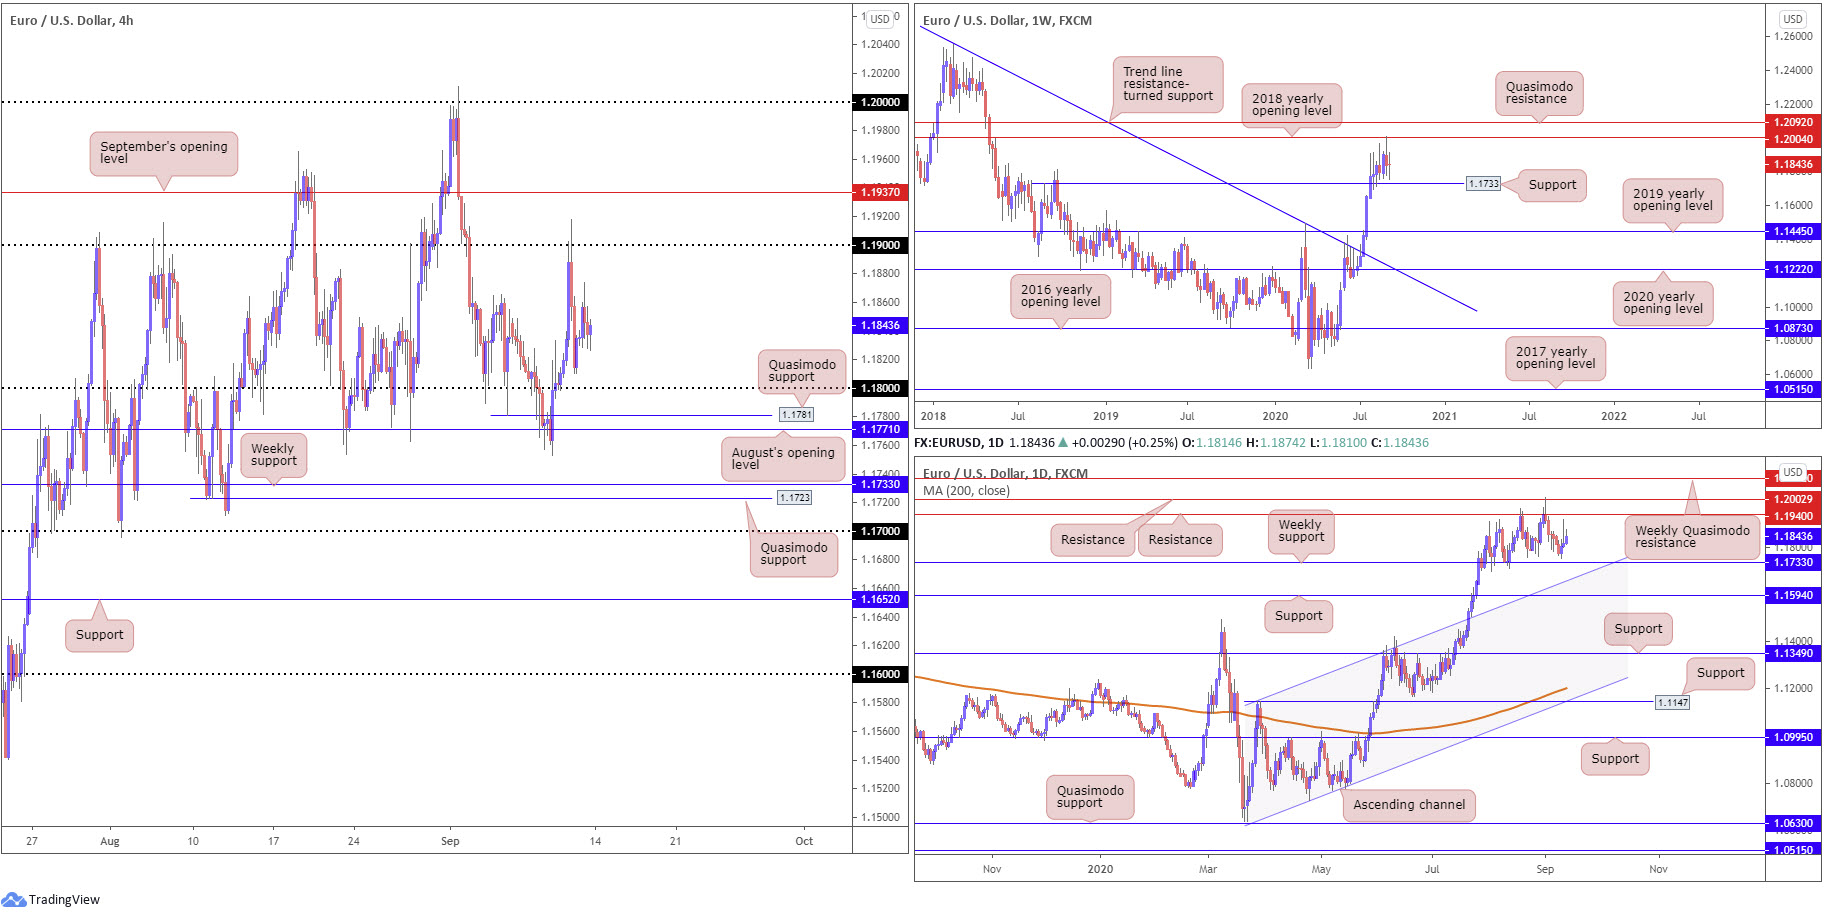
July, as you can see, witnessed vigorous upside, movement that overthrew trend line resistance, taken from the high 1.2555, and the 2019 yearly opening value at 1.1445.
August saw momentum noticeably slow, despite the end of July dipping a toe in waters above Quasimodo resistance at 1.1733. Since then we’ve seen the latter serve well as support, with price recently taking on resistance at 1.2004, the 2018 yearly opening value sited just south of Quasimodo resistance priced in at 1.2092.
Consequently, 1.1733 and 1.2004 are two prominent areas worth keeping a tab on this week.
Daily perspective:
Since transitioning into the month of August, weekly support, mentioned above at 1.1733, has proved useful on the daily timeframe, as has daily resistance coming in at 1.1940 and 1.2002.
Passing 1.2002 on the daily timeframe this week shifts focus to the weekly Quasimodo resistance mentioned above at 1.2092, whereas dipping sub 1.1733 on the daily scale could see price make its way to channel resistance-turned support, extended from the high 1.1147.
H4 perspective:
A closer reading of price action on the H4 timeframe reveals the unit concluded the week stationed between the 1.19/18 psychological levels.
Round numbers tend to attract a huge amount of orders, with the majority of traders tucking protective stop-loss orders 10-20 pips beyond these levels. Above 1.19, September’s opening value is seen at 1.1937. Beyond 1.18, Quasimodo support at 1.1781 can be seen, followed closely by August’s opening level at 1.1771. Breaking the latter could also have the weekly support level at 1.1733 make an appearance.
Areas of consideration:
- A fakeout through 1.18 into H4 Quasimodo support at 1.1781/August’s opening level at 1.1771 could be in store. Tripping sell-stop liquidity under 1.18, and perhaps luring fresh buyers off noted H4 supports, may be enough to generate a H4 close back above 1.18, creating a possible intraday buy signal this week.
- The same can be seen above 1.19 on the H4. Piercing 1.19 and testing September’s opening level at 1.1937 (while tripping buy-stop liquidity above the round number) may force a H4 close back under 1.19 and promote a bearish scenario. Note September’s opening level is also situated nearby daily resistance at 1.1940.
GBP/USD:
Weekly gain/loss: -3.64%
Weekly close: 1.2793
Weekly perspective:
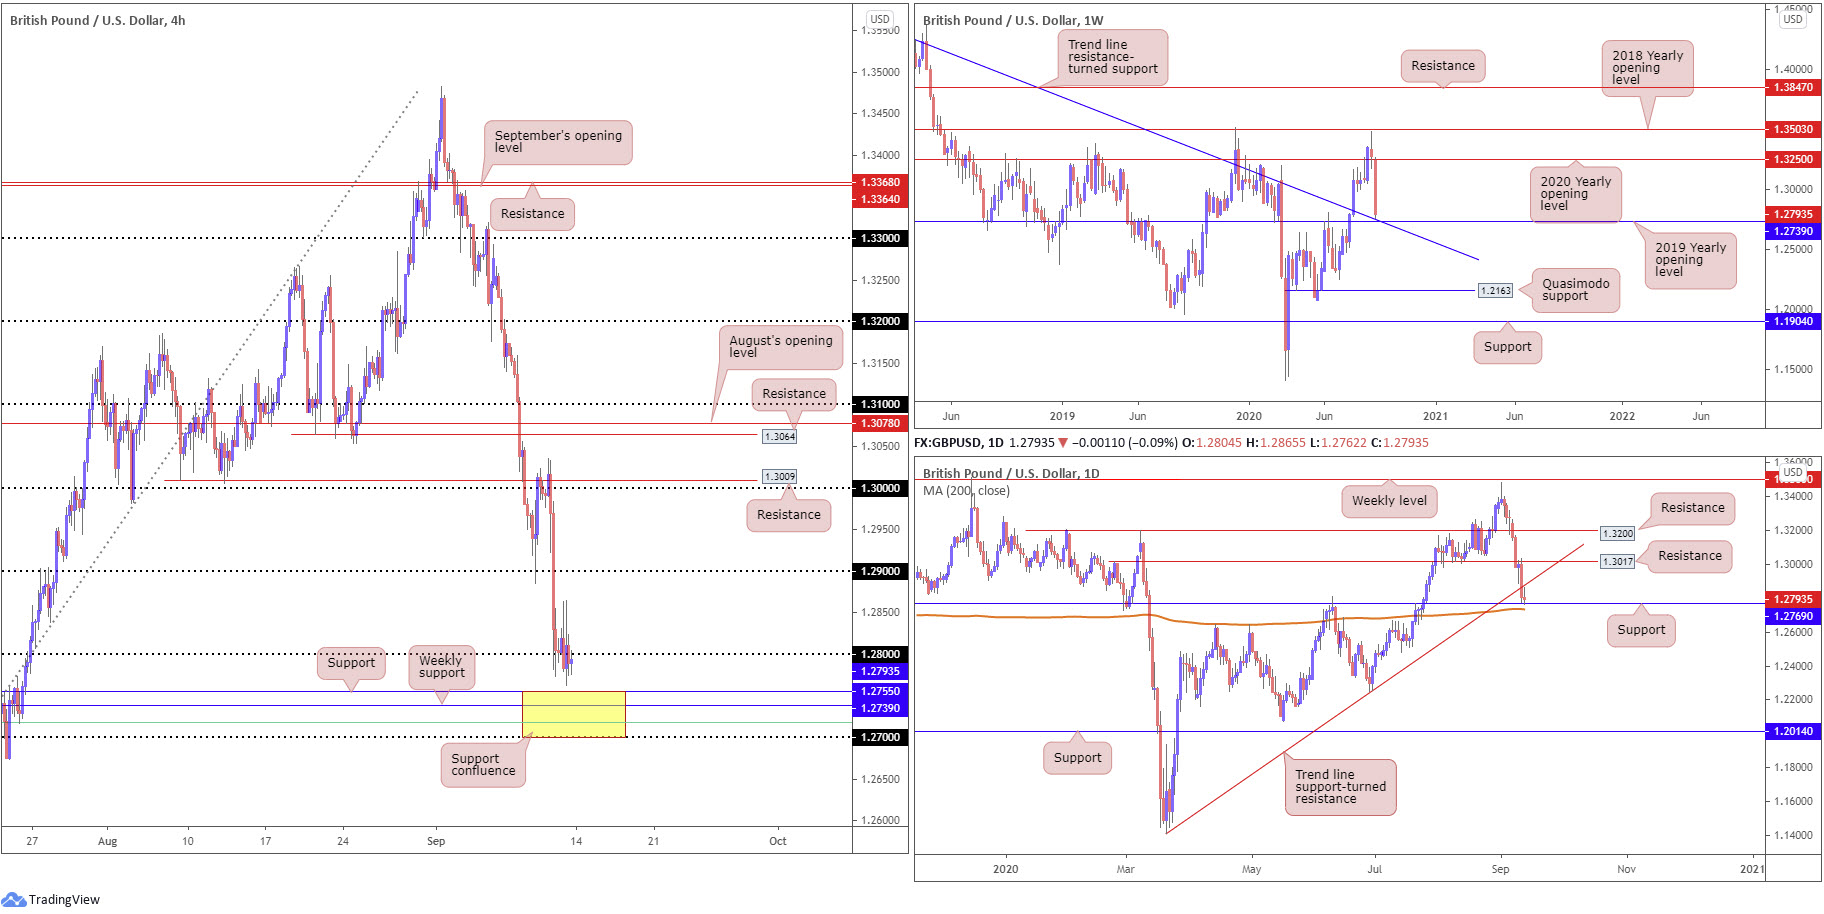
Sterling wrapped up the week erasing nearly 500 pips, its largest one-week loss against the buck since March.
Price squeezed out any remaining buyers from the 2020 yearly opening value at 1.3250 and concluded within touching distance of the 2019 yearly opening value at 1.2739, a level that merges closely with trend line resistance-turned support, extended from the high 1.5930.
In theory, crossing through 1.2739 this week unseals potential follow-through selling, targeting the 1.2251 June 29 low, closely shadowed by Quasimodo support priced in at 1.2163.
Daily perspective:
Thursday overpowered trend line support, taken from the low 1.1409, with Friday touching gloves with support drawn from 1.2769, located just north of the 200-day SMA (orange – 1.2735).
While support offered mild respite, the recently penetrated trend line support also served as resistance Friday, consequently triggering a bout of indecisive movement into the close.
Penetrating current support immediately throws weekly support at 1.2739 (2019 yearly opening level) into the fray, currently connecting closely with the 200-day SMA.
Moves to the upside on the daily scale, assuming we crank back above trend line resistance, points to resistance plotted at 1.3017.
H4 perspective:
Thursday’s precipitous decline led sterling 1.5% lower against the US dollar, leading to 1.28 entering the fold. Friday exhibited a cautious stance, likely tormenting lower timeframe traders that attempted to establish a position around the psychological level.
The recent decline also shed light on an interesting area of support between 1.27/1.2755 (yellow), made up of 1.27 on the H4, a 61.8% Fibonacci retracement ratio at 1.2718 (green), weekly support at 1.2739 and H4 support at 1.2755. Note also that the 200-day SMA and trend line support on the weekly timeframe lurks within the aforementioned zone.
Areas of consideration:
The 1.27/1.2755 area (yellow) may provide some much-needed respite this week, therefore intraday bearish strategies executed sub 1.28 may find a steep road bump just ahead.
Conservative traders watching 1.27/1.2755 as a possible reversal zone will likely want to observe a H4 close form back above 1.28 before committing, with daily trend line resistance set as the initial target, followed by 1.29 on the H4.
AUD/USD:
Weekly gain/loss: +0.02%
Weekly close: 0.7282
Weekly perspective:
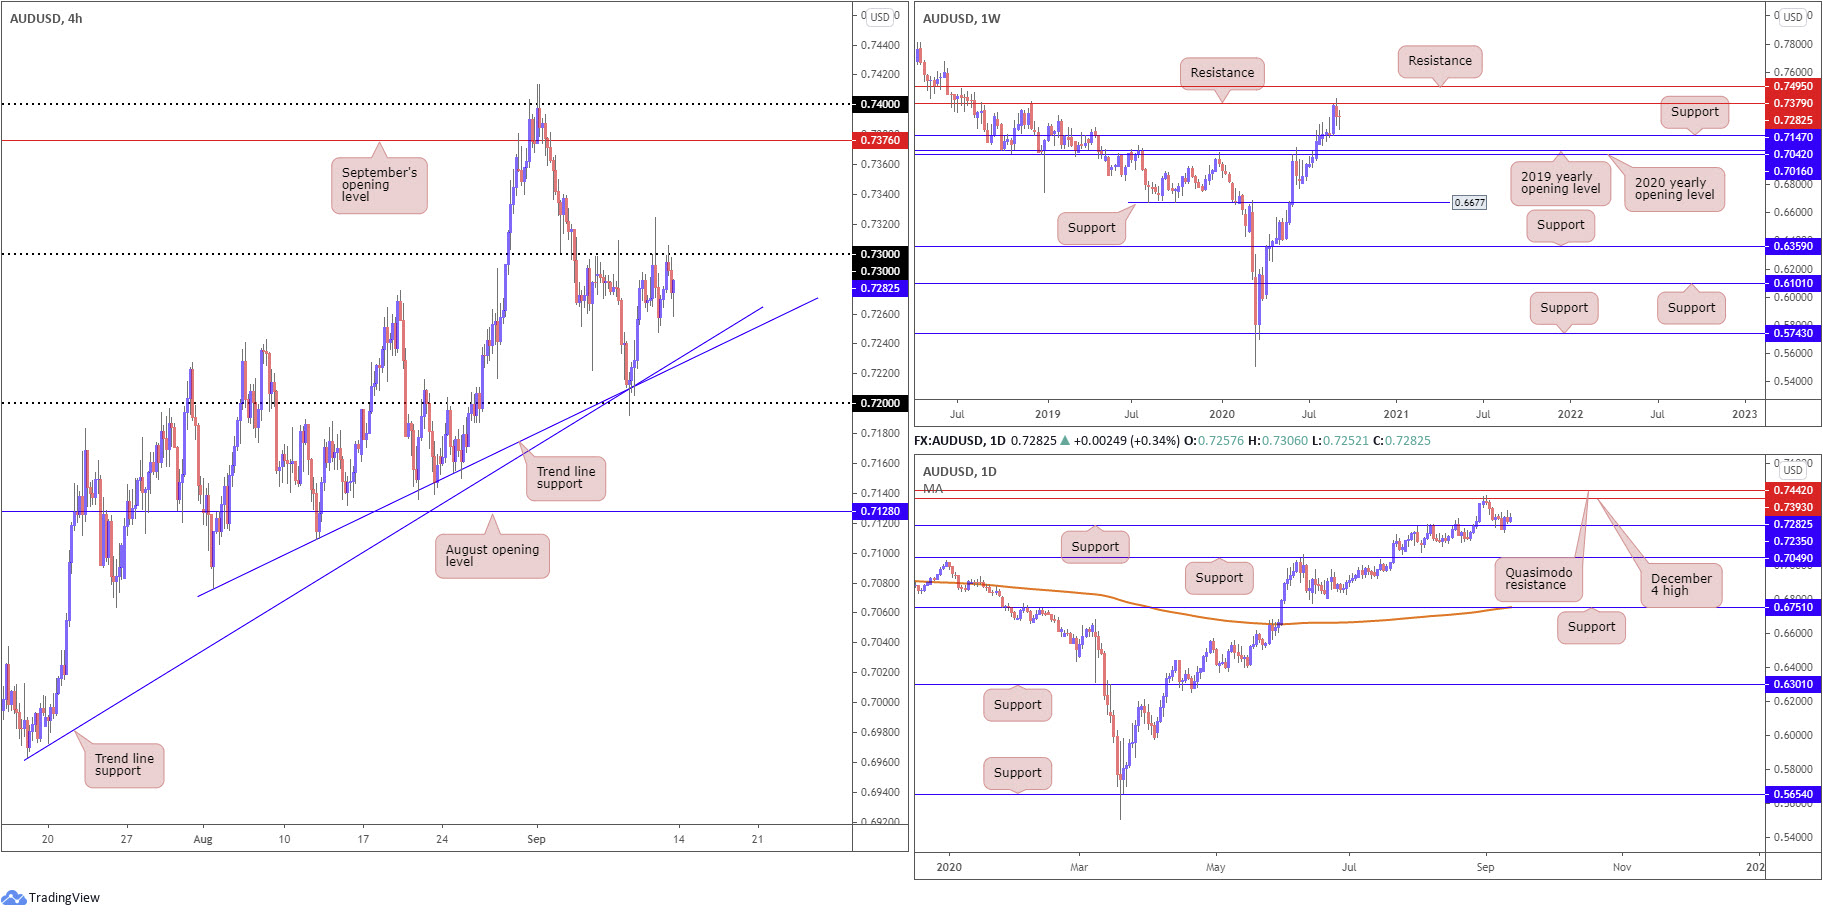
Sellers south of resistance at 0.7379 failed to sustain downside momentum past 0.7191 in recent trading, leaving nearby support from 0.7147 unchallenged.
Having seen this market trend higher since bottoming at 0.5506 in late March, the odds of price surging through current resistance and heading for another layer of resistance at 0.7495 are high. Exploring territory under current support, however, shines the spotlight on the 2020 and 2019 yearly opening levels at 0.7016 and 0.7042, respectively.
Daily perspective:
The week failed to glean much support from 0.7235 on the daily timeframe, with the second half of the session chalking up back-to-back shooting star candlestick patterns (bearish signals).
To the upside, resistance at 0.7393 (December 4 high) commands attention, a level that capped upside heading into September ahead of Quasimodo resistance at 0.7442. Overthrowing 0.7235 this week, as recent candle action suggests, shifts focus to as far south as support at 0.7049.
H4 perspective:
Following Wednesday’s upbeat recovery from two trend line supports (0.7076/0.6963) and the 0.72 handle, 0.73 made its way back into view, and, despite multiple attempts to oust the level last week, remained resistance into the close. A break above 0.73 could have bullish themes take over and approach September’s opening level at 0.7376. The latter, as aired in previous writing, is located close by weekly resistance at 0.7379 and daily resistance at 0.7393.
Areas of consideration:
Although 0.73 has indeed proven a tough nut to crack, it appears sellers may be loosening their grip. In addition to Thursday’s spike to 0.7324 potentially filling the majority of sellers’ protective stop loss orders above the round number, the lack of downside pressure seen since informs observers that buyers are likely taking control.
A H4 close above 0.73 might arouse breakout buyers; a retest at the round number following a close higher could also tempt conservative players into the fight. Irrespective of the entry technique, 0.74/0.7376 offers a logical upside target this week.
USD/JPY:
Weekly gain/loss: -0.07%
Weekly close: 106.13
Weekly perspective:
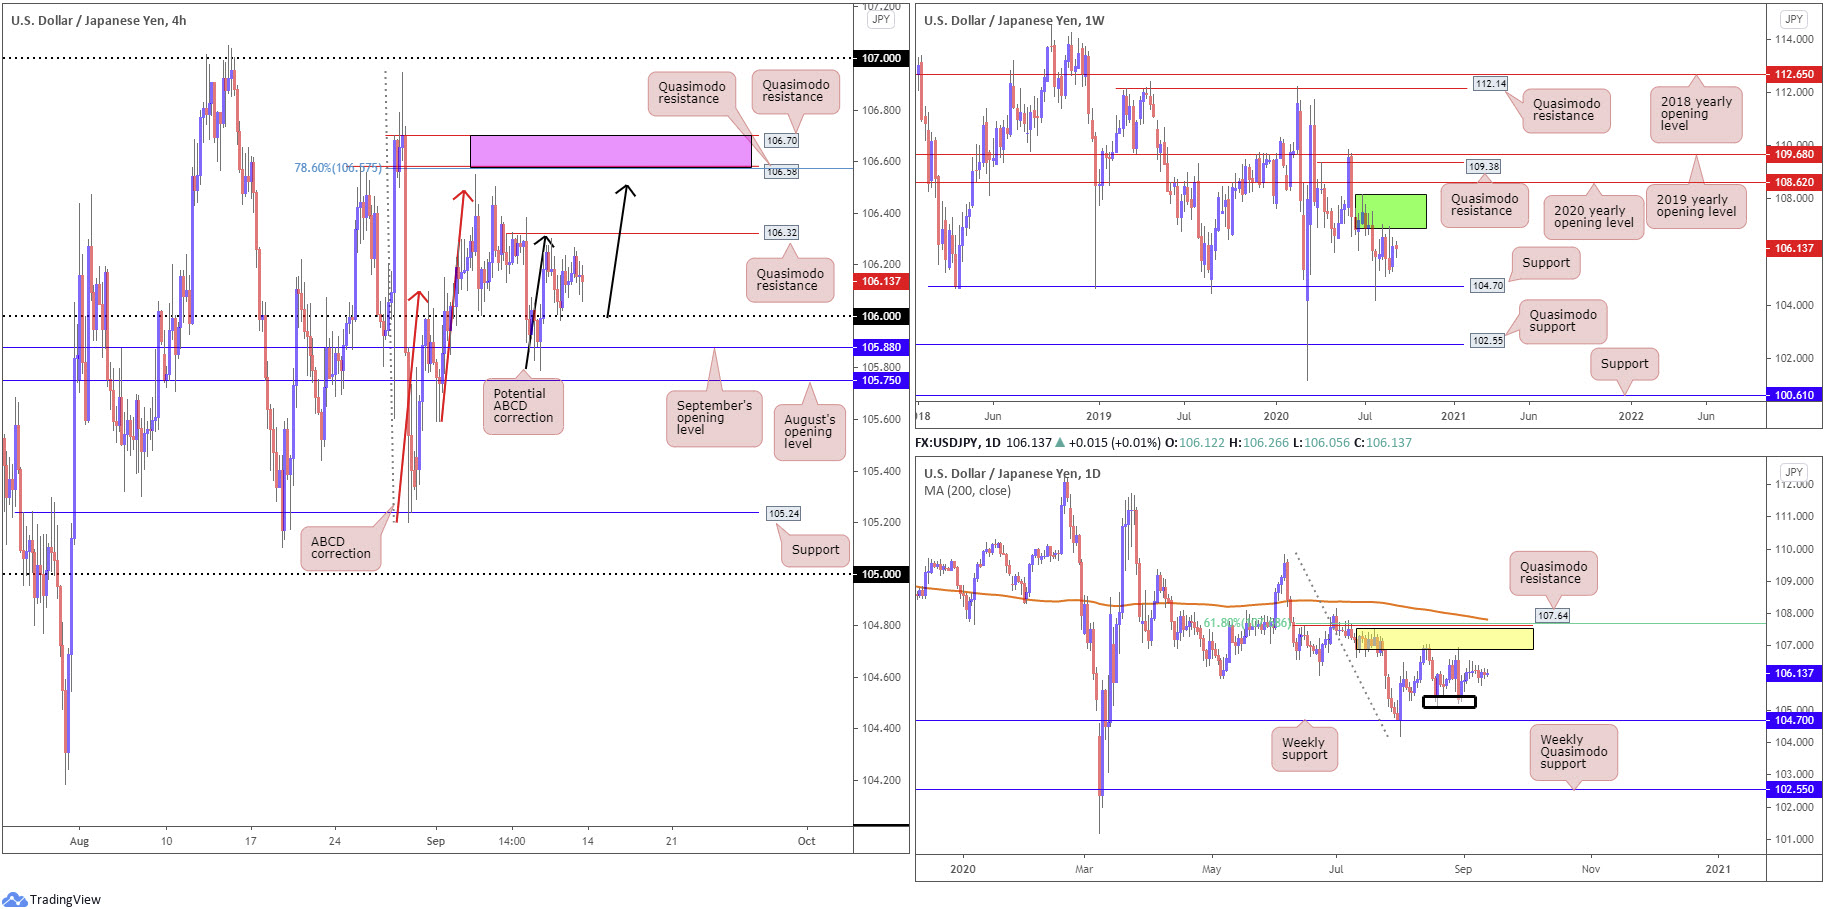
Supply remains prominent at 108.16-106.88 (dark green) on the weekly timeframe, capping upside since price made its way off support at 104.70 at the end of July.
Should buyers govern control, the 2020 yearly opening level at 108.62 may eventually enter view, closely tracked by Quasimodo resistance at 109.38 and the 2019 yearly opening level at 109.68.
Daily perspective:
Supply at 107.55/106.89 (yellow), an area housed within the lower boundary of weekly supply mentioned above at 108.16-106.88, has proved tough to overthrow. Downside from current price has lows at 105.20ish to target (black zone), with a break exposing weekly support underlined above at 104.70.
In the event buyers climb, however, Quasimodo resistance is stationed at 107.64, reinforced by a 61.8% Fibonacci retracement ratio at 107.68 and 200-day SMA (orange – 107.81).
H4 perspective:
Friday observed USD/JPY fluctuate within a narrow 20-pip range, mid-way between the 106 handle and Quasimodo resistance at 106.32.
Breaking 106.32 features two Quasimodo formations at 106.58 (merges with 78.6% Fibonacci resistance at 106.57) and 106.70 (pink), as well as possible ABCD bearish structure circling 106.50 (black arrows). Passing under 106 this week, nonetheless, trips sell-stop liquidity and directs attention back to September’s opening value at 105.88, as well as August’s opening level at 105.75.
Areas of consideration:
- A reaction from H4 Quasimodo resistance at 106.32 is possible this week, though many traders will seek additional confirmation before committing given the level’s lack of confluence, both locally and on the higher timeframes.
- Should buyers take out H4 Quasimodo resistance at 106.32, intraday bullish scenarios may be on the cards to ABCD H4 resistance at 106.50 and 106.70/106.58, followed by a possible run to the underside of higher timeframe supplies around 106.88ish and 107 resistance (H4).
- An intraday fakeout through 106 may also come about this week, movement that tests September’s opening level at 105.88. A H4 close above 106, off 105.88, might be interpreted as an intraday bullish signal.
USD/CAD:
Weekly gain/loss: +0.87%
Weekly close: 1.3050
Weekly perspective:
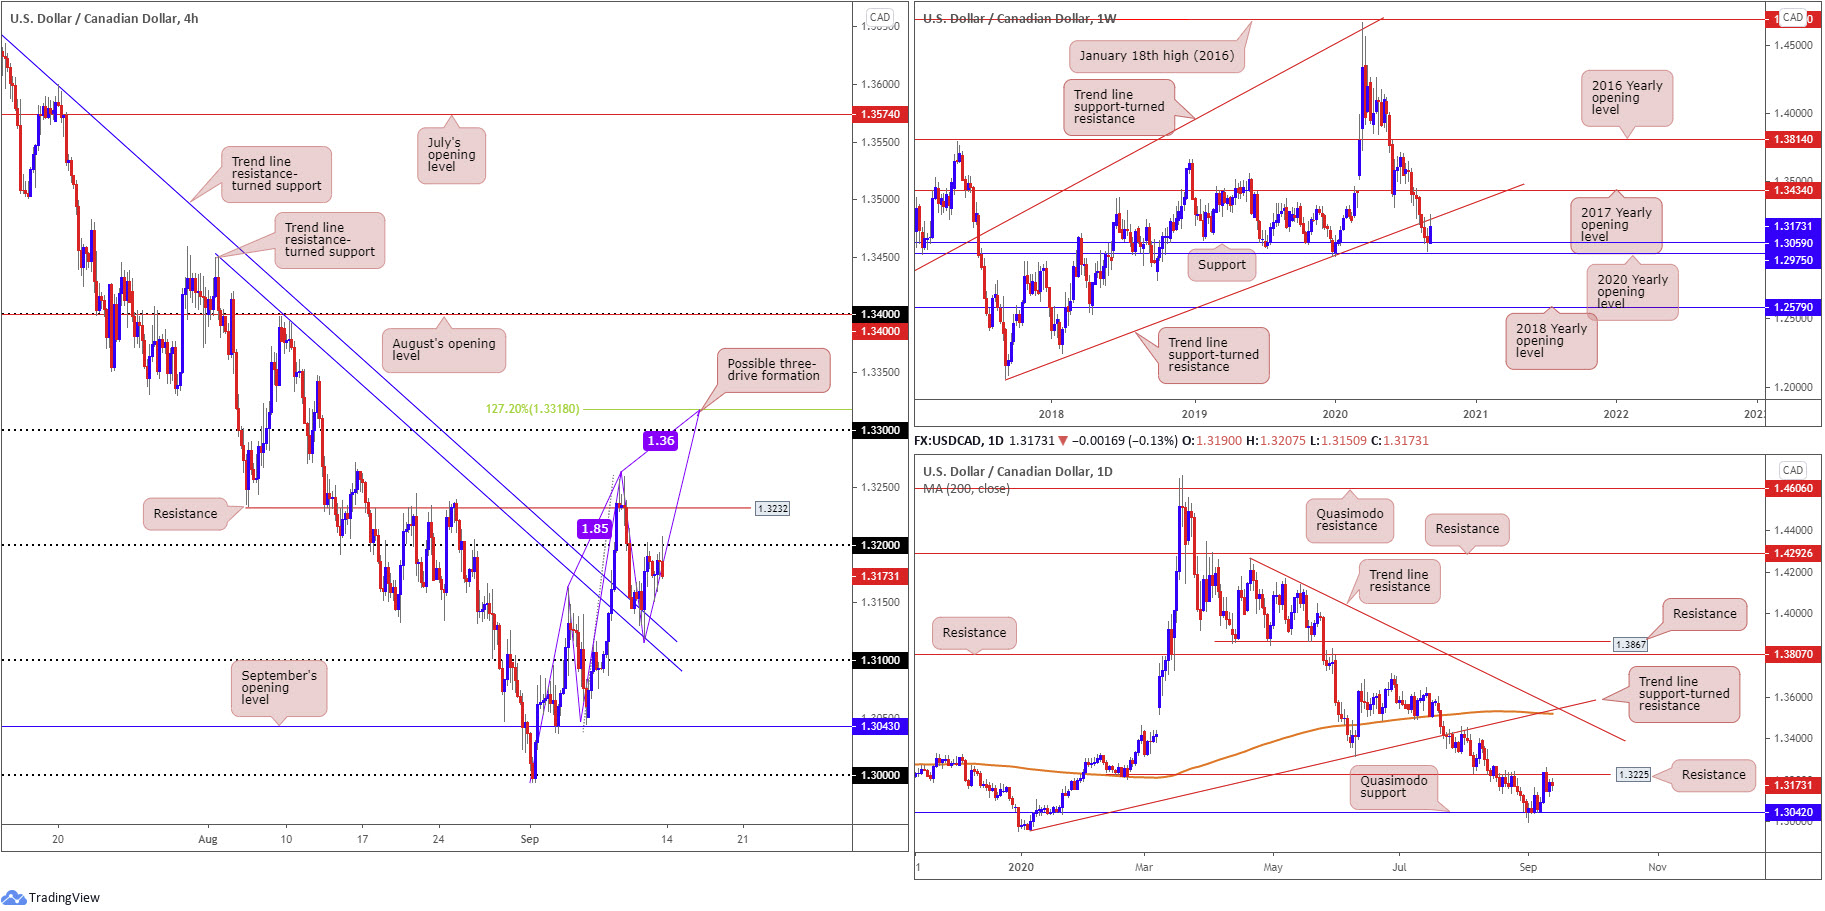
Snapping an eight-week bearish phase, USD/CAD staged a stronger-than-expected recovery last week off support at 1.3059 (pinned just north of the 2020 yearly opening level at 1.2975). This led to trend line support-turned resistance, taken from the low 1.2061, making an appearance, commanding enough of a presence to generate a mild end-of-week correction.
Continued upside this week highlights the 2017 yearly opening level at 1.3434 as potential resistance.
Daily perspective:
Quasimodo support at 1.3042 remained a notable base going into the week, with the buck latching onto a strong bid in early trading to shake hands with resistance at 1.3225, a prior Quasimodo support.
Interest from the aforementioned resistance was expected having seen the level merge with weekly trend line resistance. In terms of resistance beyond 1.3225 this week, we do not see much to hang our hat on until crossing swords with trend line resistance, etched from the high 1.4265, which happens to align closely with trend line support-turned resistance, taken from the low 1.2957, and the 200-day SMA (orange – 1.3520). However, before reaching the said daily levels, we must contend with weekly resistance around 1.3434.
H4 perspective:
USD/CAD witnessed limited movement Friday, clinging to the underside of the 1.32 handle, following Thursday’s recovery from two trend line resistances-turned support, extended from highs 1.3646 and 1.3451.
Brushing aside 1.32 this week turns attention back to resistance at 1.3232, with a break perhaps exposing the 1.33 handle and a possible three-drive completion at the 127.2% Fibonacci extension point at 1.3318. Traders may also wish to acknowledge the H4 resistance (1.3232) boasts a close connection with daily resistance at 1.3225.
Areas of consideration:
On one side, weekly support at 1.3059 and daily Quasimodo support at 1.3042 made an appearance early last week, prompting a bullish move. On the other side we recently had weekly price test trend line resistance and daily price probe resistance from 1.3225.
With the above in mind, seeking bullish scenarios above 1.32 on the H4 could prove frustrating, hindered by daily resistance from 1.3225 and H4 resistance at 1.3232. A sell-off from 1.3232/1.32, therefore, could take hold this week, bolstered by weekly price also recently engaging trend line resistance and the market trending lower since mid-March.
Climbing above 1.3232 this week, nevertheless, ignites the possibility of bullish themes and places 1.33 on the H4 in the firing range (and a three-drive pattern completion around 1.3318).
USD/CHF:
Weekly gain/loss: -0.49%
Weekly close: 0.9087
Weekly perspective:
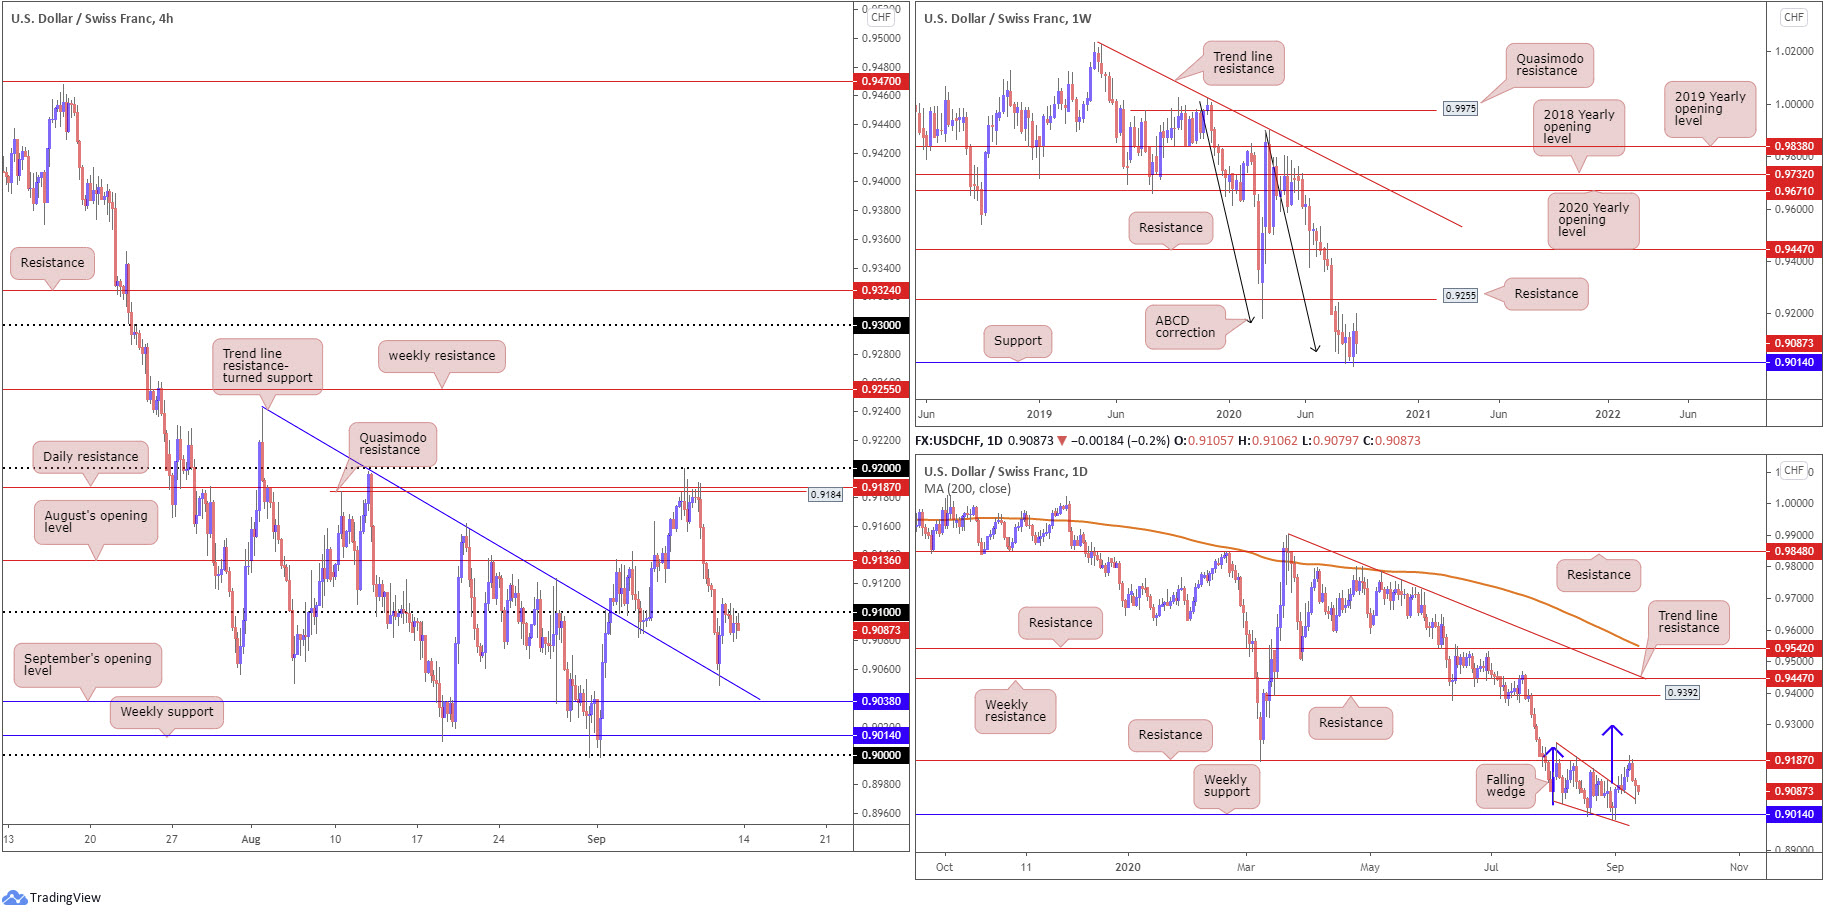
As you can see, buyers and sellers continue to battle for position north of support at 0.9014, potentially gleaning additional impetus from ABCD support at 0.9051 (black arrows). The prior week’s recovery seemed promising, engulfing the previous weekly range. Last week, however, failed to capitalise on recent upside and fell 40 pips.
Resistance at 0.9255, a previous Quasimodo support level, calls for attention should we transition north this week.
Daily perspective:
The month of August saw candle action forge a falling wedge pattern, pencilled in from the high 0.9241 and a low of 0.9056.
The beginning of September saw the upper border of the falling wedge give way, consequently unlocking a bullish reversal signal. Resistance at 0.9187 swiftly put a lid on gains, however, directing a retest at the falling wedge late last week, in the shape of a hammer candlestick formation (bullish signal).
Should we see buyers take over from current price and upset resistance at 0.9187, the falling wedge take-profit target could be the next port of call around 0.9294 (blue arrows).
H4 perspective:
USD/CHF wrapped up Thursday considerably off session lows, recoiling from a H4 trend line resistance-turned support, taken from the high 0.9241 (represents the upper limit of the falling wedge on the daily timeframe).
Thursday marginally penetrated 0.91 to the upside, yet failed to sustain gains on Friday, ending the session in mildly negative territory under the round number. Above the latter, August’s opening level at 0.9136 steps into view, while brushing aside this base could see H4 Quasimodo resistance at 0.9184 make a show (and daily resistance at 0.9187).
Failing to overturn 0.91 this week, nevertheless, sends across a potential bearish scenario back to the aforementioned trend line support and September’s opening level at 0.9038.
Areas of consideration:
With daily price finishing the week above the upper boundary of its falling wedge configuration, along with H4 failing to eke out much of a bearish phase under 0.91, this could have buyers attempt to make a run for August’s opening level at 0.9136 (H4) early this week, with the possibility of revisiting daily resistance at 0.9187.
Breakout buyers north of 0.91 could latch on to the breakout candle’s close as a means of entry; other traders might seek a retest at the round number before pulling the trigger.
Dow Jones Industrial Average:
Weekly gain/loss: -1.54%
Weekly close: 27644
Weekly perspective:
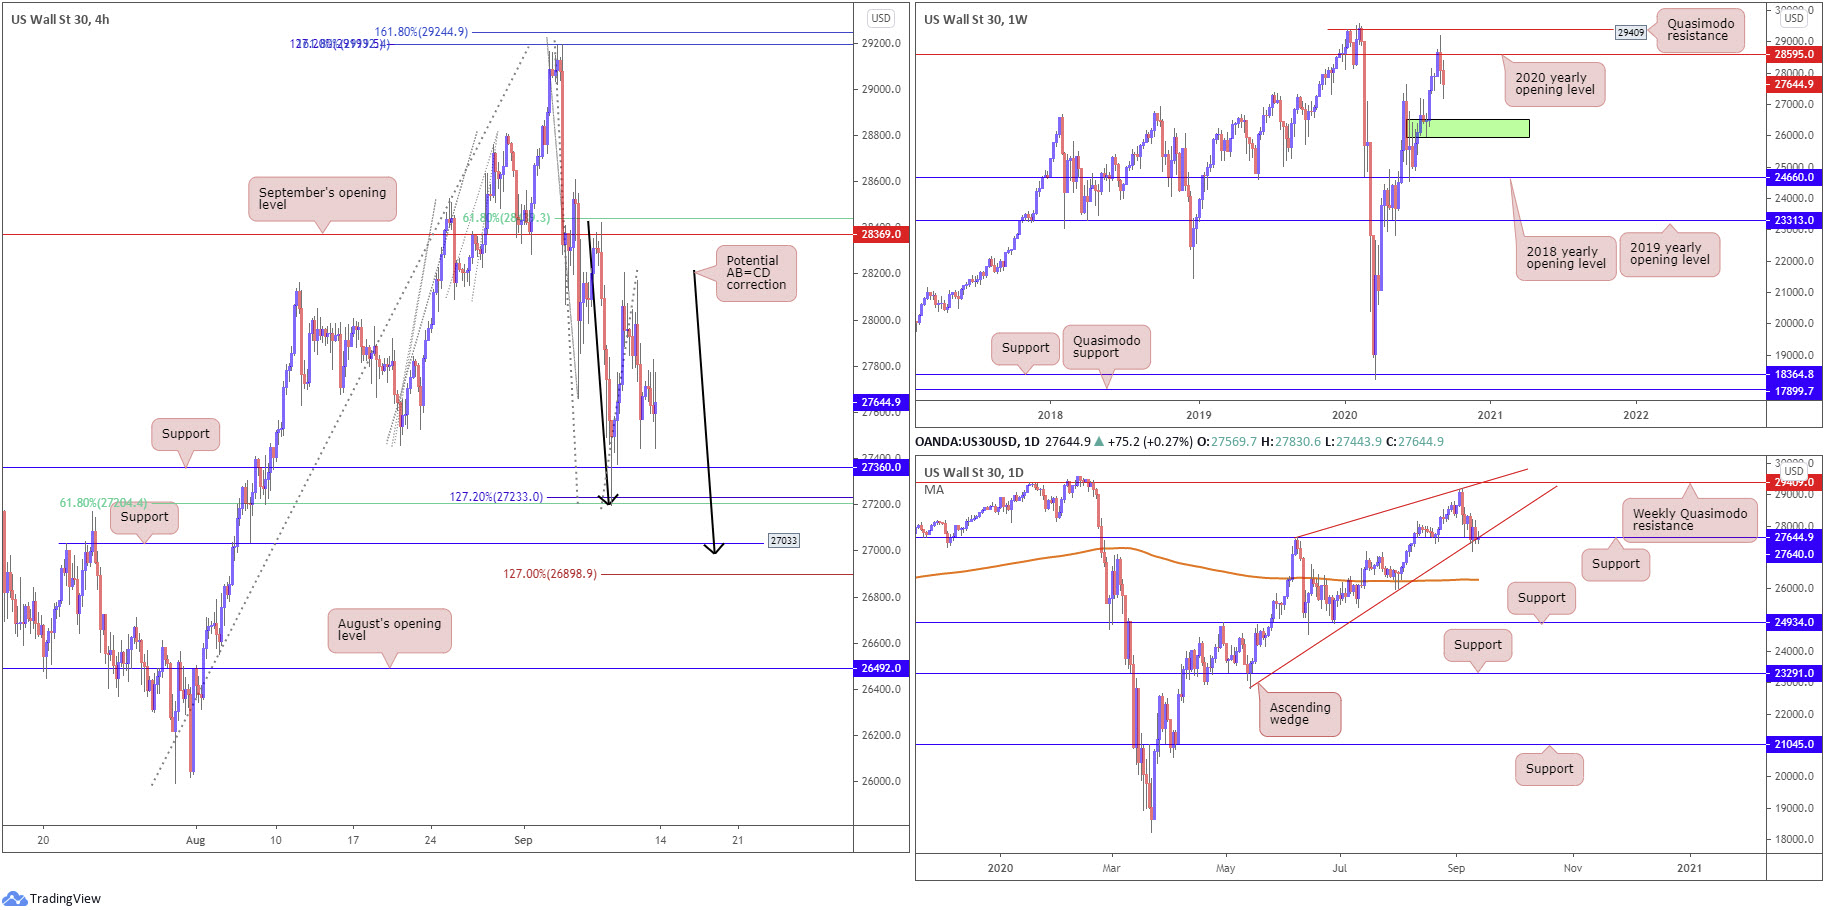
The week, as you can see, ended eking out a second consecutive weekly loss, deriving technical impetus from the recent rejection off the 2020 yearly opening value at 28595 (sited just under Quasimodo resistance at 29409).
Additional bearish sentiment this week advertises demand (green) at 25916-26523, an area active buyers may try and defend.
Daily perspective:
The lower limit of an ascending wedge, taken from the low 22803, along with support from 27640, continues to hinder downside on the daily timeframe. Rupturing the aforementioned supports this week could lead to price crossing paths with the 200-day SMA (orange – 26294), while a recovery phase positions the 2020 yearly opening level at 28595 (weekly timeframe) back in the firing range.
H4 perspective:
Friday had the Dow Jones Industrial Average advance 131.06 points, or 0.48%; the S&P 500 advanced 1.78 points, or 0.05% and the Nasdaq traded lower by 66.05 points, or 0.60%.
Technically, the H4 timeframe reveals price hovering north of support at 27360, shadowed closely by a 127.2% Fibonacci extension point at 27233 and a 61.8% Fibonacci retracement ratio at 27204. Beyond the latter, we’re watching support at 27033, a level that joins closely with a potential AB=CD correction (black arrows) at 26985 and 1.27% BC projection at 26898.
Turning to higher levels this week calls for last Wednesday’s high at 28206, with September’s opening level at 28369 resting as the next point of interest should further buying emerge.
Areas of consideration:
- Weekly suggests sellers may attempt to explore lower levels south of resistance at 28595.
- Daily price reveals the lower limit of the ascending wedge and support at 27640 could invite a recovery this week.
- H4 support found between 27204/27360 could hamper downside this week and perhaps promote bullish themes, as could H4 support at 27033 and joining AB=CD correction. It is also worth pencilling in September’s opening level at 28369 from the H4, having seen its connection with a 61.8% H4 Fibonacci retracement ratio at 28439.
XAU/USD (GOLD):
Weekly gain/loss: +0.33%
Weekly close: $1,940.45
Weekly perspective:
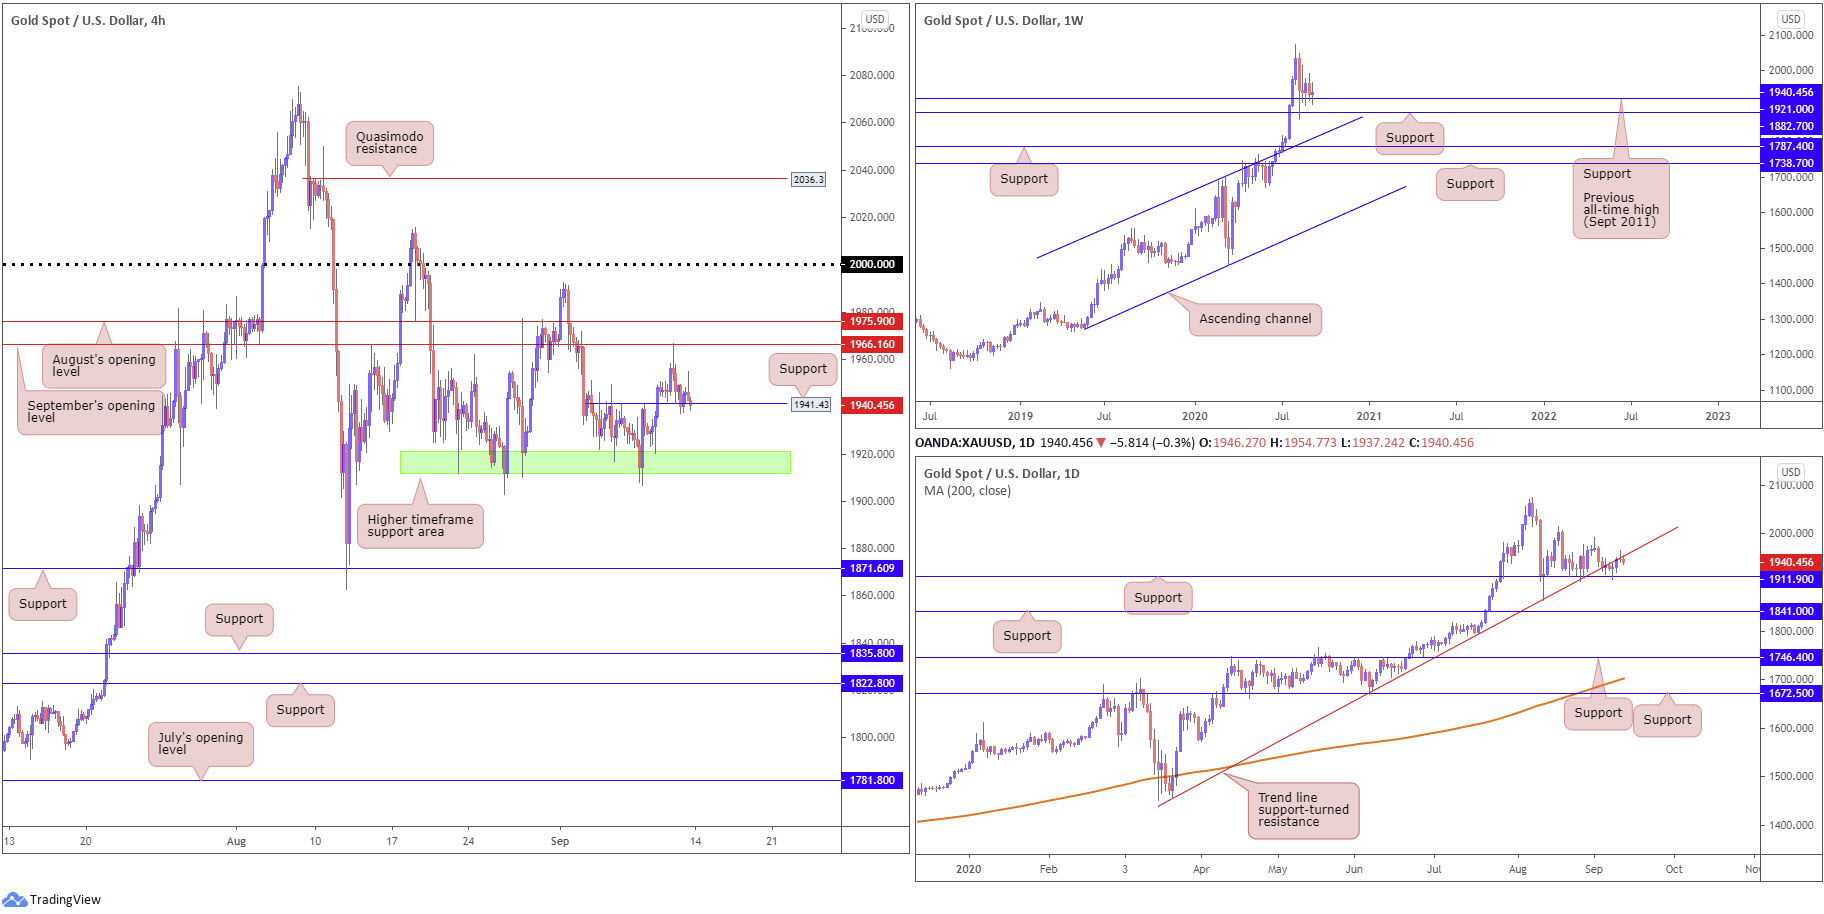
Spot gold finished the week in modestly positive territory, trading from $1,921.00 support (located ahead of support at $1,882.70), the previous major all-time high (September 2011). Though many traders will acknowledge the week concluded by way of a neutral doji indecision candle.
With the current trend trekking north since 2016, the combination of $1,882.70 and $1,921.00 may be enough to encourage additional buying this week, with most targeting all-time peaks at $2,075.28 as the initial point.
Failure to hold gains could see channel resistance-turned support, etched from the high $1,703.28, enter view.
Daily perspective:
Trend line support-turned resistance, taken from the low $1,455.32, swerved into view in the second half of last week, following an earlier rally from support priced in at $1,911.90. Technical traders will also acknowledge Thursday’s session pencilled in a shooting star candlestick pattern (a bearish signal).
Further buying this week targets the $1,992.56 September 1 high and the $2,015.72 August 18 high. A dip to lower terrain, on the other hand, will draw weekly support mentioned above at $1,882.70 into the frame.
H4 perspective:
For those who read recent analysis on XAU/USD you may recall the following (italics):
H4 action recently made headway north of a familiar area of higher timeframe support at $1,911.90-$1,921.00 (green). This was a noted base to keep eyeballs on from the H4. Areas to watch, should an advance materialise, are September’s opening value at $1,966.16 and August’s opening value coming in at $1,975.90.
As evident from the H4 chart, bullion did indeed challenge September’s opening value and has since retreated to test the mettle of intraday support located at $1,941.43.
Areas of consideration:
- Overall, this remains a buyers’ market, according to the current trend.
- Traders long $1,911.90-$1,921.00 will likely be watching H4 support at $1,941.43 to hold. Breaking here indicates daily sellers are perhaps strengthening their grip off trend line resistance, whereas holding suggests higher timeframe buyers could take aim at higher levels off weekly support from $1,921.00.
- A notable H4 bullish candlestick configuration printed from $1,941.43 also provides opportunity for fresh buying.
- Clearing August’s opening value at $1,975.90 (H4) this week may have price make its way to the $2,000.00 level.
The accuracy, completeness and timeliness of the information contained on this site cannot be guaranteed. IC Markets does not warranty, guarantee or make any representations, or assume any liability regarding financial results based on the use of the information in the site.
News, views, opinions, recommendations and other information obtained from sources outside of www.icmarkets.com.au, used in this site are believed to be reliable, but we cannot guarantee their accuracy or completeness. All such information is subject to change at any time without notice. IC Markets assumes no responsibility for the content of any linked site.
The fact that such links may exist does not indicate approval or endorsement of any material contained on any linked site. IC Markets is not liable for any harm caused by the transmission, through accessing the services or information on this site, of a computer virus, or other computer code or programming device that might be used to access, delete, damage, disable, disrupt or otherwise impede in any manner, the operation of the site or of any user’s software, hardware, data or property.


