
A note on lower timeframe confirming price action…
Waiting for lower timeframe confirmation is our main tool to confirm strength within higher timeframe zones, and has really been the key to our trading success. It takes a little time to understand the subtle nuances, however, as each trade is never the same, but once you master the rhythm so to speak, you will be saved from countless unnecessary losing trades. The following is a list of what we look for:
- A break/retest of supply or demand dependent on which way you’re trading.
- A trendline break/retest.
- Buying/selling tails – essentially we look for a cluster of very obvious spikes off of lower timeframe support and resistance levels within the higher timeframe zone.
- Candlestick patterns. We tend to only stick with pin bars and engulfing bars as these have proven to be the most effective.
For us, lower timeframe confirmation starts on the M15 and finishes up on the H1, since most of our higher timeframe areas begin with the H4. Stops usually placed 5-10 pips beyond your confirming structures.
EUR/USD:
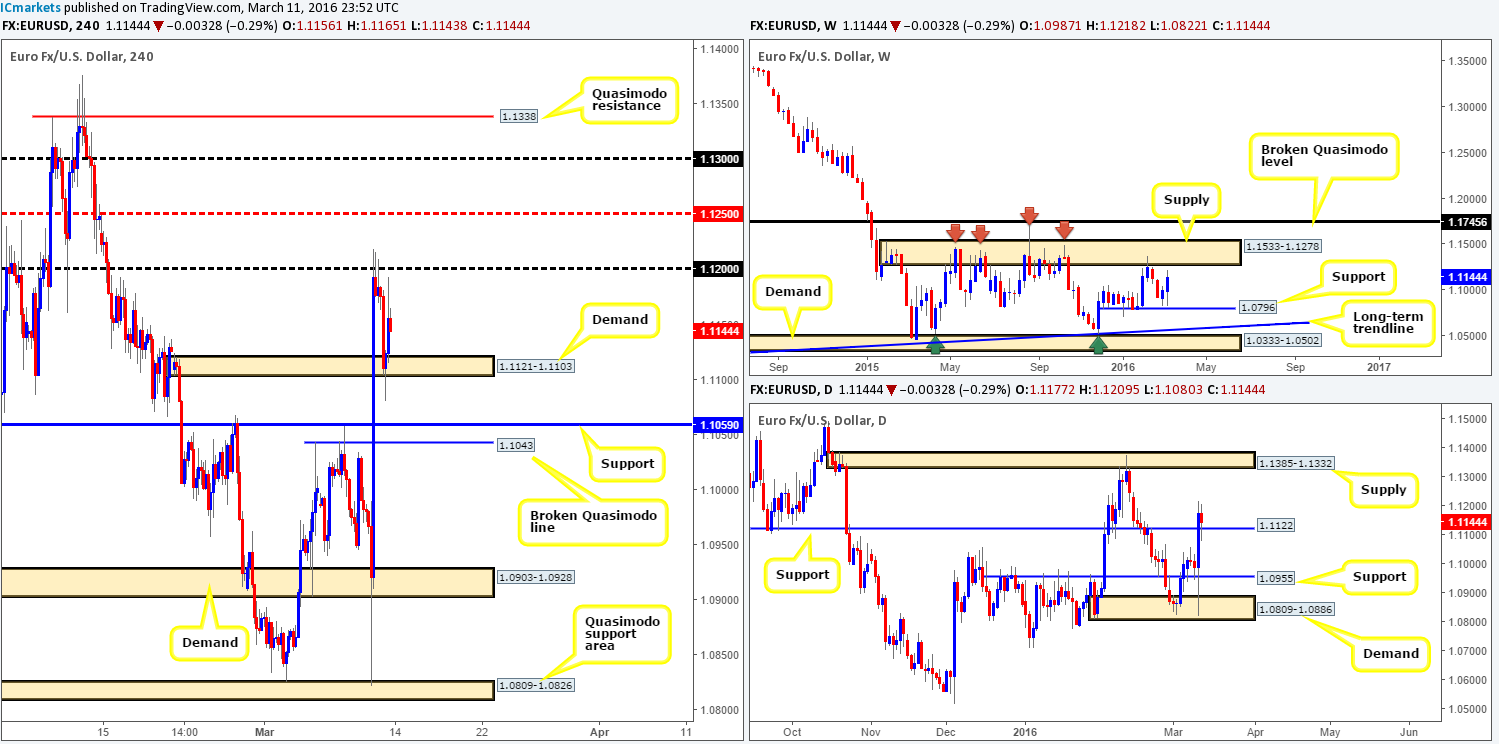
The past week saw the single currency rally around 150 pips by the close 1.1144. This surge in buying came about after a near-touch of a weekly support hurdle drawn from 1.0796, which, as you can see, pushed price up to below weekly supply penciled in at 1.1533-1.1278. Both areas are significant and certainly deserve a place in our watch list this week.
Following Thursday’s bullish attack, Friday’s daily candle closed out retesting the top-side of a recently broken resistance (now support) at 1.1122. Despite this, price failed to close higher, indicating potential weakness from the bull-side of this market. From this angle, the next upside target from here falls in at supply coming in at 1.1385-1.1332. Beyond this current support, however, 1.0955 would likely be the next limit to reach.
A quick look at Friday’s sessions on the H4 chart shows us that trade is now capped between demand at 1.1121-1.1103 and the 1.1200 figure. Given the points made above, here are our battle lines going into this week’s sessions:
For longs:
- Quite frankly, the only area we’d consider to buy from at this point would be the H4 demand zone mentioned above at 1.1121-1.1103 since it converges with the daily support at 1.1122. Granted, this daily level has so far not responded too well (see above), but considering the fact that weekly action shows room to continue north up to supply at 1.1533-1.1278 gives us confidence that further buying may still be on the horizon.
For shorts:
- Mid-level resistance 1.1250 could be a level to keep an eye on for a bounce this week. We only say a bounce because if price reaches this number, then it’s very likely it will want to cross swords with the underside of the aforementioned weekly supply base.
- The 1.1300 figure as well as the H4 Quasimodo level just above it at 1.1338. These two levels form a nice area in which a reversal is highly likely this week. Not only are both barriers positioned around the daily supply area at 1.1385-1.1332, but both are also hovering within the aforementioned weekly supply zone.
Levels to watch/live orders:
- Buys: 1.1121-1.1103 [Tentative – confirmation required] (Stop loss: dependent on where one confirms this area).
- Sells: 1.1250 [Tentative – confirmation required] (Stop loss: dependent on where one confirms this level). 1.1338/1.1300 [Tentative – confirmation required] (Stop loss: dependent on where one confirms this area).
GBP/USD:
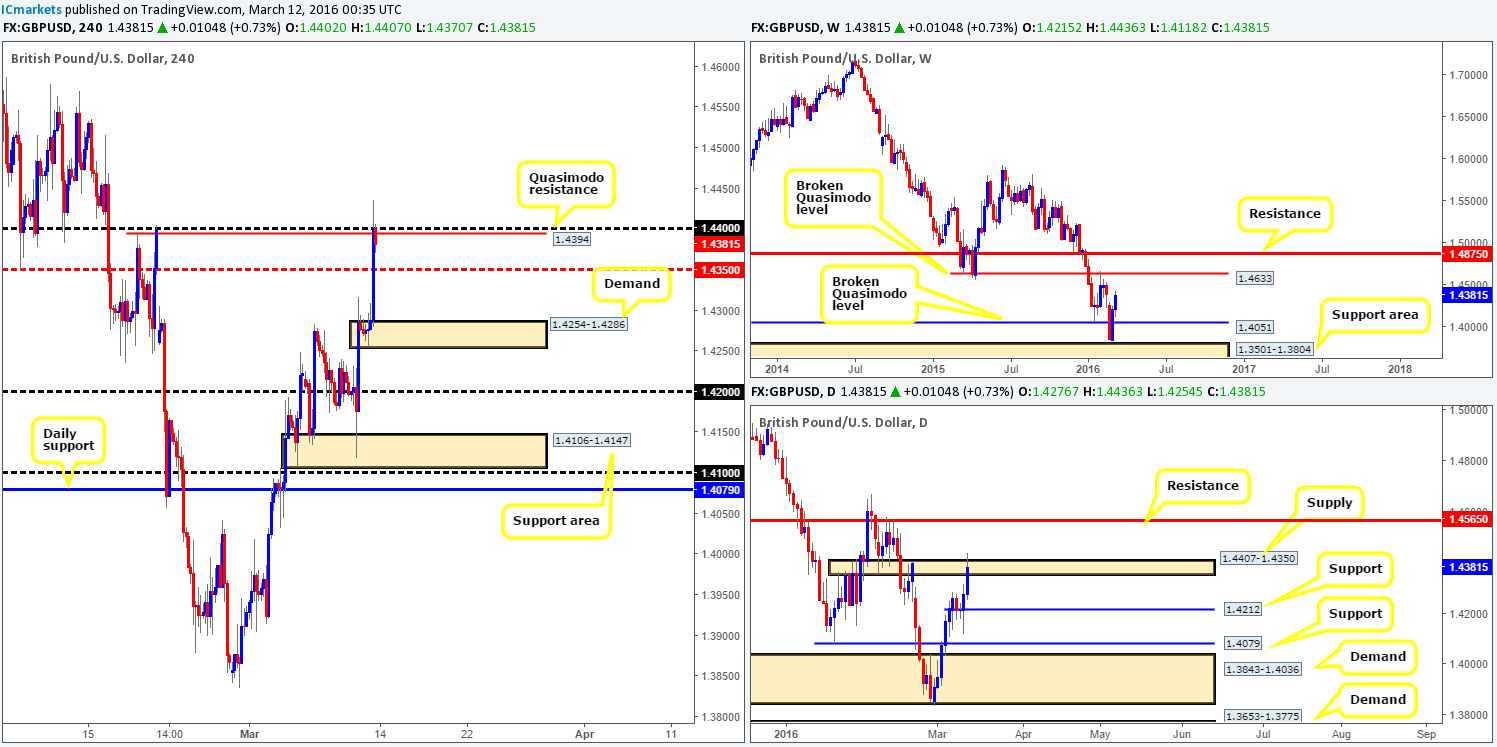
Following a rather aggressive move north two weeks ago, Cable extended higher last week, consequently increasing its value by a further 160 pips into the close 1.4381. As a result, weekly zones on our radar this week are the broken Quasimodo resistance level at 1.4633 and the broken Quasimodo support line below at 1.4051.
Casting our lines lower down to the daily chart, we can see that supply at 1.4407-1.4350 suffered a rather nasty whipsaw prior to the weekly close. This, in our estimation, may have potentially cleared out stops and opened the gates for price to challenge resistance chalked up at 1.4565. Conversely, let’s keep in mind that should well-funded traders sell into these stops (buy stops) we could see this pair forced down to support drawn from 1.4212. It’s very difficult to tell which way price will swing at this point.
Stepping across to the H4 chart, the Quasimodo resistance line at 1.4394 along with its supporting round-number figure 1.4400 held price lower going into the Friday’s close. Despite this, the spike above these lines has likely hurt a lot of shorts here, thus suggesting we may see higher prices today. However, we do not trade what we think, we trade WHAT WE SEE! So if price manages to consume the mid-level barrier 1.4350 (a cue to look for shorts on the retest of this number), then it’s likely the H4 demand at 1.4254-1.4286 could come into play.
If on the other hand the 1.4350 region holds price, this will be our cue to begin watching for this market to close above and retest 1.4400 for a possible (confirmed) long trade that has the potential to rally as high as the daily resistance at 1.4565.
Levels to watch/live orders:
- Buys: Watch for price to consume the 1.4400 level and look to trade any retest seen thereafter (lower timeframe confirmation required).
- Sells: Watch for price to consume the 1.4350 level and look to trade any retest seen thereafter (lower timeframe confirmation required).
AUD/USD:
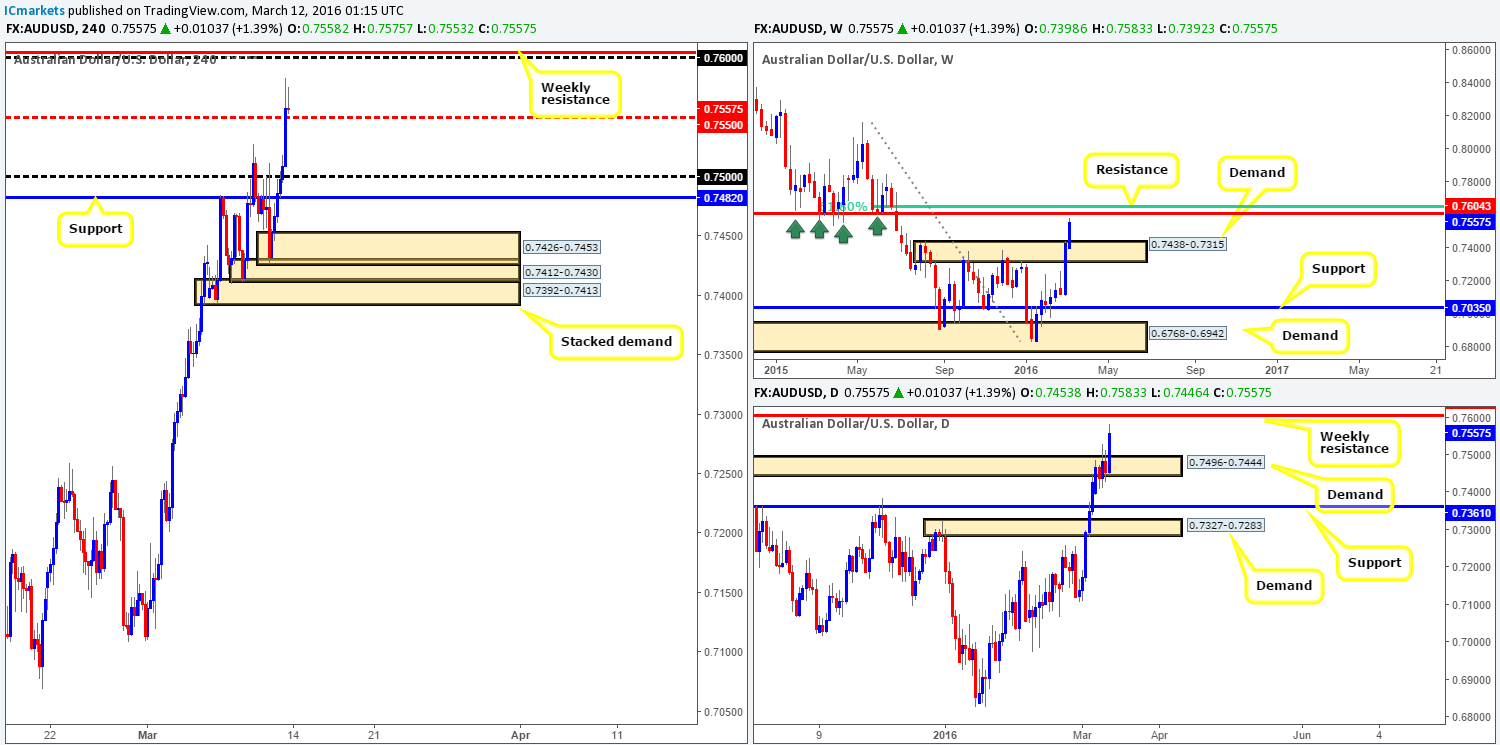
The commodity currency enjoyed another relatively successful week, gaining around 130 pips by the week’s end at 0.7557. On account of this, weekly supply (now acting demand) at 0.7438-0.7315 was taken out forcing the Aussie to close within shouting distance of a major weekly resistance line at 0.7604 (sits nicely below a 61.8% Fibonacci level at 0.7654). By the same token, weekly resistance is also a prominent barrier on the daily chart too. The only difference here is that if price rebounds from the aforementioned weekly level, the next downside target, as per this timeframe, can be seen at 0.7496-0.7444 – a recently broken supply-turned demand.
Moving across to the H4 chart, price ended the week closing above the mid-level number 0.7550, which is likely to get retested as support shortly after the markets open today. On the assumption that this level holds ground, then all eyes will be on the 0.7600/0.7650 region for potential short (confirmed) trades. Why 0.7650 when the weekly level is sitting only a four pips above 0.7600? Well, let’s not totally rule out the possibility that price may fake above this line to tag in the mid-level hurdle 0.7650 since it fuses beautifully with the 61.8% Fibonacci level discussed above on the weekly chart.
If on the other hand the H4 closes below 0.7550 today, it could then be a while before we see this weekly resistance level come into play since then the 0.7500 figure will be the next target to achieve, followed by H4 support at 0.7482. Therefore, a close below 0.7550 is in itself a signal to begin watching for price to retest this number as resistance for a confirmed short trade.
Levels to watch/live orders:
- Buys: Flat (Stop loss: N/A).
- Sells: 0.7650/0.7600 region [Tentative – confirmation required] (Stop loss: dependent on where one confirms this area). Watch for price to consume the 0.7550 level and look to trade any retest seen thereafter (lower timeframe confirmation required).
USD/JPY:
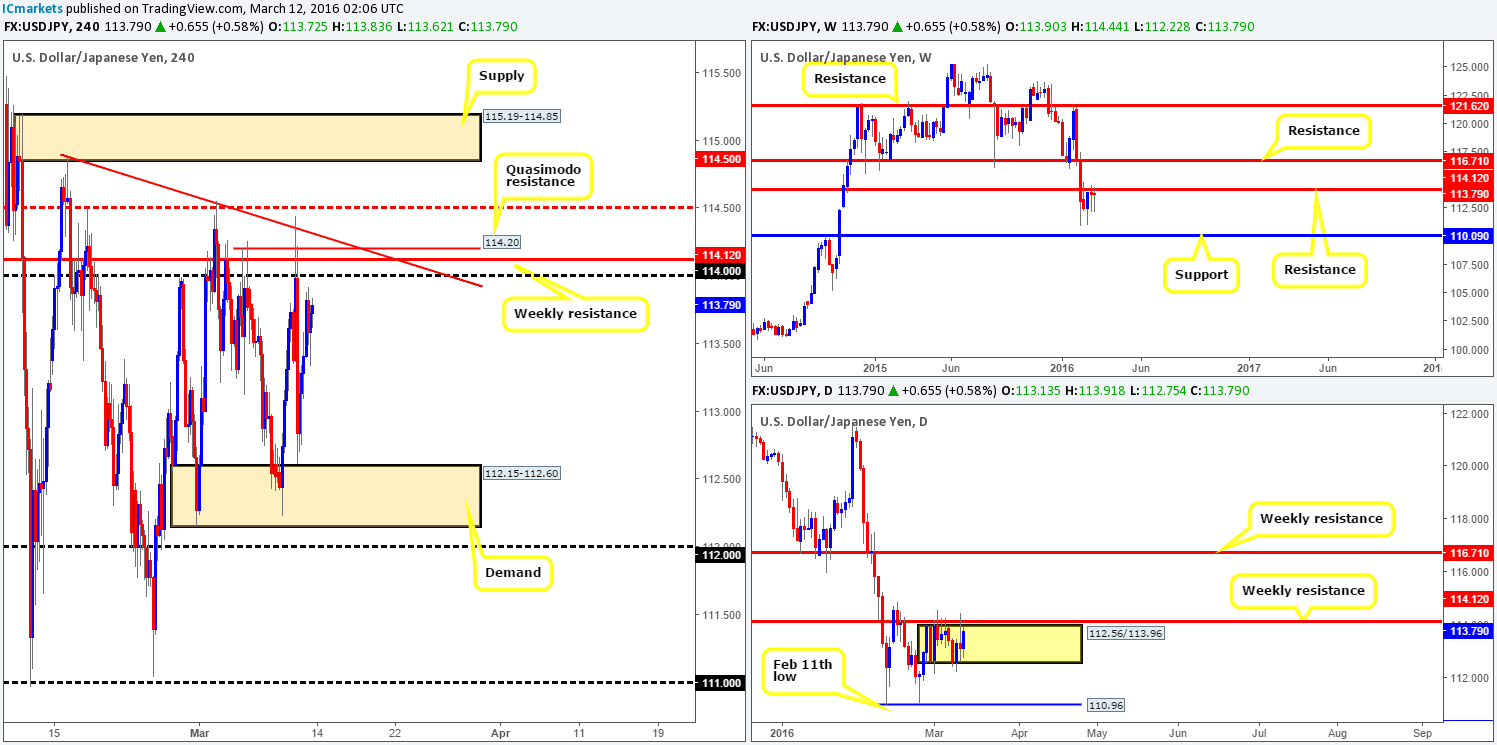
Although the USD/JPY ranged around 220 pips last week, the market closed a mere two pips above the prior week’s close at 113.79 just ahead of weekly resistance at 114.12. As can be seen from the weekly chart, back-to-back buying tails have printed beneath the current weekly resistance barrier, suggesting offers might be drying up. Despite this, it will only be once we see a close above this roadblock will it be confirmed that the buyers are gaining position.
As we move down into the daily chart, it’s clear that the two buying tails on the weekly chart have chalked up a relatively compact range fixed just below the weekly resistance level at 112.56/113.96. A violation of the lower limits of this consolidation, as far as we can see, opens the doors for a potential move down to the 110.96 region (the Feb 11th low).
Friday’s action on the H4 chart saw price extend to highs of 113.91 following Thursday’s aggressive rebound from the upper limits of demand coming in at 112.15-112.60. Right now, the only interesting area that jumps out to us is seen between 114.20 – a Quasimodo resistance, and the 114.00 figure. Reason being is in between here sits the weekly resistance level at 114.12 and a converging trendline extended from the high 114.87. This is certainly an area we are interested in shorting this week, with the mid-level number 113.50 in mind as a first target. The only grumble with this trade is the buying tails which formed on the weekly chart! To that end, the most logical path we see here is to wait for price to connect with our pre-determined H4 sell zone and only enter alongside a lower timeframe sell setup. We must also point out that even with the added confluence of lower timeframe confirmation here, stops will be placed above the mid-level barrier 114.50 to give the trade room to breathe.
Levels to watch/live orders:
- Buys: Flat (Stop loss: N/A).
- Sells: 114.20/114.00 region [Tentative – confirmation required] (Stop loss: dependent on where one confirms this area, but best kept above 114.50).
USD/CAD:
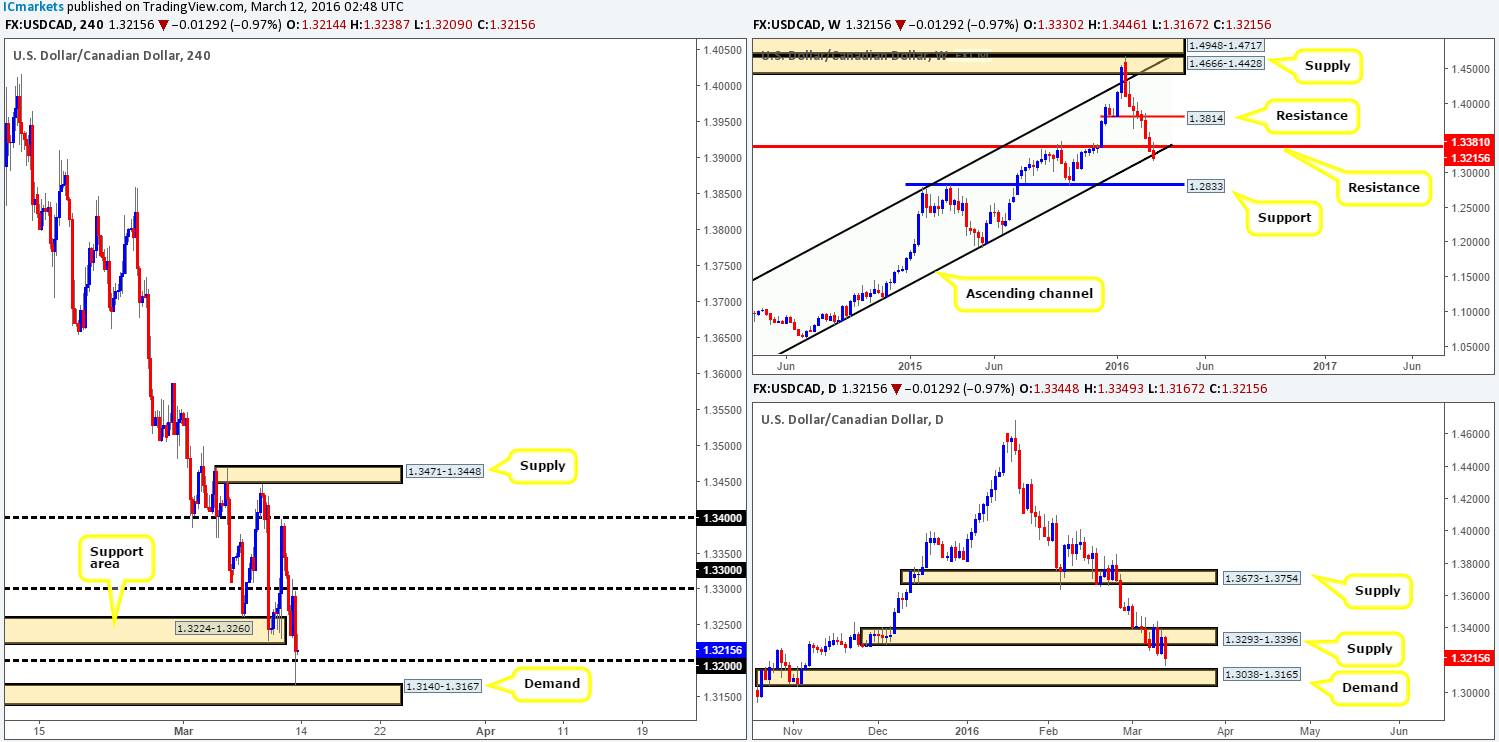
The USD/CAD has now been trading south for two months down from its peak of 1.4689. The most recent move saw weekly price retest resistance at 1.3381 and close the week out below an ascending channel support line extended from the low 1.0620 at 1.3215. Assuming that the bears continue to remain dominant this week, the weekly support at 1.2833 is the next barrier in the firing range. However, sellers looking to short the breakout of the most recent weekly move may want to hold fire! Down on the daily chart, price is seen trading close to a neighboring demand coming in at 1.3038-1.3165, which could potentially support this market and may even reverse it!
A quick recap of Friday’s sessions on the H4 chart reveals that price aggressively drove below the support area at 1.3224-1.3260, and then went on to surpass the 1.3200 number before rebounding to-the-pip from demand seen at 1.3140-1.3167. Now, given that this demand zone sits on top of the daily demand area mentioned above, there is a chance that this rebound could be the beginnings of a move north. As such, should price find support at the 1.3200 figure today and we manage to spot a lower timeframe buy setup here, we feel a long trade from this number is worth the risk, targeting 1.3300 as a first take-profit target.
Levels to watch/live orders:
- Buys: 1.3200 [Tentative – confirmation required] (Stop loss: dependent on where one confirms this level).
- Sells: Flat (Stop loss: N/A).
USD/CHF:
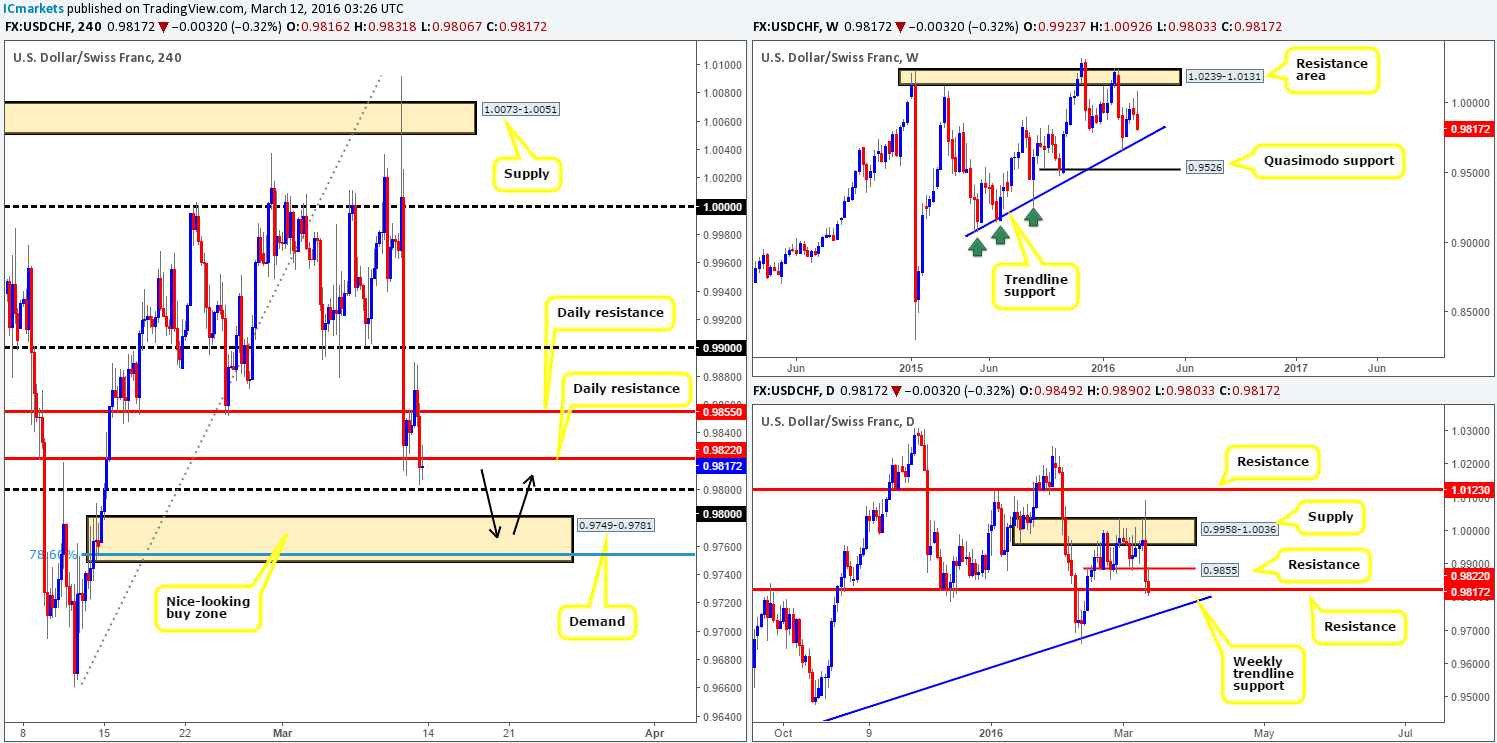
The USD/CHF shredded over 100 pips of value throughout last week’s session winding up closing the week at 0.9817. This move, as you can probably see from the weekly chart engulfed two prior weekly candles, firmly placing the trendline support back in view (0.9071) which has capped downside movement since May 2015. Further increasing the chances that this weekly trendline will see action this week is the fact that price closed below support (now acting resistance) at 0.9822 on the daily chart.
This is where things get a little more interesting… Across on the H4 chart, it is quite clear to see that price retested the underside of the recently broken daily support level at 0.9822 and ended the week printing an indecision candle. Now, assuming that the daily level holds as resistance and we see a push below the 0.9800 figure this week, the H4 demand area at 0.9749-0.9781 will be the next hurdle in view. Not only does this zone fuse with a 78.6% Fibonacci level at 0.9754, but it’s also bolstered by the weekly trendline we already discussed above thus forming a very nice buy zone to keep a tab on this week. For anyone who is familiar with trendlines, however, you will likely agree that even though they are effective at predicting turning points, they are unfortunately prone to some very nasty fakeouts. As such, once or indeed if price reaches the aforementioned H4 demand zone this week, we will only consider this a viable buy zone should lower timeframe buying strength be seen (see at the very top of this page how we like to look for this).
Levels to watch/live orders:
- Buys: 0.9749-0.9781 [Tentative – confirmation required] (Stop loss: dependent on where one confirms this area).
- Sells: Flat (Stop loss: N/A).
DOW 30:
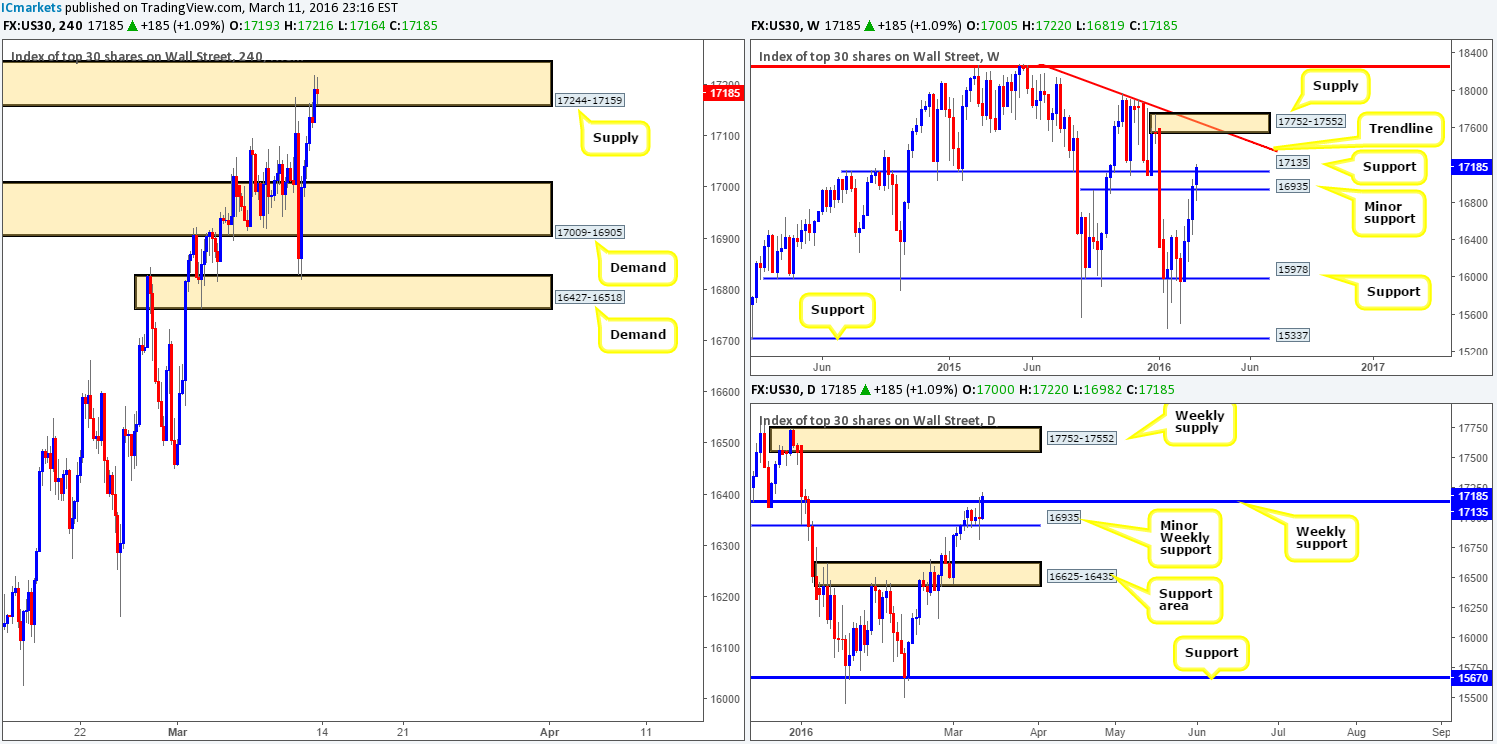
Since we saw the DOW bounce from weekly support at 15978, price has rallied higher for four consecutive weeks. Most recently and more importantly, however, we have seen weekly flow close above resistance (now acting support) at 17135, potentially clearing the path north up to supply drawn from 17752-17552 (converges with trendline resistance taken from the high 18365). With the daily action literally mimicking the weekly structure at present, let’s move directly across to the H4 chart…
Following an all-day rally on Friday, the week ended with price crashing into supply coming in at 17244-17159. Although the higher-timeframe picture (see above) indicates further upside this week, buying into the current H4 supply is out of the question! That being the case, we have to resort to waiting to see if price can close above this H4 area and retest it as demand for a confirmed entry long, with a H4 supply seen at 17606-17538 in mind as a take-profit target.
This target supply area is rather special in our book, since it is also an area we would most certainly short from at market due to the following converging structures:
- Positioned within the aforementioned weekly supply area.
- Blends beautifully with a H4 Quasimodo resistance level at 17606.
- And of top of this, the supply itself is fresh with strong momentum to the downside.
Levels to watch/live orders:
- Buys: Watch for price to consume the 17244-17159 area and look to trade any retest seen thereafter (lower timeframe confirmation required).
- Sells: 17606-17538 [Dependent on the time of day, a market entry is permitted here due to structure confluence – see above] (Stop loss: 17620).
XAU/USD: (Gold)
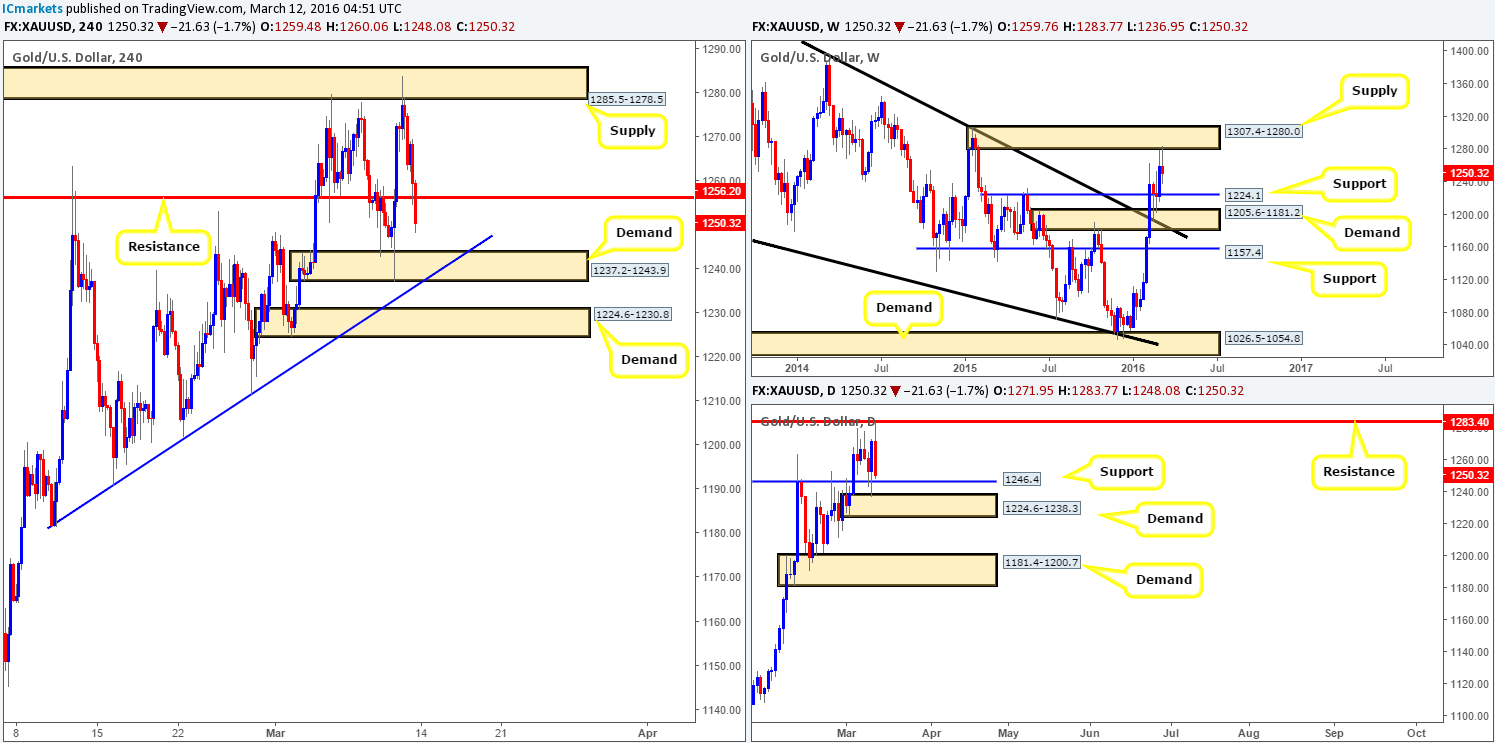
Overall, the Gold markets ended the week down around $10 by the close 1250.3. This, at least from a technical point of view, should not really come as much of a surprise since price recently crossed swords with a weekly supply zone coming in at 1307.4-1280.0. In the event that the bears continue to dig this week, the next obstacle to reach will likely be the support line drawn from 1224.1.
Stepping down into the daily chart, resistance at 1283.4 (located just within the above said weekly supply area) responded beautifully during Friday’s session – almost to-the-pip! This move however, has placed price just above support seen at 1264.4, followed closely by demand chalked up at 1224.6-1238.3.
For those who read Friday’s report on Gold (http://www.icmarkets.com/blog/friday-11th-march-daily-technical-outlook-and-review/) you may recall us mentioning to watch for selling opportunities from the H4 supply seen at 1285.5-1278.5 due to its higher-timeframe confluence (see above). As we can all see, the yellow metal dropped like a rock from here which we unfortunately missed since we could not find a setup on the lower timeframes to sell! Well done to any of our readers who took advantage of this move – A very nice end to the week.
For those still short this market, we would recommend liquidating some of your position and at least moving your stop to breakeven now. Reason being is just ahead sits a H4 demand zone at 1237.2-1243.9 that’s positioned just below the daily support at 1246.4, which also converges with a H4 trendline taken from the low 1181.6. For all this though, we do not expect this H4 demand zone to hold out long-term as the more attractive zone is sitting below. H4 demand at 1224.6-1230.8 is not only housed within the extremes of the above said daily demand zone, but it is also bolstered by the weekly support level mentioned above at 1224.1. Due to this, we’re expecting this H4 demand area to hold firm and produce a healthy bounce. However, considering that the weekly level sits just beneath the H4 demand, there is a high probability that a fakeout will take place before buyers step in. That being the case, we would only enter within this zone alongside lower timeframe confirmation i.e. a break of supply or a collection of lower timeframe buying tails around a lower timeframe support etc…
Levels to watch/live orders:
- Buys: 1224.6-1230.8 [Tentative – confirmation required] (Stop loss: dependent on where one confirms this area).
- Sells: Flat (Stop loss: N/A).


