
EUR/USD:
Weekly Gain/Loss: +0.64%
Weekly Close: 1.1468
Weekly perspective:
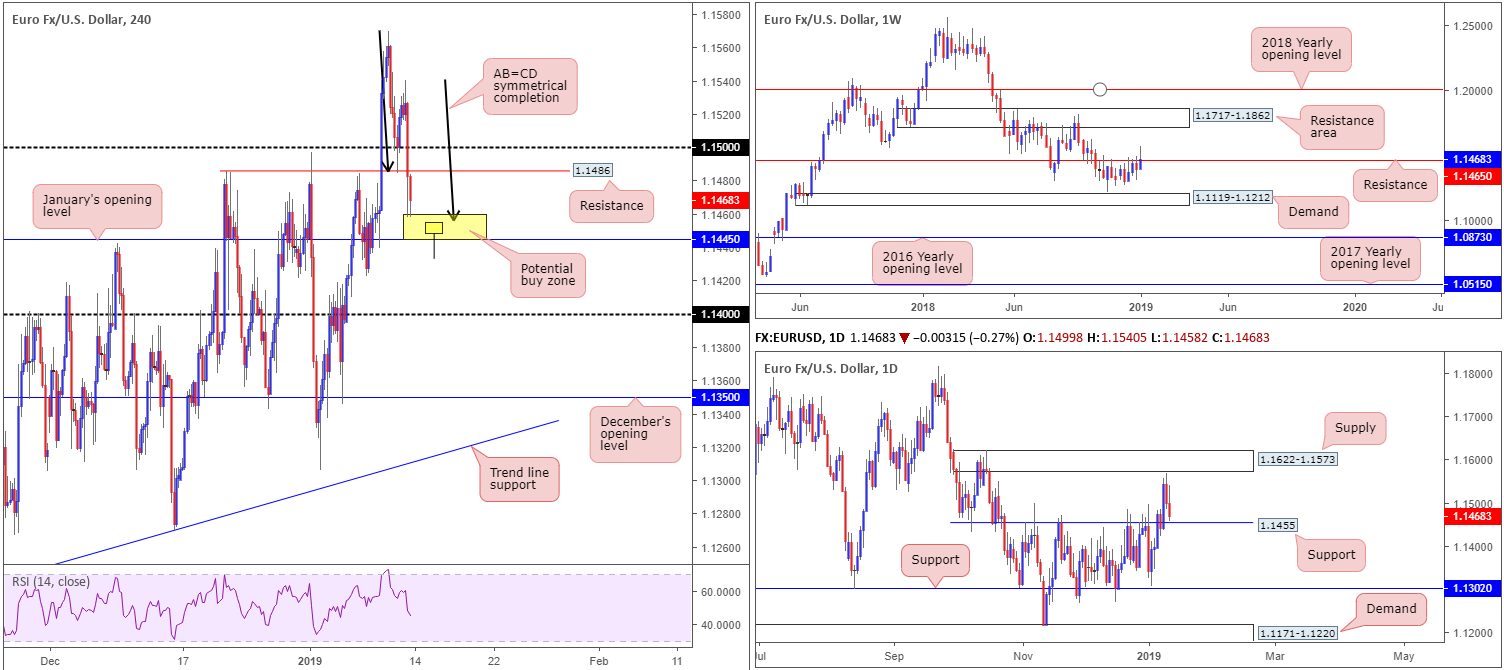
Despite clocking highs of 1.1569 last week, the pair failed to sustain gains and overpower resistance coming in at 1.1465. Taking the form of a mildly respectable bearish pin-bar pattern, price action concluded the week closing just three pips above the said resistance.
Traders are urged not to overlook the current resistance level on this scale, as it boasts strong historical significance dating as far back as early February 2015. In the event we continue to press for lower ground this week, traders’ crosshairs will likely be fixed on demand drawn from 1.1119-1.1212.
Daily perspective:
The key observation on this timeframe is supply at 1.1622-1.1573 and support at 1.1455.
Price action witnessed a sharp change in mood Thursday, turning just north of the aforementioned supply. This, as you can see, weighed on the unit Friday, pulling the market towards noted support which, according to our technical reading, has the ability to hamper selling this week given how well this level held as resistance during the month of November (2018).
H4 perspective:
Shortly after Friday’s US CPI m/m and US core CPI m/m – both in-line with consensus – hit the wires the EUR/USD rotated lower (see M30 chart). Swiftly taking out the 1.15 handle and eventually support at 1.1486 (now acting resistance), price cleared the pathway south for the unit to challenge a nearby AB=CD symmetrical completion point around 1.1460s (black arrows).
Taking into account the AB=CD formation completes just north of January’s opening level at 1.1445, which is positioned just beneath daily support highlighted above at 1.1455 (yellow), traders are likely expecting active buyers to be present here today. The only grumble, of course, is weekly structure trading from resistance at 1.1465.
Areas of consideration:
In light of the above reading, the research team agrees buyers likely reside within the yellow H4 zone mentioned above at 1.1445/1.1460, though points out weekly resistance throws a red flag on the area.
To overcome this, traders are urged to wait for additional confirmation to form before pressing the buy button. A bullish candlestick pattern, for example, would serve well (see chart for a visual image). This not only offers traders a defined entry and exit point, it also shows whether or not buyers are active.
In regards to targets out of 1.1445/1.1460, keep eyes on H4 resistance at 1.1486/1.15 as an initial take-profit zone.
Today’s data points: Limited.
GBP/USD:
Weekly Gain/Loss: +0.86%
Weekly Close: 1.2834
Weekly perspective:
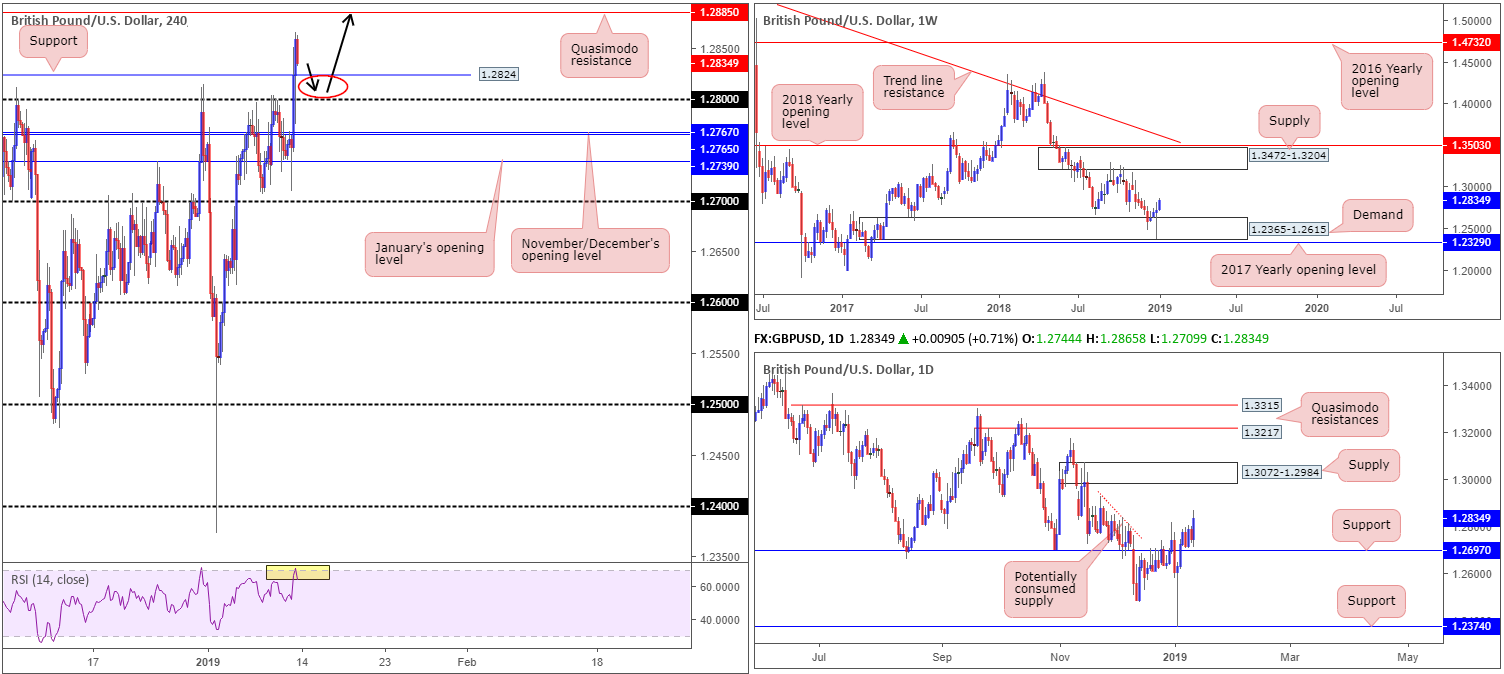
Cable, as highlighted in last week’s weekly report, firmly entered the parapets of demand at 1.2365-1.2615 in the opening stages of the year, challenging the lower borders of the area before finding willing buyers and pushing higher. Assuming buyers remain defensive out of this zone, a run towards supply painted at 1.3472-1.3204 may be in store over the coming weeks.
Daily perspective:
In conjunction with weekly movement, daily activity concluded recent trade closing firmly above resistance priced in at 1.2697 (now acting support). What’s also notable from a technical perspective is Friday’s bullish engulfing candle formation.
Continued buying from this point could lead to a test of supply at 1.3072-1.2984, according to our technical studies. Above 1.2697, limited supply is visible, with a major portion likely consumed as price declined lower in late November of 2018 (see red descending line).
H4 perspective:
The pound, as you’ll see on the M30 chart, established support in response to Friday’s UK monthly GDP figures (0.2% vs. expected 0.1%) and UK monthly manufacturing production (-0.3% vs. expected 0.4%). The move was later exacerbated amid reports of a potential delay to the Brexit date. This, however, was later dismissed by a UK PM May spokeswoman.
A number of resistances were consumed thanks to Friday’s advance, potentially unlocking the path north for further buying today/early week on this timeframe. The break of Quasimodo resistance at 1.2824 could potentially offer support to the market, targeting Quasimodo resistance overhead at 1.2885.
Areas of consideration:
Having noted higher-timeframe structure offering a reasonably clear path north this week, coupled with room for the H4 candles to explore higher ground towards 1.2885, a long off H4 support mentioned above at 1.2824/nearby 1.28 handle, is an option. Waiting for additional bullish candlestick confirmation to form (entry/stop parameters can be defined according to this pattern) is advised, nevertheless, since round numbers (1.28) are prone to stop runs/fakeouts.
Today’s data points: Limited.
AUD/USD:
Weekly Gain/Loss: +1.41%
Weekly Close: 0.7214
Weekly perspective:
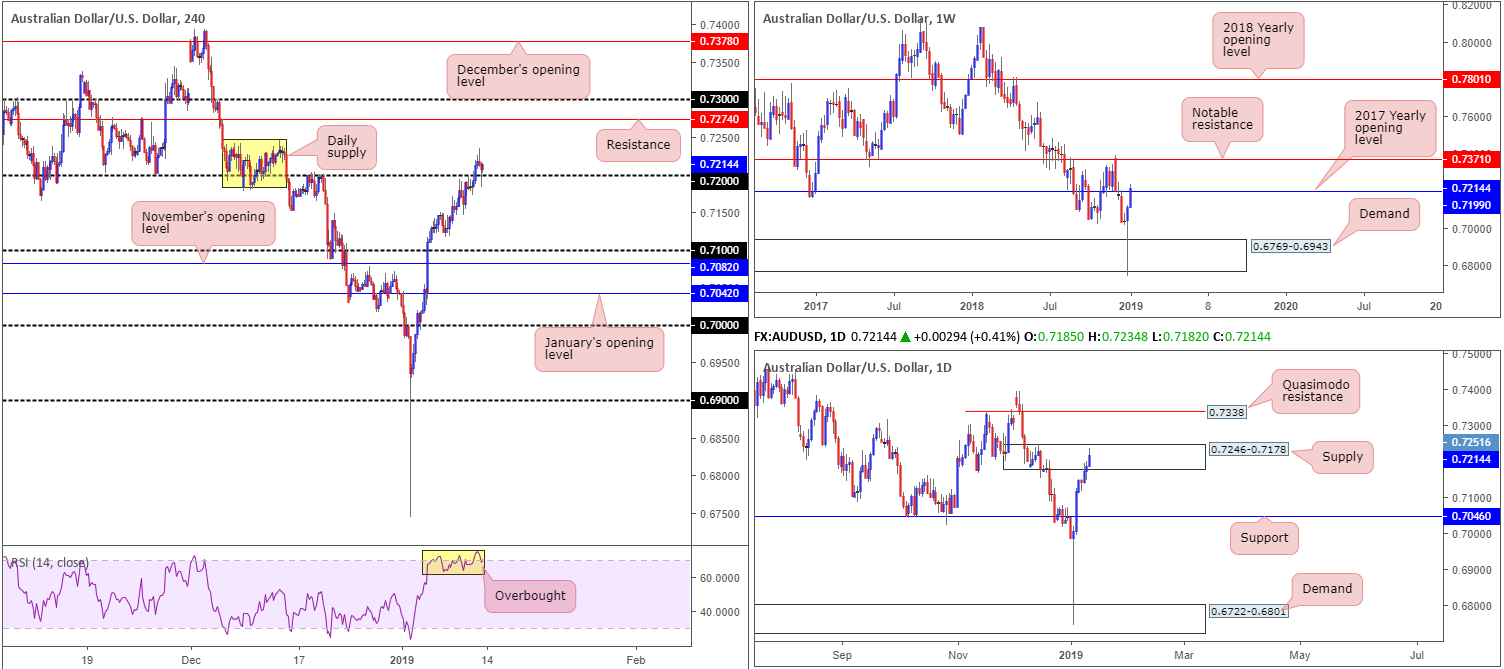
By way of a mammoth bullish pin-bar formation printed out of demand priced in at 0.6769-0.6943 the week prior, the Australian dollar extended gains vs. its US counterpart last week, marginally overthrowing the 2017 yearly opening level coming in at 0.7199. Should buyers remain in the driving seat here this week, notable resistance at 0.7371 is in range.
Daily perspective:
Contrary to weekly structure, daily supply at 0.7246-0.7178 remains in the picture and could possibly hamper upside this week. Failure to hold not only confirms bullish strength above the 2017 yearly opening level at 0.7199 on the weekly timeframe, it also frees upside in the direction of a daily Quasimodo resistance at 0.7338.
H4 perspective:
Friday’s movement on the H4 timeframe maintained a healthy bullish tone, eventually conquering 0.72 to the upside. What’s interesting here, even though price is currently engaging with daily supply, is the retest of 0.72 as support by way of a bullish pin-bar formation. This, alongside weekly price overthrowing its 2017 yearly opening level at 0.7199, could be sufficient enough to draw in additional buyers this week.
Areas of consideration:
On account of the above analysis, the research team feels the AUD/USD may be heading for higher levels this week, despite daily supply at 0.7246-0.7178. This is largely due to H4 action retesting 0.72 as support in the shape of a bullish candlestick signal, and weekly price recently taking out a major level at 0.7199.
Entering long at current price (with stop loss orders tucked beneath the H4 bullish pin-bar’s tail [0.7183]) is an option this morning, targeting a break of the current daily supply. Once, or indeed if, the daily zone is engulfed, traders can consider reducing risk to breakeven and taking some profits off the table. The next upside target beyond here is H4 resistance at 0.7274.
Today’s data points: AUD MI Inflation Gauge m/m; China Trade Balance.
USD/JPY:
Weekly Gain/Loss: +0.05%
Weekly Close: 108.55
Weekly perspective:
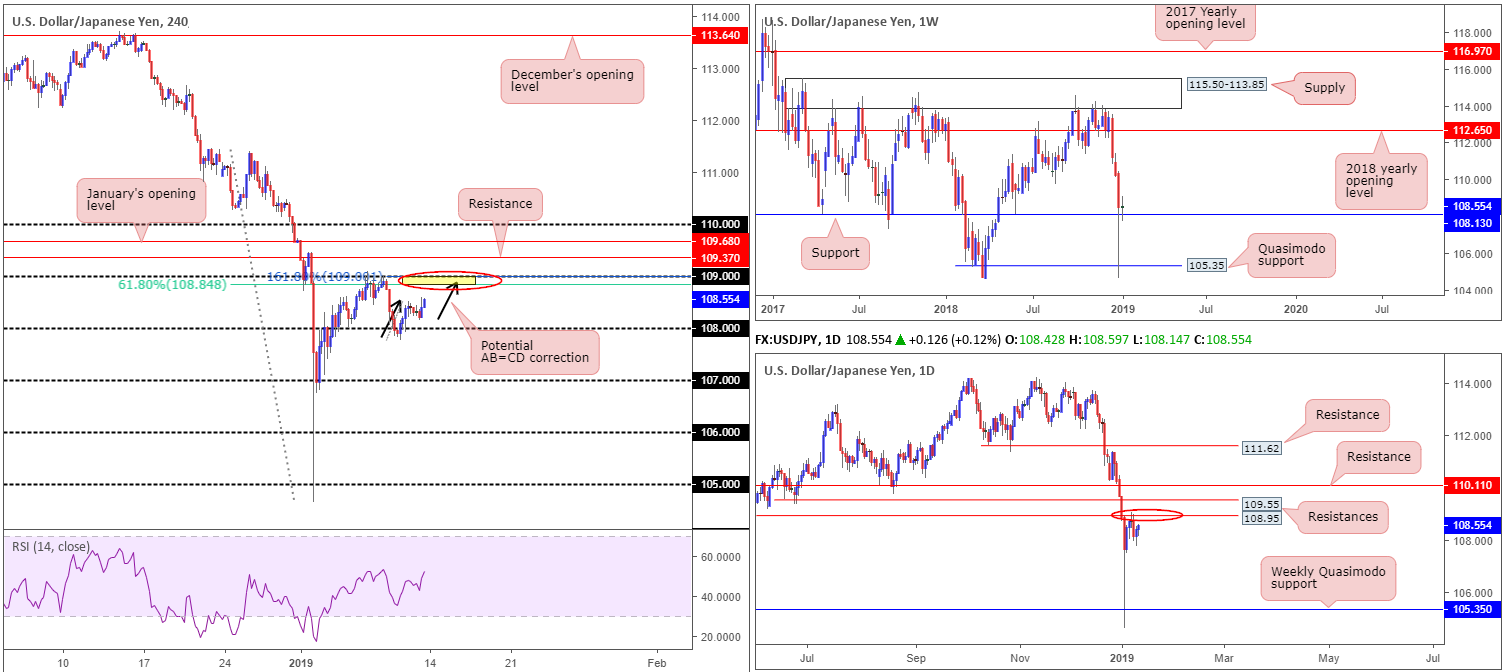
Support at 108.13, in spite of the prior week’s gargantuan move to lows of 104.65, remained in the fight last week. Buyers and sellers, however, according to the weekly candle close, are indecisive.
The research team notes a relatively clear path to the upside from 108.13 until connecting with the 2018 yearly opening level at 112.65. Should the market spin south, nonetheless, Quasimodo support at 105.35 is the next level on the hit list to be aware of.
Daily perspective:
The picture on the daily timeframe offers traders a somewhat sturdier picture in terms of the possible direction weekly players may take this week, as resistance at 108.95 (a Quasimodo support-turned resistance) is currently capping upside. In addition to this, another layer of resistance (also a Quasimodo support-turned resistance) is seen directly above at 109.55.
H4 perspective:
A quick recap of Friday’s movement on the H4 timeframe shows little change was observed in terms of structure. What is notable from a technical standpoint, however, is a potential AB=CD (black arrows) 161.8% bearish pattern terminating just south of 109 that sides with a 61.8% Fibonacci resistance value at 108.84 (yellow).
Areas of consideration:
Tentativeness witnessed on the weekly timeframe off support at 108.13, combined with daily candles establishing resistance off 108.95 and H4 price in the process of chalking up an AB=CD bearish correction off 109 is likely enough evidence to warrant a sell from 109ish this week, according to our technical drawings.
As round numbers are prone to fakeouts/stop runs, traders may want to consider waiting for additional confirmation to form before pulling the trigger. A lower-timeframe trend line support break/retest, a lower-timeframe engulf of demand followed up with a retest as supply or simply a bearish candlestick signal would suffice. Confirming structure not only offers traders a defined entry and exit point, it also shows whether or not sellers are active.
Today’s data points: Japanese banks are closed in observance of Coming-of-Age Day.
USD/CAD:
Weekly Gain/Loss: -0.85%
Weekly Close: 1.3263
Weekly perspective:
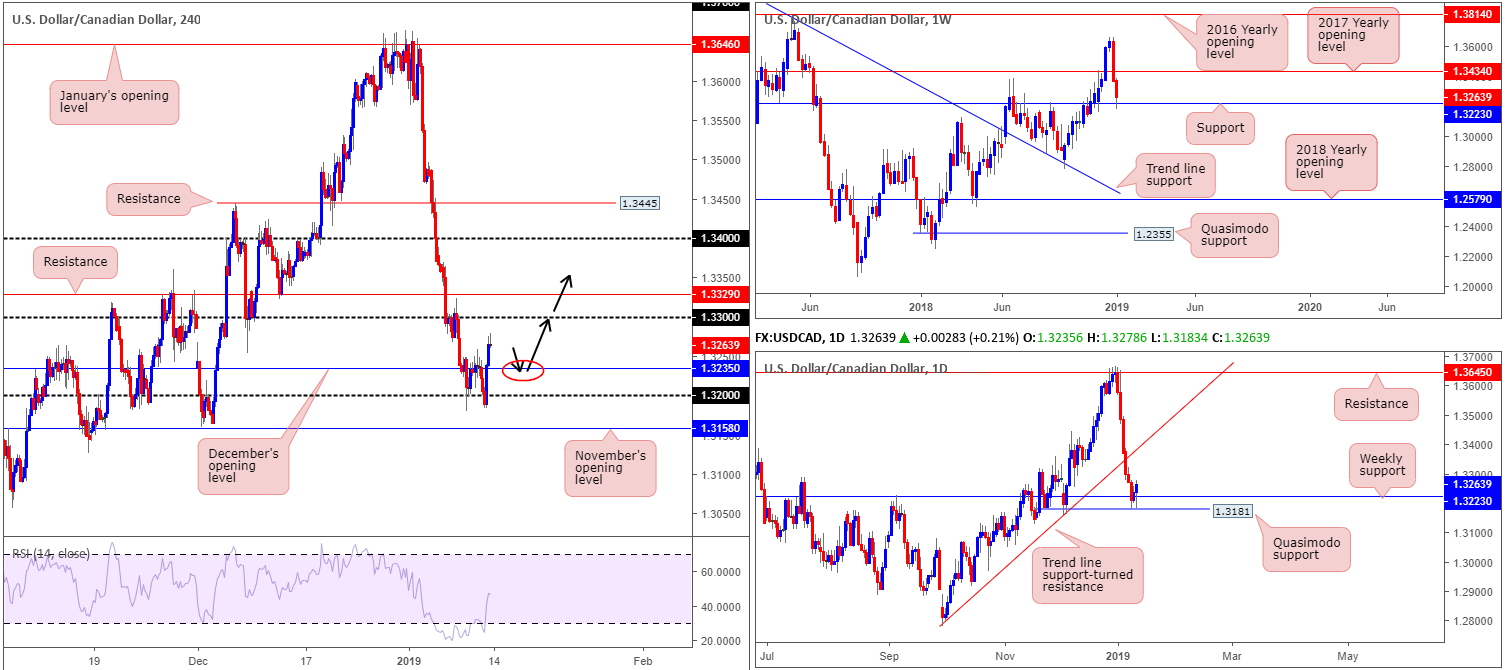
After price action overlapped its 2017 yearly opening level at 1.3434 in the shape of a near-full-bodied bearish candle, this prompted another wave of selling last week. Though the sellers clearly govern market movement at the moment, this could change this week with support at 1.3223 recently entering the fray.
Daily perspective:
Closer analysis of this market on the daily timeframe reveals the unit shook hands with a daily Quasimodo support at 1.3181 last week. This level, as you can see, is situated just south of the current weekly support level. As long as the buyers continue to defend the said supports, the next upside target on the daily timeframe falls in around trend line support-turned resistance (extended from the low 1.2782).
H4 perspective:
The commodity-sensitive Canadian dollar came under modest pressure Friday as crude oil struggled to push for higher ground. The USD/CAD advanced to a three-day high at 1.3276 and cleared sellers out from December’s opening level at 1.3235.
Although the H4 timeframe closed in the form of a bearish candlestick pattern, further buying towards 1.33 is still a strong possibility today, considering where we’re coming from on the higher timeframes (see above).
Areas of consideration:
Given the factors presented above, the pendulum is certainly beginning to swing toward further buying.
Should the H4 candles turn lower today and retest December’s opening level mentioned above at 1.3235, this would likely be enough to draw in buyers. Assisted by higher-timeframe support, a move from here could easily reach 1.33 and possibly beyond this week. Remember the nearest resistance on the higher timeframes is the trend line support-turned resistance (extended from the low 1.2782).
Aggressive traders may look to simply enter long from 1.3235 with stop-loss orders tucked beneath 1.32, while conservative traders are likely to wait and see if price action delivers additional confirmation before pressing the buy button.
Today’s data points: Limited.
USD/CHF:
Weekly Gain/Loss: -0.40%
Weekly Close: 0.9837
Weekly perspective:
Our technical reading on the weekly timeframe reveals price tested its 2018 yearly opening level at 0.9744 last week and recovered in robust fashion. By way of a bullish pin-bar formation, the long-term picture now points to further buying this week, targeting the 2016 yearly opening level at 1.0029.
Daily perspective:
Supporting the 2018 yearly opening level on the weekly timeframe is a daily trend line support (taken from the low 0.9187). The daily resistance to be watchful of, however, falls in nearby at 0.9876. This, we believe, is the last line of resistance until the market is free to test the notable daily resistance priced in at 0.9986.
H4 perspective:
Following Thursday’s decisive advance the USD/CHF struggled to find direction Friday, latching on to the underside of January’s opening level at 0.9838 and resistance at 0.9854 (merges with trend line resistance [extended from the high 0.9963]). Latest macroeconomic data out of the US also did little to aid market movement as both US CPI m/m and US core CPI m/m fell in-line with consensus.
In the event we reject the said resistances today, the 0.98 handle will likely be brought back into motion. A break higher, however, has the 0.99 handle to target.
Areas of consideration:
According to our technical studies on the higher timeframes, further buying could be on the horizon until reaching daily resistance plotted at 0.9876. Having seen the H4 candles hovering beneath H4 resistances (see above), though, buying this market is tricky. Beyond 0.9854 we also have to take into account we have little more than 20 pips to work with until shaking hands with daily resistance at 0.9876.
On account of the above, neither a long nor short appears worthy in this market at the moment. Both ends remain restricted.
Today’s data points: Limited.

Dow Jones Industrial Average:
Weekly Gain/Loss: +2.36%
Weekly Close: 23953
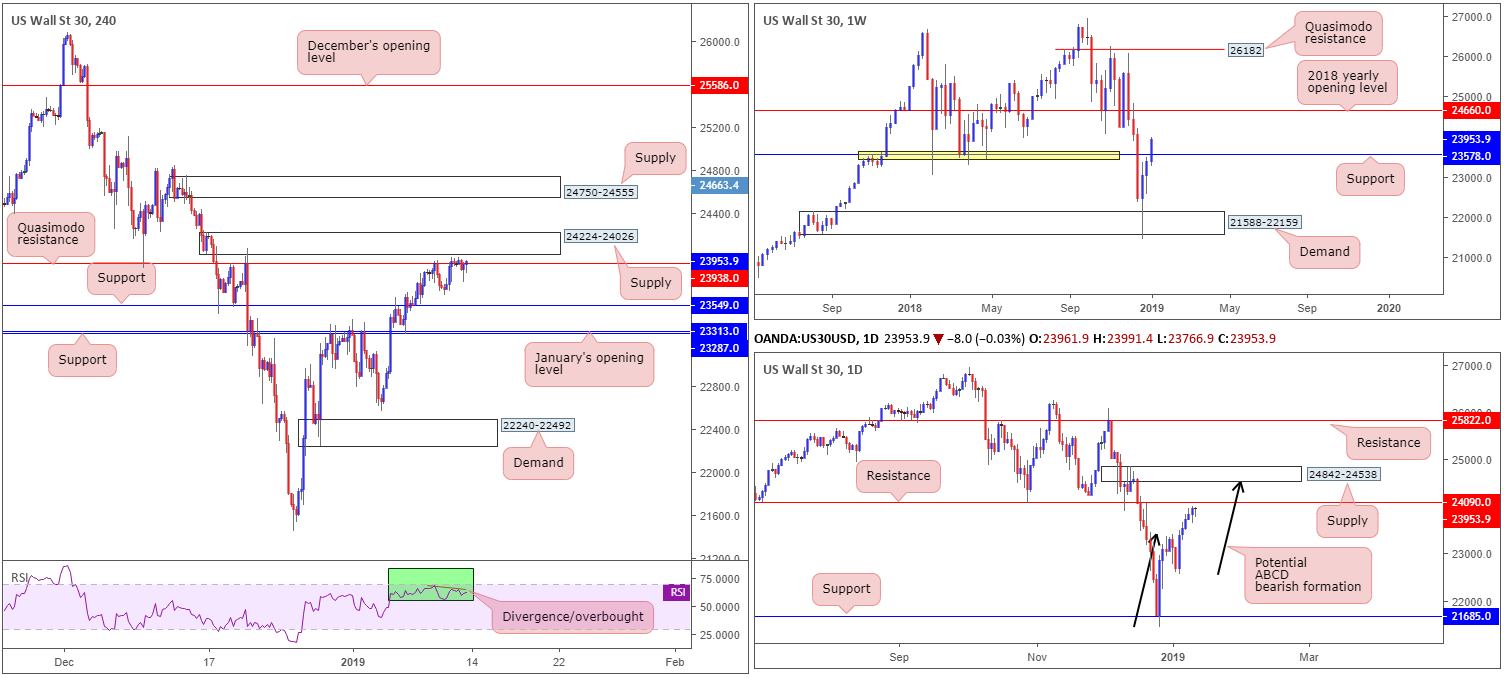
Weekly perspective:
Recording its third consecutive week in the green, US equities firmly overthrew resistance at 23578 last week (now acting support), exposing resistance in the form of the 2018 yearly opening level at 24660. Traders will, however, need to prepare for the possibility of a pullback taking shape this week to retest 23578 before reaching 24660.
Daily perspective:
Contrary to weekly structure pointing to further upside this week, the daily candles show resistance notched in at 24090. Interestingly, we also observe a potential ABCD (black arrows) bearish formation in the process of completing around the underside of supply at 24842-24538, suggesting a possible move above the noted resistance this week.
H4 perspective:
A brief look at recent dealings on the H4 timeframe show the candles remained sedated around the Quasimodo resistance priced in at 23938, positioned just south of supply drawn from 24224-24026. It might also interest traders to note an additional layer of supply is visible around 24750-24555, and the RSI indicator is currently seen displaying a divergence/overbought reading.
Areas of consideration:
With H4 Quasimodo resistance suffering somewhat at the moment, eyes are likely turning to H4 supply mentioned above at 24224-24026 for possible shorting opportunities this week, given it houses the current daily resistance level within.
Should price ignore 24224-24026, traders’ crosshairs will likely be drawn towards the next layer of H4 supply also highlighted above at 24750-24555. This area is firmly positioned within the walls of the current daily supply zone and has the added bonus of being accompanied by a daily ABCD approach.
Despite weekly price showing room to pursue higher levels, both H4 supplies mentioned above are worthy of shorts this week, according to our technical studies. To help avoid an unnecessary loss, however, it might be worth considering entering on the back of bearish candlestick confirmation. This not only offers traders a defined entry and exit point, it also shows whether or not sellers are active, which is crucial seeing as how you will effectively be selling against weekly flow.
Today’s data points: Limited.
XAU/USD (Gold):
Weekly Gain/Loss: +0.19%
Weekly Close: 1287.2
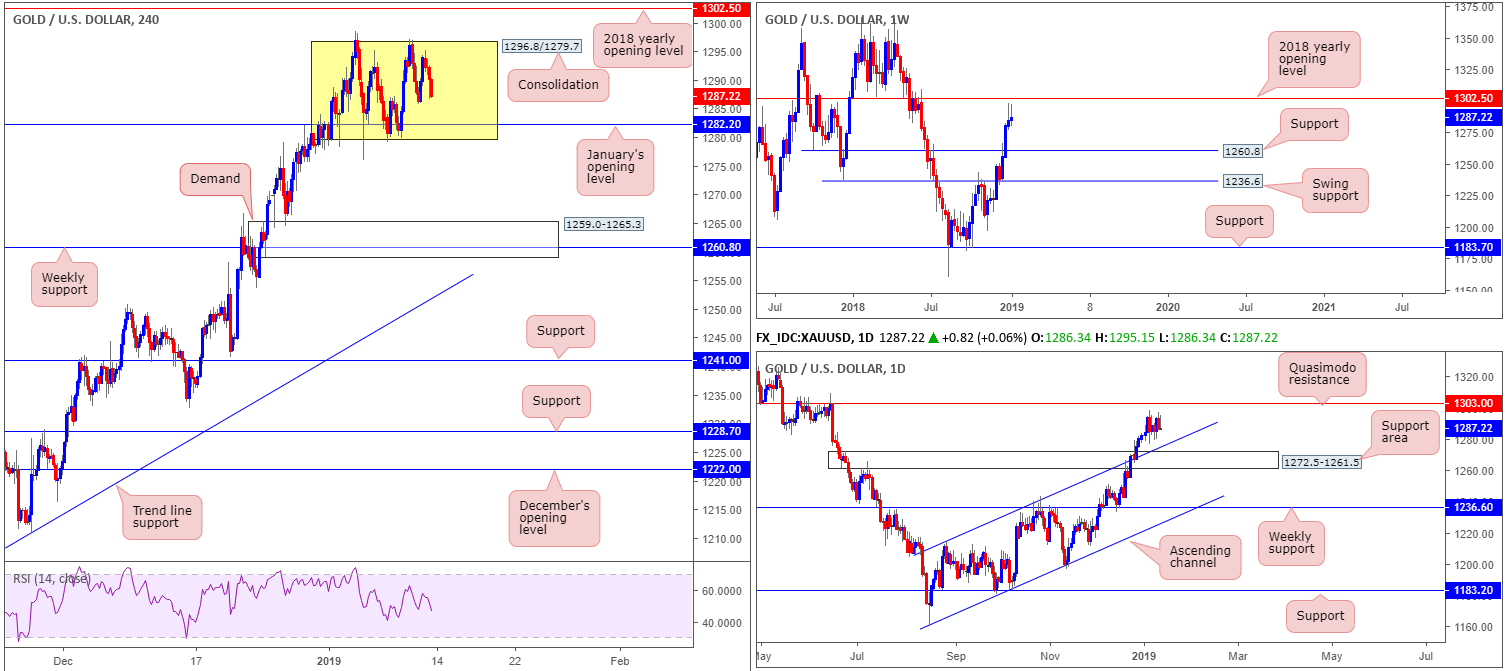
Weekly perspective:
Leaving its 2018 yearly opening level at 1302.5 unopposed, the price of gold curved lower against its US counterpart again last week. Though still managing to wrap up the session mildly in the green, the closing weekly candle printed its second consecutive bearish pin-bar formation, which could entice sellers into the market over the coming week towards support at 1260.8.
Daily perspective:
Limited change has been observed on the daily timeframe since our last weekly report. Price action remains sandwiched between a channel resistance-turned support (etched from the high 1214.3) along with a nearby support area coming in at 1272.5-1261.5 and a Quasimodo resistance level at 1303.0 (positioned just north of the 2018 yearly opening level at 1302.5).
H4 perspective:
The H4 candles remain busy carving out a consolidation (yellow) between 1296.8/1279.7. Inside the lower limits of this range, traders may also want to note January’s opening level at 1282.2 is noticeably visible.
Beneath the aforementioned H4 consolidation, the research team notes room for the sellers to stretch their legs towards H4 demand plotted at 1259.0-1265.3, which happens to fuse nicely with weekly support at 1260.8. Note this H4 demand is also sited within the lower limits of the daily support area coming in at 1272.5-1261.5. It might also be worth mentioning before we reach the aforementioned H4 demand, daily buyers may try to defend the channel resistance-turned support (etched from the high 1214.3).
Above the current H4 range, however, we have the 2018 yearly opening level positioned nearby at 1302.5 (weekly timeframe), shadowed closely by a daily Quasimodo resistance at 1303.0.
Areas of consideration:
Range traders may look to trade the limits of the aforesaid H4 range today/early week, using additional confirmation as a way of checking whether active buyers/sellers are present around the edges of this formation.
Given the recent strength of gold over the past couple of weeks, however, a break of this range to the upside is possible this week. Should this come to fruition, traders’ crosshairs will likely be fixed on the 2018 yearly opening level mentioned above at 1302.5/daily Quasimodo resistance for shorts.
The use of the site is agreement that the site is for informational and educational purposes only and does not constitute advice in any form in the furtherance of any trade or trading decisions.
The accuracy, completeness and timeliness of the information contained on this site cannot be guaranteed. IC Markets does not warranty, guarantee or make any representations, or assume any liability with regard to financial results based on the use of the information in the site.
News, views, opinions, recommendations and other information obtained from sources outside of www.icmarkets.com.au, used in this site are believed to be reliable, but we cannot guarantee their accuracy or completeness. All such information is subject to change at any time without notice. IC Markets assumes no responsibility for the content of any linked site. The fact that such links may exist does not indicate approval or endorsement of any material contained on any linked site.
IC Markets is not liable for any harm caused by the transmission, through accessing the services or information on this site, of a computer virus, or other computer code or programming device that might be used to access, delete, damage, disable, disrupt or otherwise impede in any manner, the operation of the site or of any user’s software, hardware, data or property.


