
DXY:
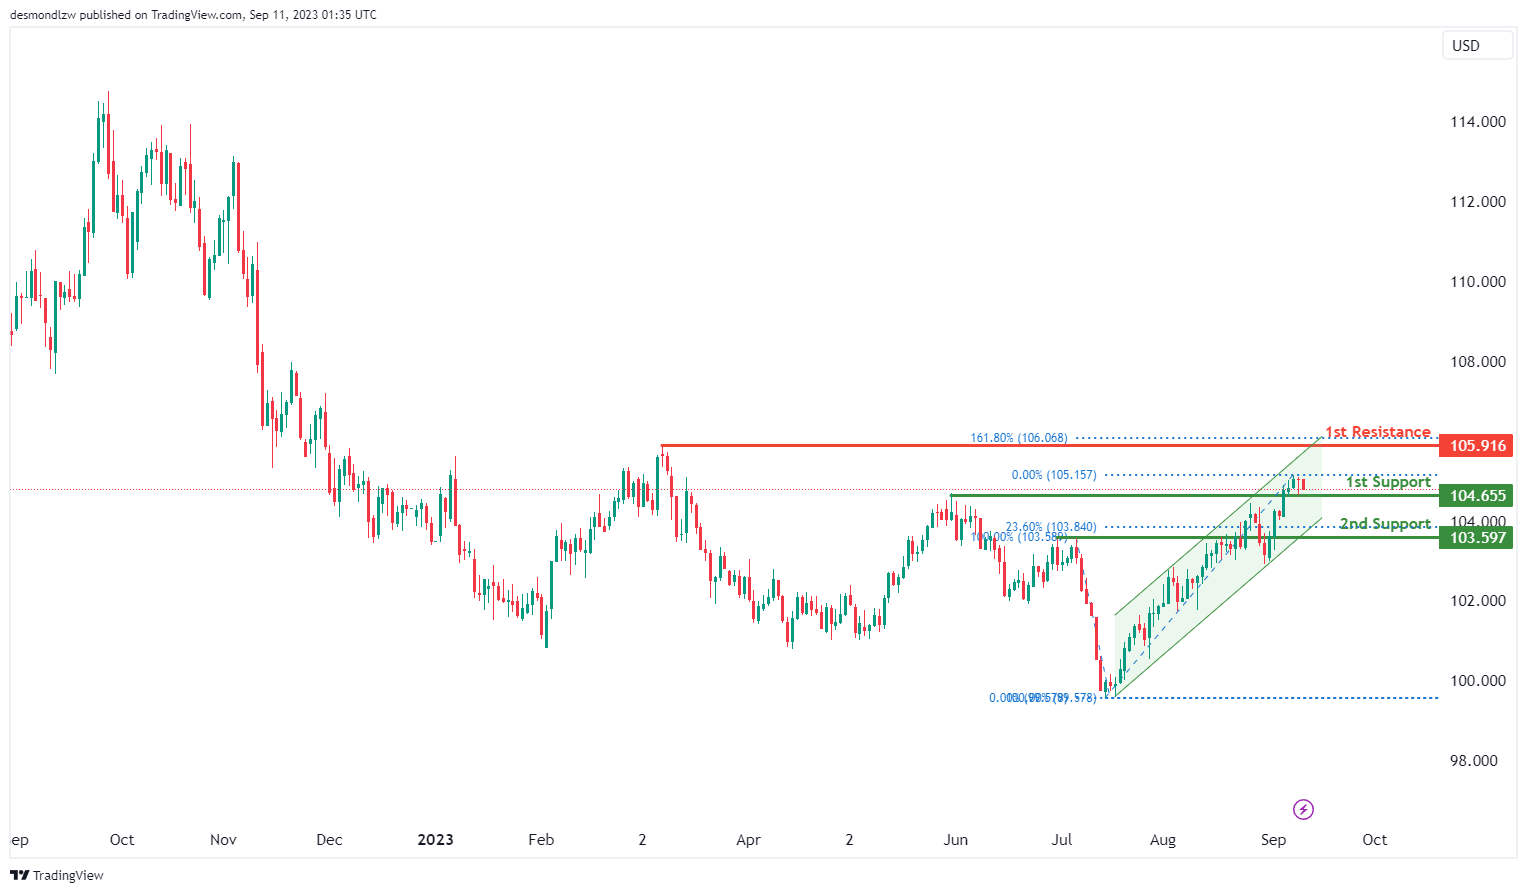
The DXY (US Dollar Index) chart currently displays a bullish overall momentum, with price situated within a bullish ascending channel.
There’s potential for a bullish bounce off the 1st support level at 104.65, identified as an overlap support.
Additionally, the 2nd support at 103.59 is noted as a pullback support, further reinforcing its significance as a potential area of price support.
On the resistance side, the 1st resistance at 105.91 is designated as an overlap resistance, and it aligns with the 161.80% Fibonacci Retracement level. This confluence of factors enhances its potential as a resistance zone.
EUR/USD:
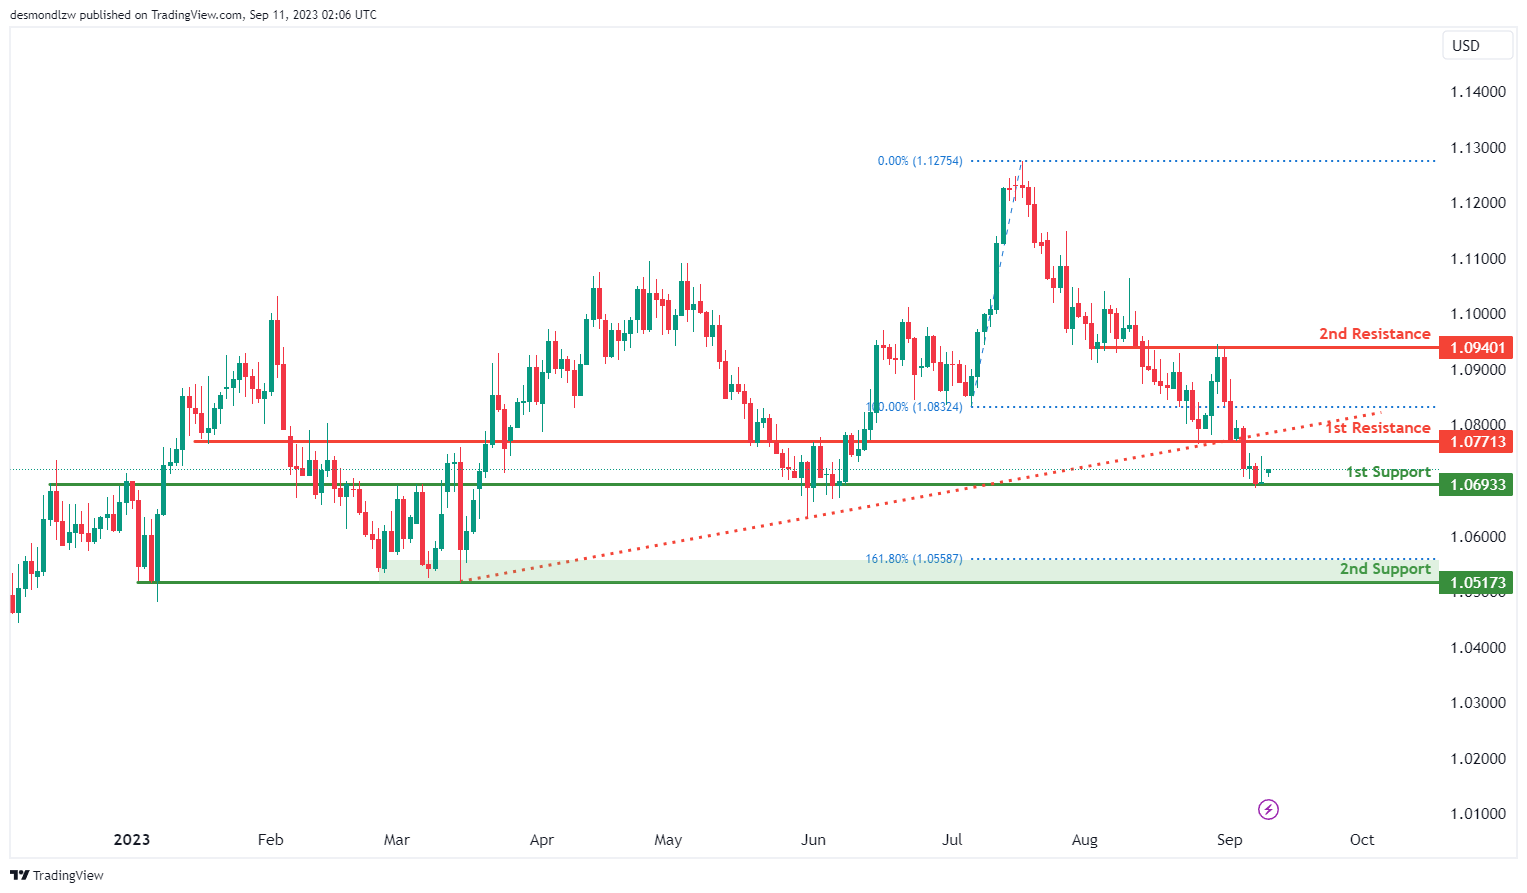
The EUR/USD chart is currently characterized by bearish momentum, with price positioned below a major descending trend line, indicating a potential for continued bearish movement.
There’s a possibility of a short-term rise in price towards the 1st resistance level at 1.0771 before a potential reversal and a drop towards the 1st support level.
The 1st support at 1.0693 is identified as an overlap support, providing a historical level of price support.
Additionally, the 2nd support at 1.0517 is significant as it represents multi-swing low support and aligns with the 161.80% Fibonacci Extension, further reinforcing its importance as a potential support zone.
On the resistance side, the 1st resistance at 1.0771 is considered significant as it acts as a pullback resistance.
Furthermore, the 2nd resistance at 1.0940 is marked as an overlap resistance, suggesting potential selling pressure in this area.
EUR/JPY:
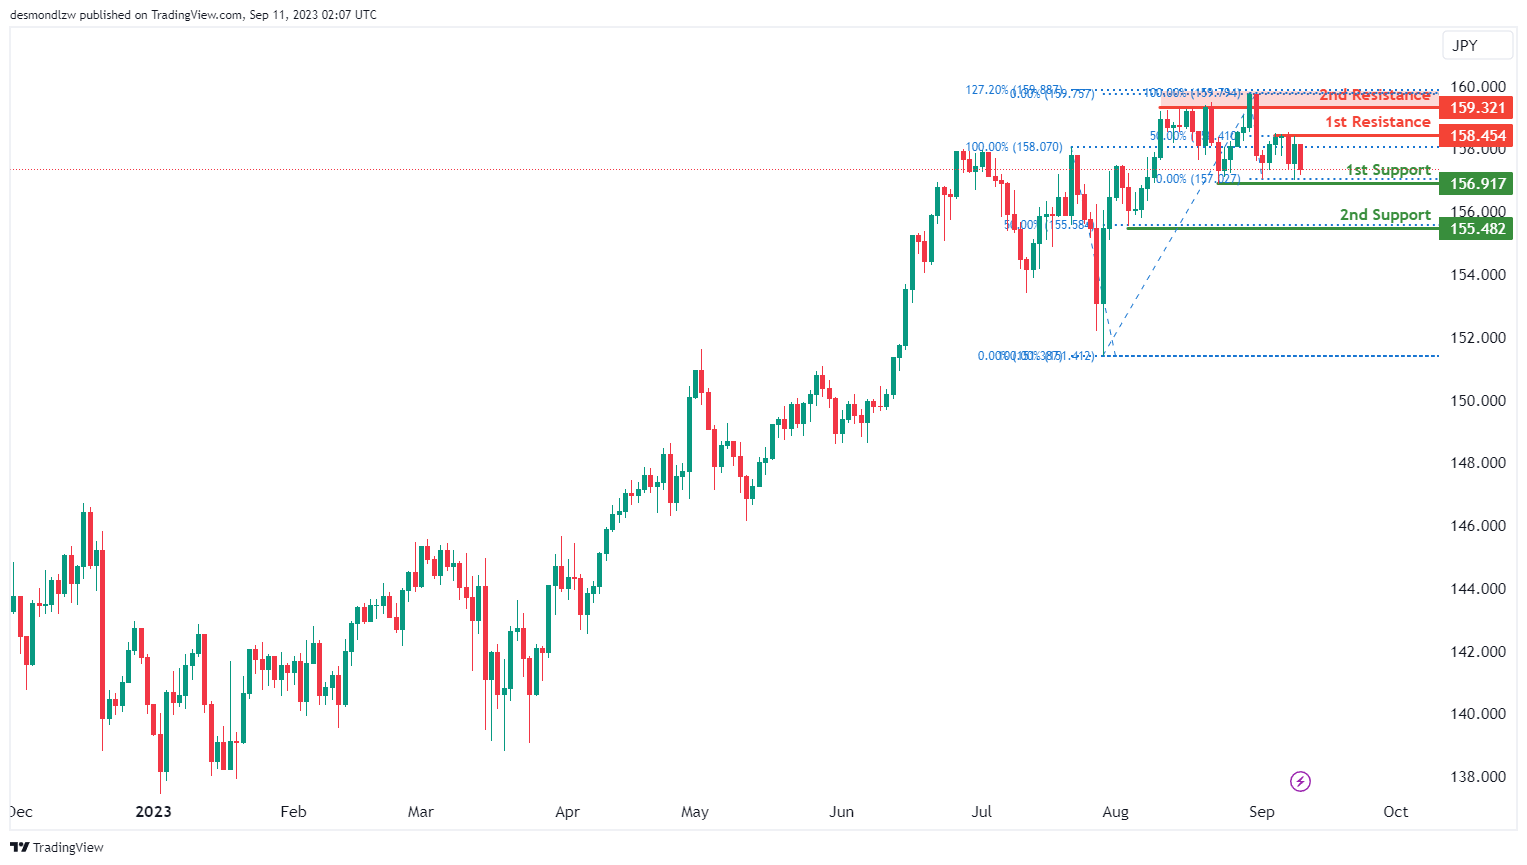
For EUR/JPY, the overall momentum of the chart is currently bearish, indicating a downward trend.
There is a potential for the price to continue its bearish movement towards the 1st support level at 156.91. The 1st support at 156.91 is considered significant because it represents multi-swing low support, suggesting potential stability at this level.
In the event of a more substantial decline, the 2nd support at 155.48 is also noteworthy. This support level is characterized as a swing low support and aligns with the 50% Fibonacci Retracement level, adding further significance to it.
On the other hand, if there’s a reversal in the price, it may encounter resistance at the 1st resistance level of 158.45, which is identified as a swing high resistance and is supported by a 50% Fibonacci Retracement.
Further upward movement could face resistance at the 2nd resistance level of 159.32, which is characterized as a pullback resistance and is aligned with the 127.20% Fibonacci Extension, potentially acting as a barrier to the bullish momentum.
EUR/GBP:
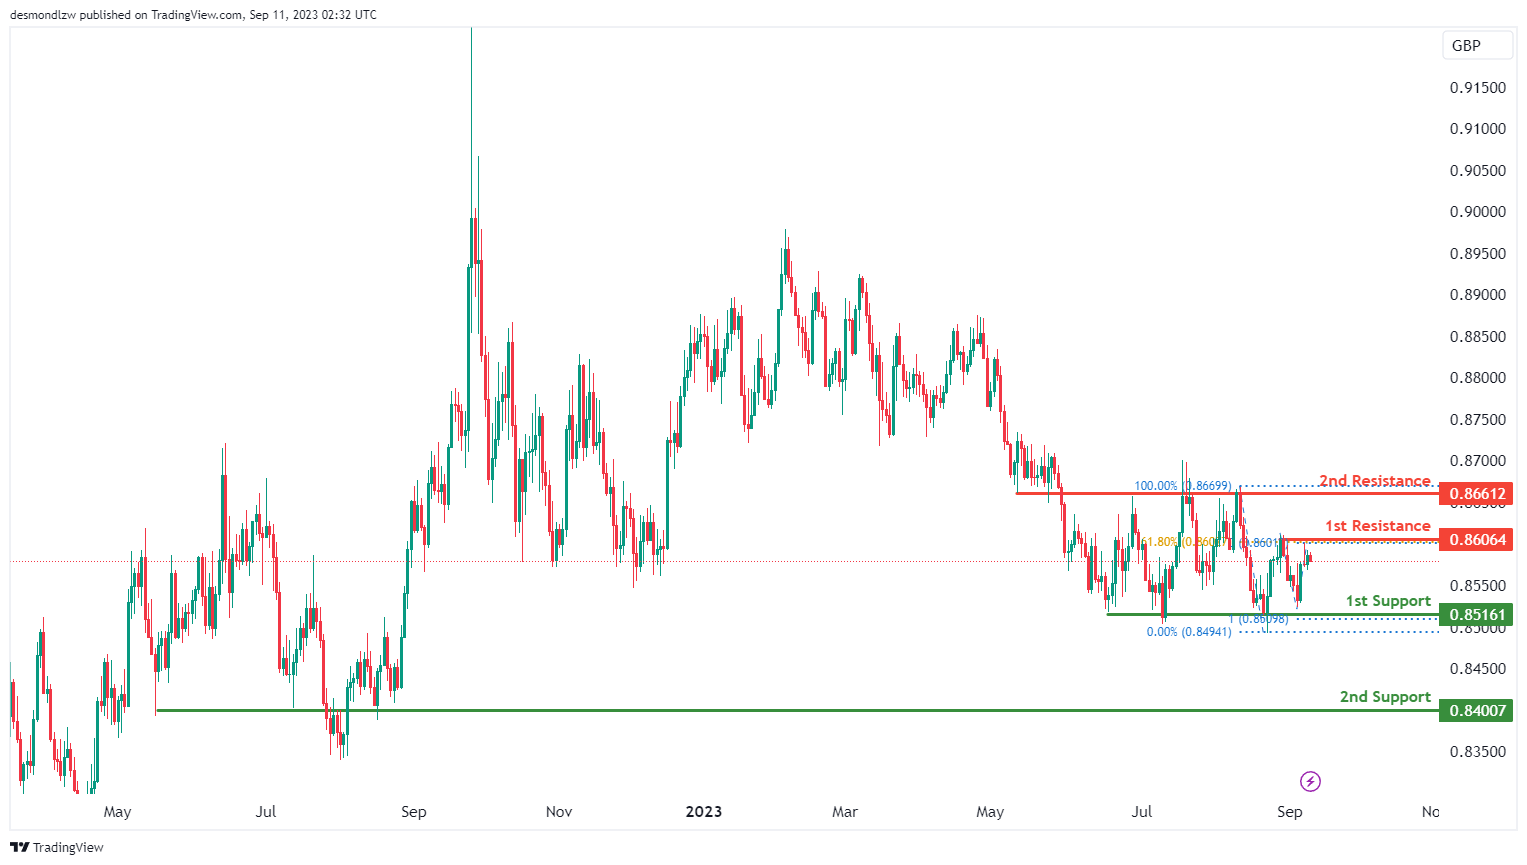
For EUR/GBP, the overall momentum of the chart is currently bearish, indicating a downward trend.
There is potential for the price to continue its bearish movement towards the 1st support level at 0.8516. This 1st support is considered significant because it represents multi-swing low support and aligns with the 100% Fibonacci Projection, suggesting a strong potential for support at this level.
In case of a more substantial decline, the 2nd support level at 0.8400 is also noteworthy as it acts as an overlap support.
On the upper side, if there’s a reversal in the price, it may face resistance at the 1st resistance level of 0.8606. This 1st resistance is considered important due to its characteristics as a swing high resistance and its alignment with the 61.80% Fibonacci Retracement level.
Further upward movement could encounter resistance at the 2nd resistance level of 0.8661, characterized as an overlap resistance, which may act as a barrier to the bullish momentum within the observed range.
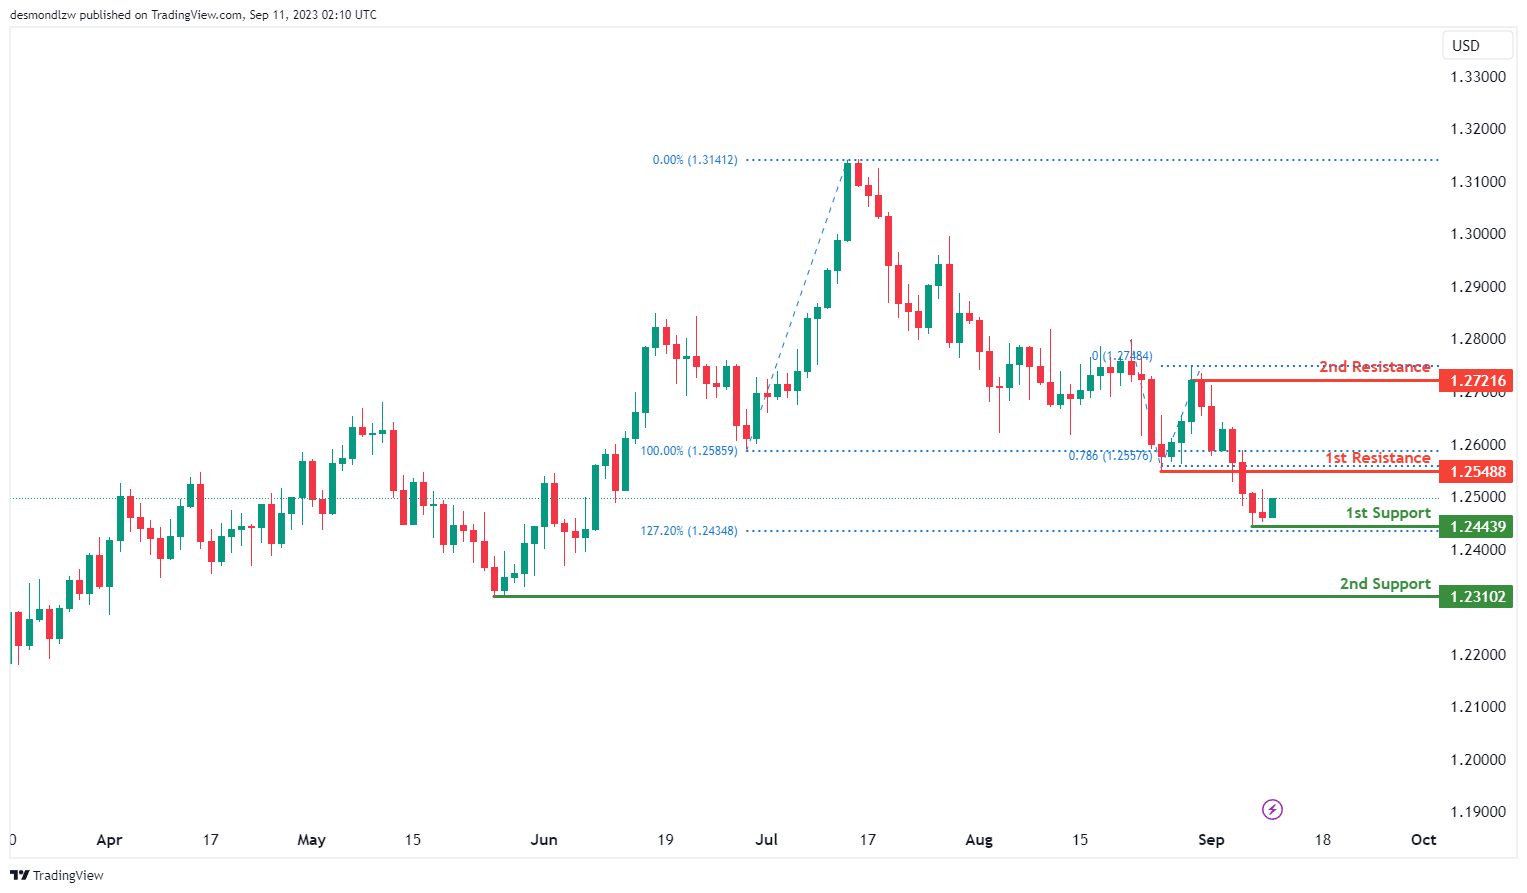
GBP/USD:
The GBP/USD chart currently demonstrates a bullish momentum, suggesting a potential upward trend in price movement.
There’s a likelihood of a bullish bounce off the 1st support level at 1.2443, which is supported by swing low characteristics and aligns with the 127.20% Fibonacci Expansion.
Additionally, another 1st support at 1.2310 is marked as a swing low support, further reinforcing its role as a potential area of price support.
Looking at resistance levels, the 1st resistance at 1.2548 is identified as a pullback resistance and is significant as it aligns with the 78.60% Fibonacci Projection.
Furthermore, the 2nd resistance at 1.2721 is notable as it represents swing high resistance.
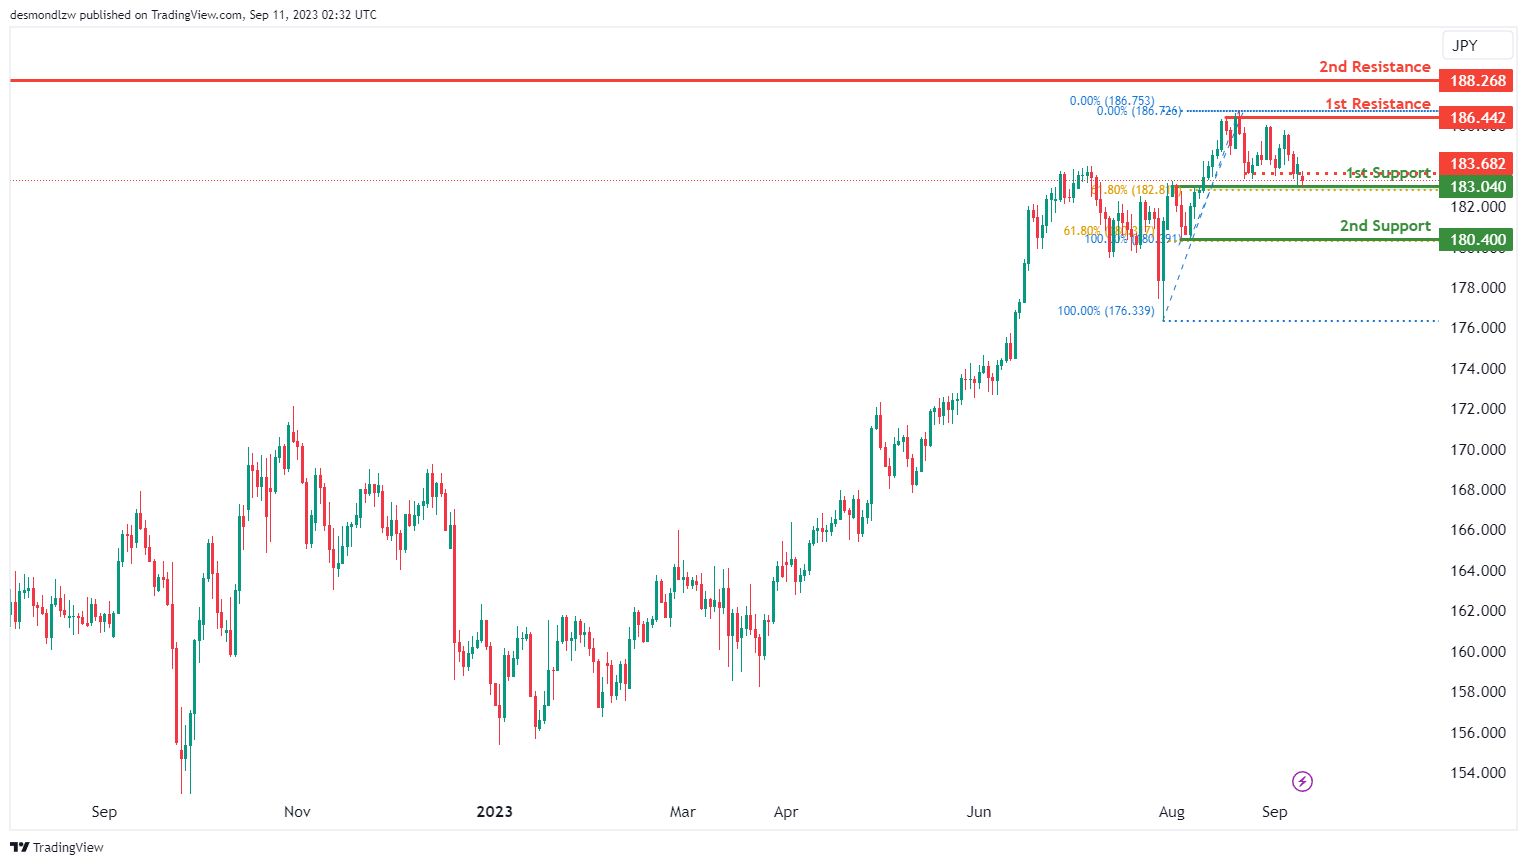
GBP/JPY:
For GBP/JPY, the overall momentum of the chart is currently bullish, indicating an upward trend.
There is potential for the price to make a bullish move by bouncing off the 1st support level at 183.04 and heading towards the 1st resistance at 186.42.
The 1st support at 183.04 is considered significant because it represents an overlap support and aligns with the 61.80% Fibonacci Retracement level, suggesting potential stability and support at this level.
In the event of a more substantial retracement, the 2nd support level at 180.40 is also noteworthy as it acts as a swing low support and coincides with the 61.80% Fibonacci Retracement, offering additional reinforcement for the price.
On the upper side, the 1st resistance at 186.42 is considered important due to its characteristics as multi-swing high resistance, indicating potential resistance to upward movement.
Further upward movement may encounter resistance at the 2nd resistance level of 188.26, characterized as multi-swing high resistance, which could pose a significant barrier to the bullish momentum.
Additionally, there is an intermediate resistance level at 183.68, identified as pullback resistance, which may temporarily slow down the bullish momentum within the observed range.
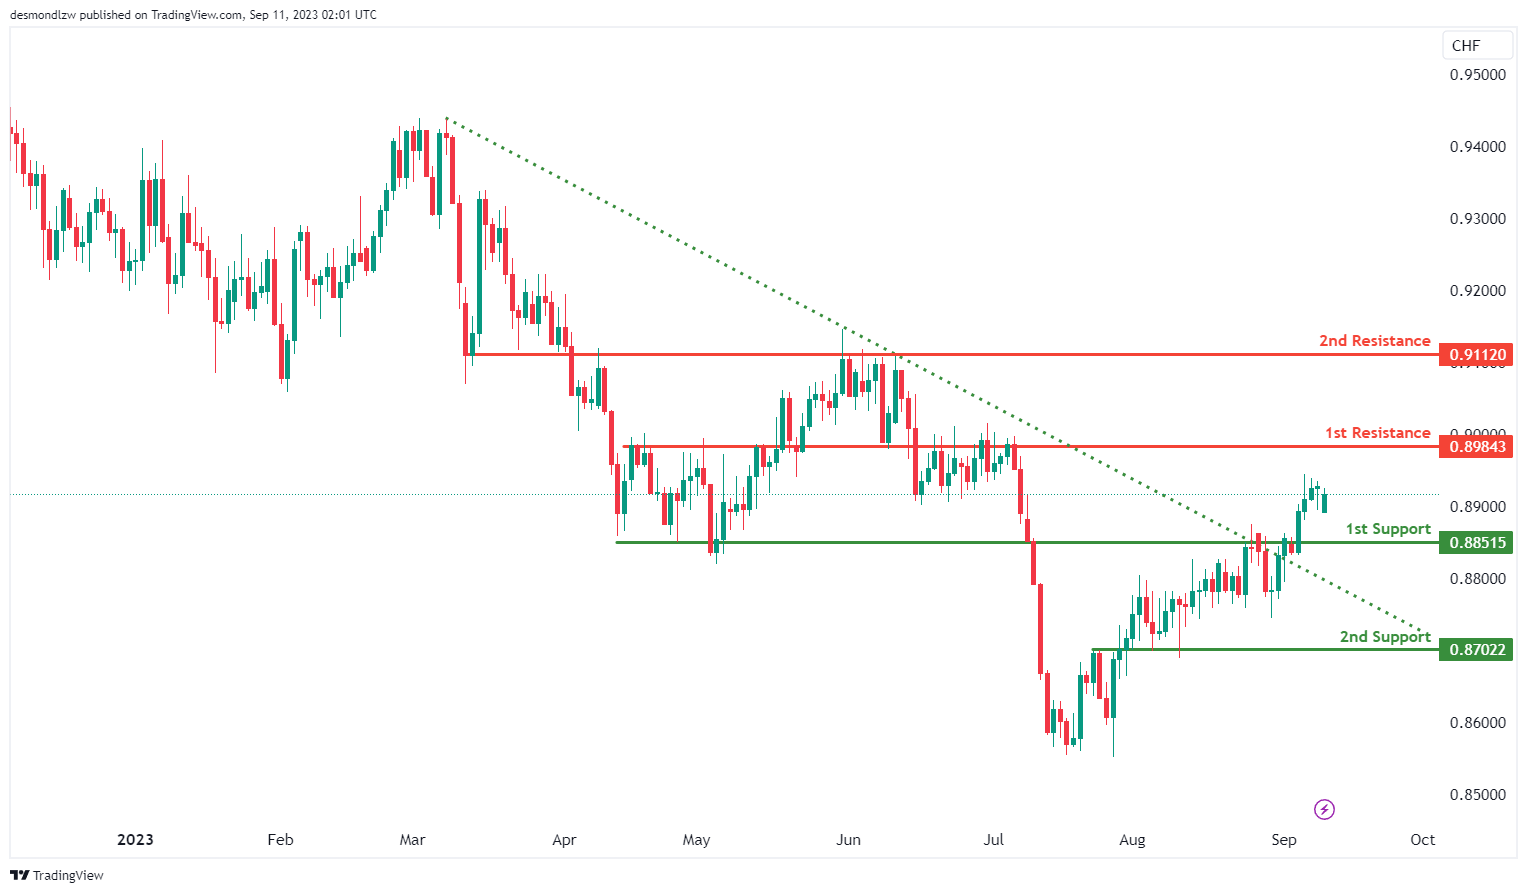
USD/CHF:
The USD/CHF chart currently displays a bullish momentum, primarily driven by the breakout above a descending resistance line, indicating the potential for an upward price movement.
There’s a likelihood of a bullish continuation towards the 1st resistance level at 0.8984, which is identified as an overlap resistance.
On the support side, the 1st support at 0.8851 is considered a pullback support, indicating its significance as a potential area of price support.
Additionally, the 2nd support at 0.8702 is marked as an overlap support, further reinforcing its potential role as a support level.
Furthermore, the 2nd resistance at 0.9112 is also noted as an overlap resistance, which could potentially act as a barrier to further bullish movements.
.
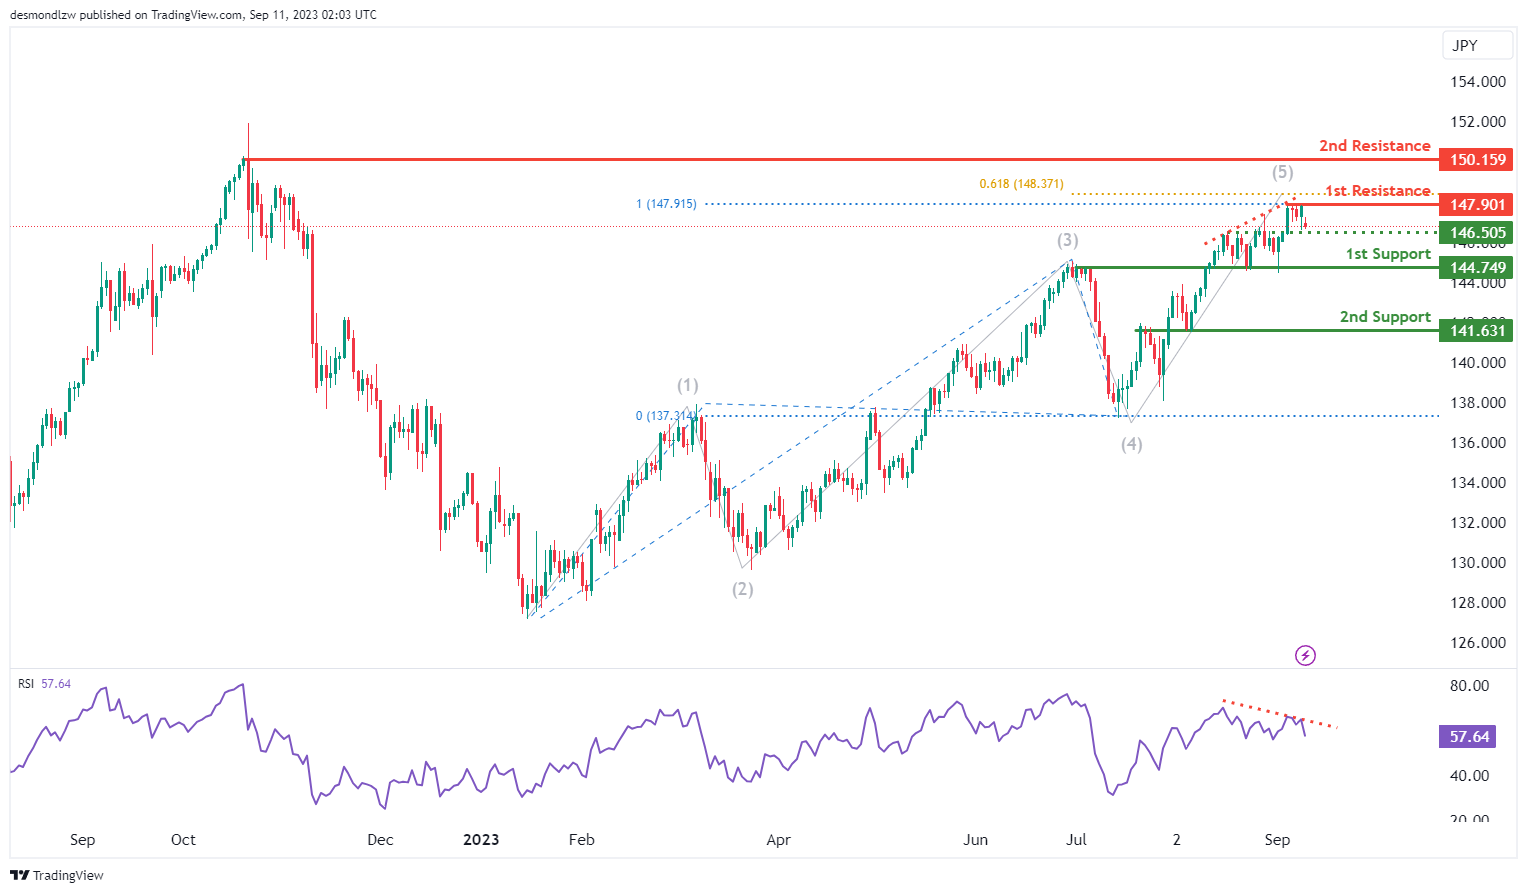
USD/JPY:
The USD/JPY chart currently exhibits a bearish momentum, suggesting a potential downward trend in price movement.
There’s a likelihood of a bearish continuation towards the 1st support level at 144.74, which is identified as an overlap support.
Additionally, the 2nd support at 141.63 is marked as an overlap support, further reinforcing its potential role as a support level.
On the resistance side, the 1st resistance at 147.90 is considered significant as it represents swing high resistance, potentially acting as a barrier to any bullish movements.
Furthermore, the 2nd resistance level at 150.15 is also noted as swing high resistance, further indicating potential resistance in this area.
Intermediate support is observed at 146.50, identified as an overlap support, adding to the potential significance of this level.
It’s important to note that RSI is displaying bearish divergence versus price, suggesting the likelihood of a rapid decline in price, aligning with the overall bearish momentum.
USD/CAD:
The USD/CAD chart currently indicates an overall bearish momentum, suggesting a potential downward trend in price movement.
There is a possibility of a bearish continuation towards the 1st support level at 1.3515, which is identified as an overlap support. Additionally, the 2nd support level at 1.3367 is also marked as an overlap support, further reinforcing its role as a potential support zone.
To the upside, the 1st resistance level at 1.3677 is identified as an overlap resistance while the 2nd resistance level at 1.3837 is also noted as an overlap resistance, reinforcing its potential as a resistance level.

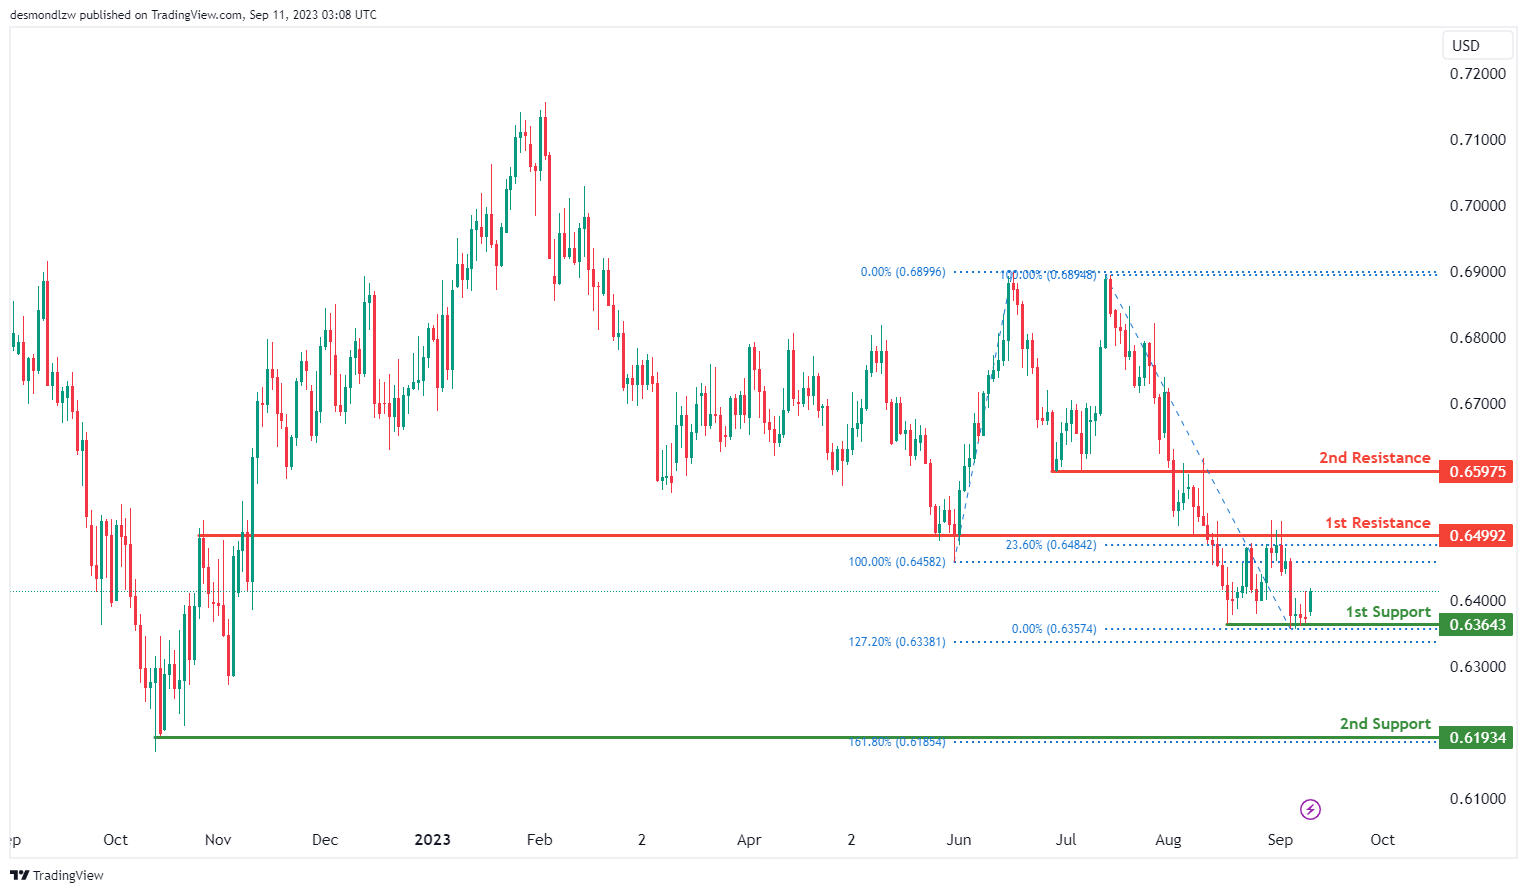
AUD/USD:
The AUD/USD chart currently exhibits an overall bullish momentum, indicating a potential upward trend in price movement.
There’s a likelihood of a bullish continuation towards the 1st resistance level at 0.6499 which is identified as an overlap resistance that aligns with the 23.60% Fibonacci retracement level. Furthermore, the 2nd resistance level at 0.6598 is also identified as an overlap resistance.
To the downside, the 1st support level at 0.6364 is identified as a pullback support that aligns with the 127.20% Fibonacci extension level while the 2nd support level at 0.6193 is also marked as a pullback support that aligns with the 161.80% Fibonacci extension level, further enhancing its role as a potential support zone.
NZD/USD
The NZD/USD chart currently demonstrates an overall bullish momentum, suggesting a potential upward trend in price movement.
There is a likelihood of a bullish breakout through the 1st resistance level at 0.5902 which is identified as an overlap resistance. Furthermore, a successful breakthrough of the 1st resistance level could lead to a further rise towards the 2nd resistance level at 0.5985. This level is also marked as an overlap resistance that aligns with the 23.60% Fibonacci retracement level.
To the downside, the 1st support level at 0.5749 is identified as an overlap support that aligns with the 78.60% Fibonacci retracement level, highlighting its significance as a potential area of price support.

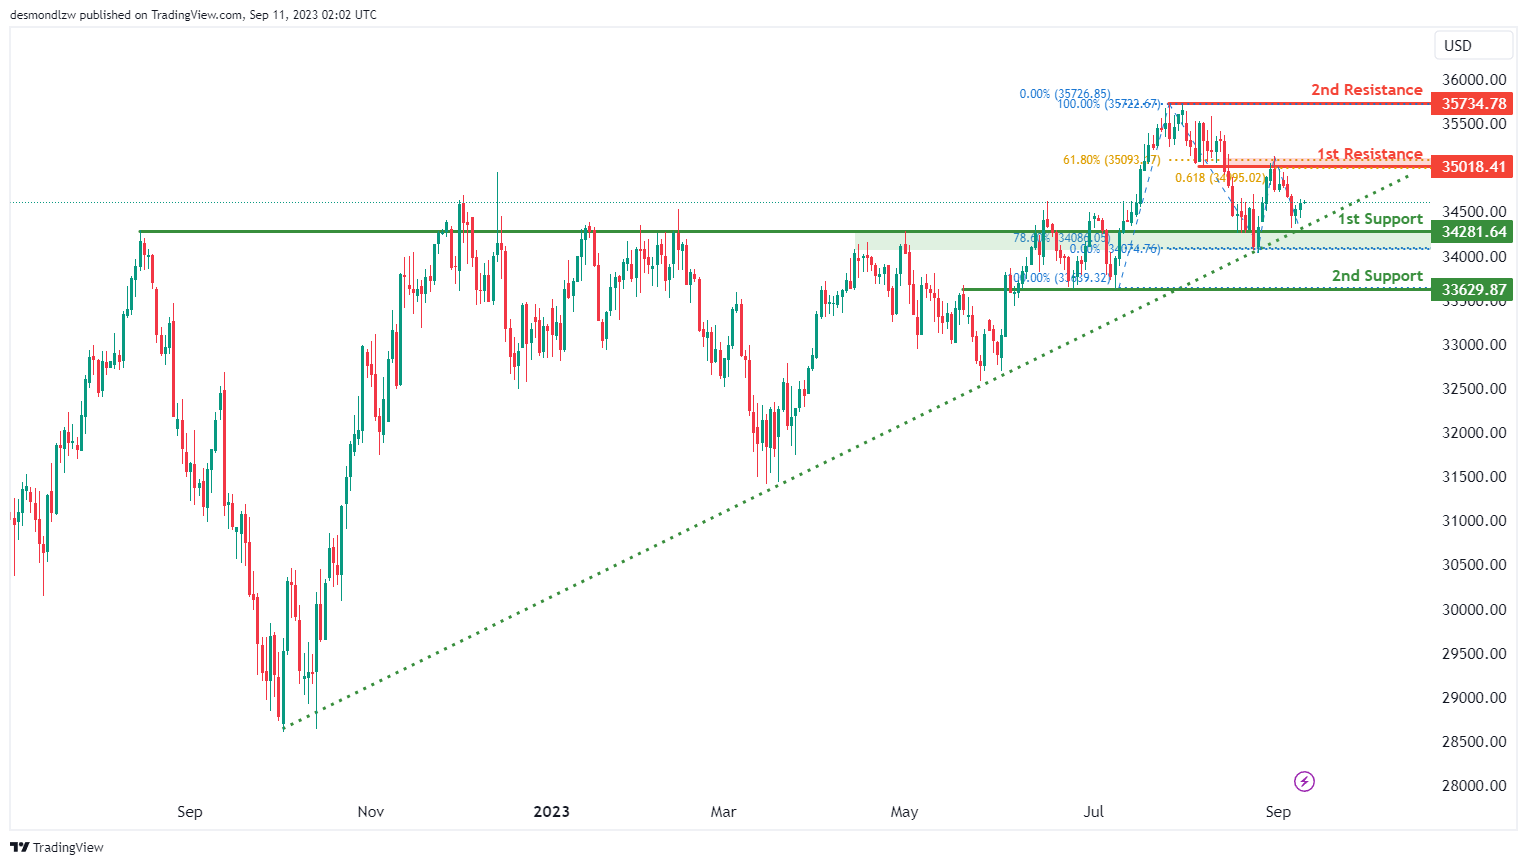
DJ30:
For DJ30, the overall chart momentum is currently bullish, and this bullish sentiment is reinforced by the fact that the price is positioned above a major ascending trend line, which suggests further bullish momentum in the future.
There’s potential for the price to continue its bullish movement towards the 1st resistance level at 35081.41. This 1st resistance is considered significant because it represents an overlap resistance and is supported by both a 61.80% Fibonacci Retracement and a 61.80% Fibonacci Projection, indicating Fibonacci confluence.
In case of a retracement, the 1st support level at 34281.64 is notable due to its characteristics as an overlap support and its alignment with the 78.60% Fibonacci Retracement level. Additionally, the 2nd support at 33629.87 also acts as an overlap support.
If the price continues to rise, it might encounter the 2nd resistance at 35734.78, which is identified as a swing high resistance. This level could pose as a significant obstacle to further upward movement.
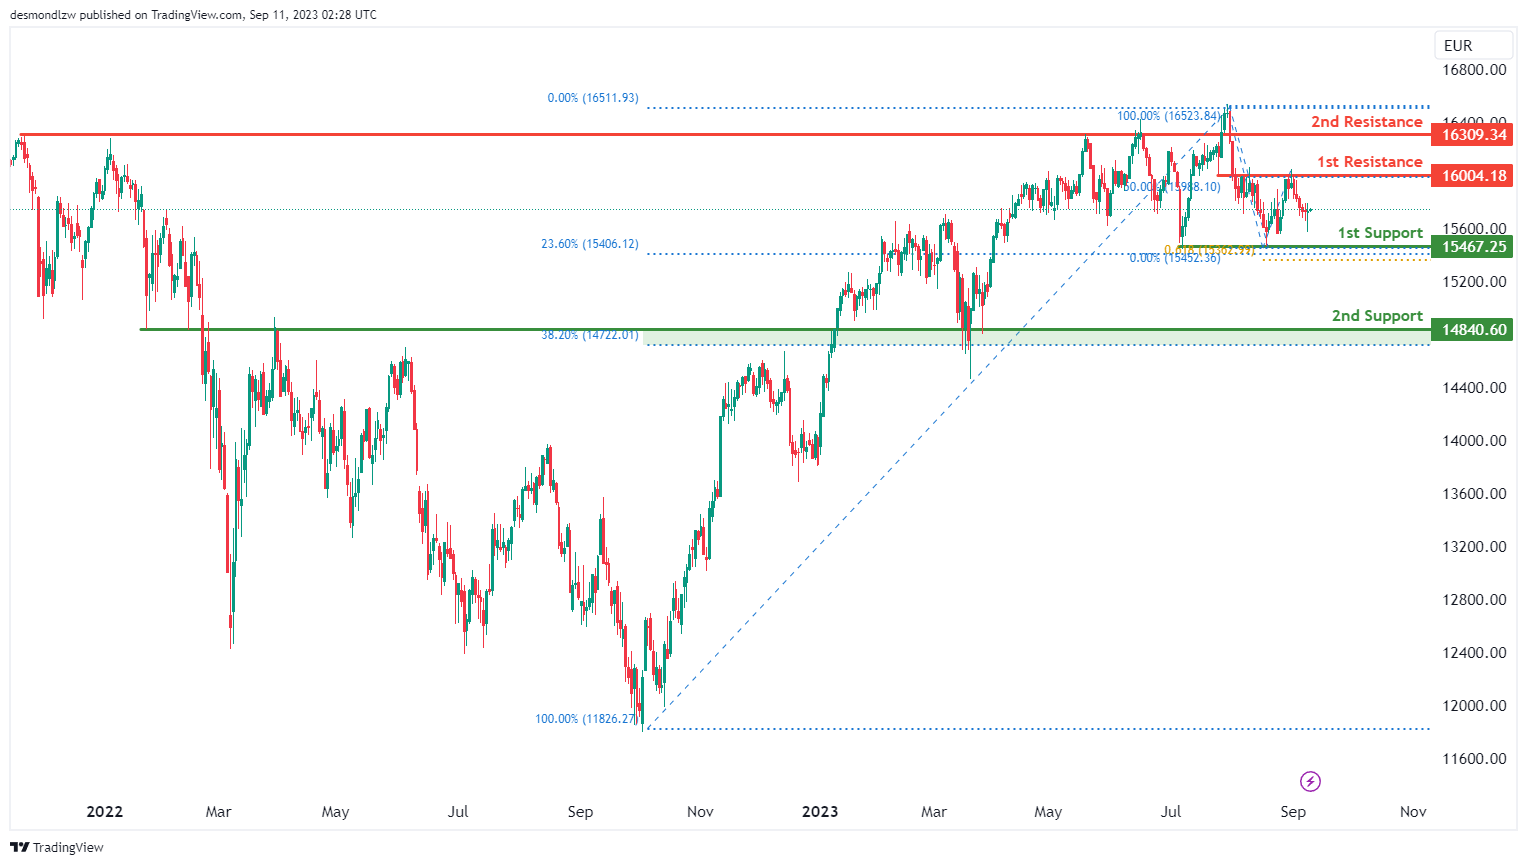
GER30:
For GER30, the overall momentum of the chart is currently bearish, indicating a downward trend.
There is potential for the price to continue its bearish movement towards the 1st support level at 15467.25. This 1st support level is considered significant because it represents multi-swing low support and aligns with both the 23.60% Fibonacci Retracement and the 61.80% Fibonacci Projection. This indicates a Fibonacci confluence, suggesting strong potential support at this level.
In case of a more significant decline, the 2nd support level at 14840.60 is also noteworthy. This support level is characterized as an overlap support and aligns with the 38.20% Fibonacci Retracement, adding further significance to it.
On the upper side, if there’s a reversal in the price, it may face resistance at the 1st resistance level of 16026.10. This 1st resistance is considered significant due to its properties as an overlap resistance and its alignment with the 50% Fibonacci Retracement level.
Further upward movement could encounter resistance at the 2nd resistance level of 16309.34, characterized as a pullback resistance, which may act as a barrier to the bullish momentum within the observed range.
US500
For US500, the overall momentum of the chart is currently bearish, indicating a downward trend.
There is a potential for the price to make a bearish move by breaking below the 1st support level at 4459.6 and then dropping towards the 2nd support at 4327.3. The 1st support at 4459.6 is considered significant because it represents an overlap support and aligns with the 50% Fibonacci Retracement level.
If the bearish momentum continues, the 2nd support at 4327.3 is also noteworthy as it acts as an overlap support and aligns with the 78.60% Fibonacci Projection, providing additional support for this level.
On the other hand, if there’s a reversal in the price, it may face resistance at the 1st resistance level of 4540.0, which is identified as a swing high resistance and is supported by a 38.20% Fibonacci Retracement.
Further upward movement could encounter the 2nd resistance level at 4608.8, which is also characterized as a swing high resistance, potentially acting as a barrier to the bullish momentum.

BTC/USD:
For BTC/USD, the overall momentum of the chart is currently bullish, indicating an upward trend.
There is potential for the price to make a bullish move by bouncing off the 1st support level at 25416 and heading towards the 1st resistance at 28414.
The 1st support at 25416 is considered significant because it represents an overlap support and aligns with the 100% Fibonacci Projection, suggesting potential stability at this level.
In case of a more substantial retracement, the 2nd support at 22851 is also noteworthy as it is identified as a 127.20% Fibonacci Extension, which can provide additional support for the price.
On the upper side, the 1st resistance at 28414 is considered important as it represents pullback resistance and aligns with the 50% Fibonacci Retracement, indicating potential resistance to further upward movement.
If the bullish momentum continues, it might face resistance at the 2nd resistance level of 27302, which is characterized as an overlap resistance and may pose a barrier to the bullish trend.

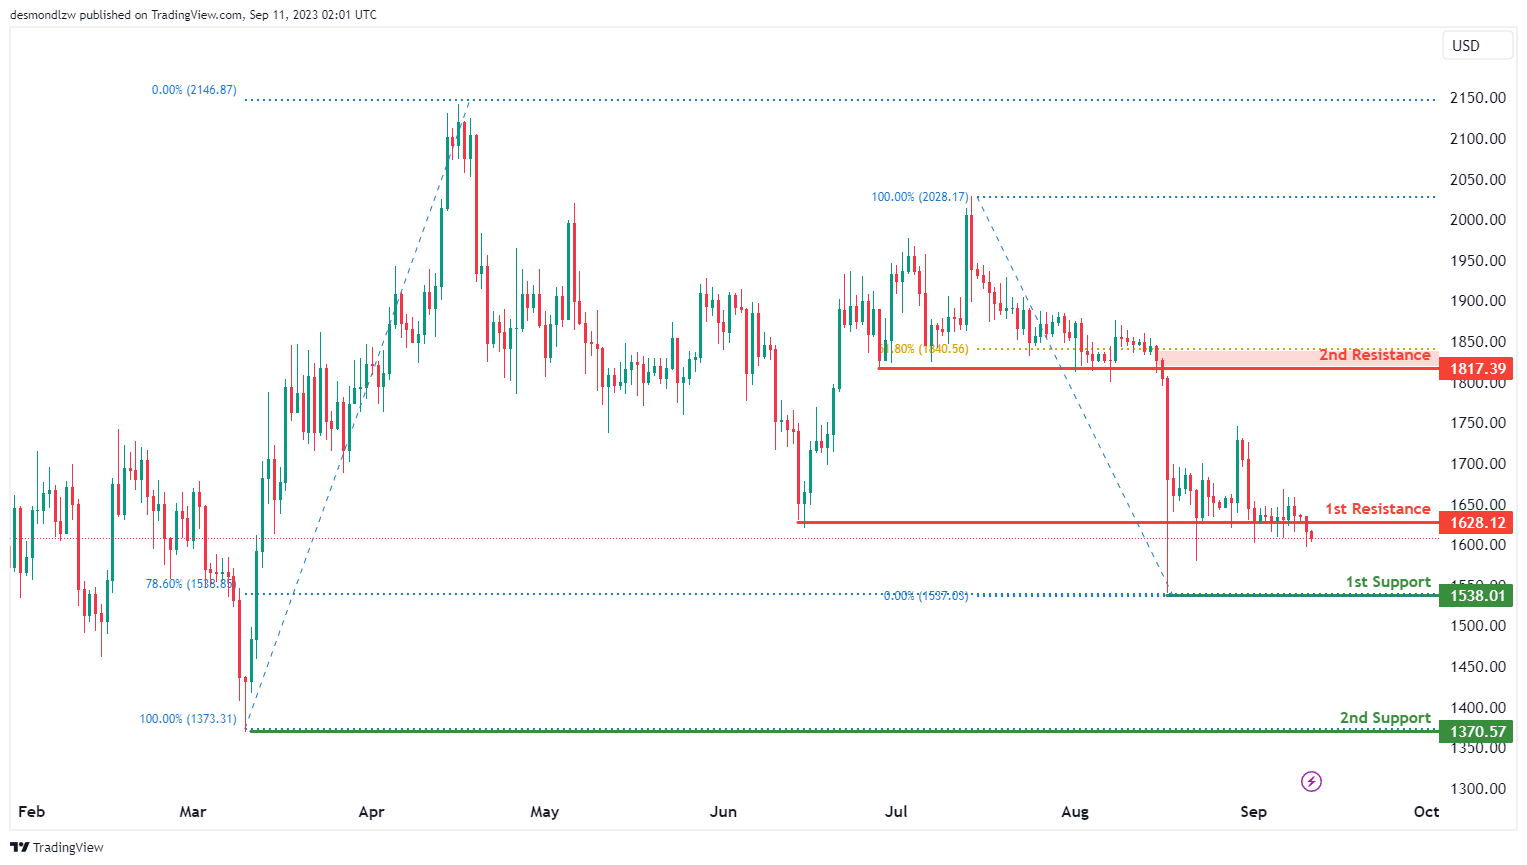
ETH/USD:
For ETH/USD, the overall momentum of the chart is currently bearish, indicating a downward trend.
There is potential for the price to continue in a bearish direction towards the 1st support level at 1538.01. This 1st support is considered significant because it represents a swing low support and aligns with the 78.60% Fibonacci Retracement level, suggesting potential stability at this point.
In case of a more substantial decline, the 2nd support level at 1370.57 is also noteworthy as it acts as a swing low support, offering potential additional support to the price.
On the other hand, if there’s a reversal in the price, it may face resistance at the 1st resistance level of 1628.12, identified as pullback resistance.
Further upward movement could encounter resistance at the 2nd resistance level of 1817.39, characterized as a pullback resistance and coinciding with the 61.80% Fibonacci Retracement level, potentially acting as a barrier to the bullish momentum.
WTI/USD:
The WTI (West Texas Intermediate) chart currently exhibits a neutral overall momentum, indicating a lack of a clear bullish or bearish trend. Given this neutral momentum, there is a possibility that price could fluctuate between the 1st support and 1st resistance levels.
The 1st support level at 84.46 is identified as a pullback support that aligns with the 23.60% Fibonacci retracement level while the 2nd support level at 77.49 is marked as an overlap support, suggesting historical instances of price finding support around this level.
To the upside, the 1st resistance at 87.41 is identified as a swing-high resistance that aligns with the 61.80% Fibonacci projection level. In addition, the 2nd resistance level at 92.29 is noted as a multiple swing-high resistance that aligns with the 78.60% Fibonacci projection level, further enhancing its potential as a resistance level.

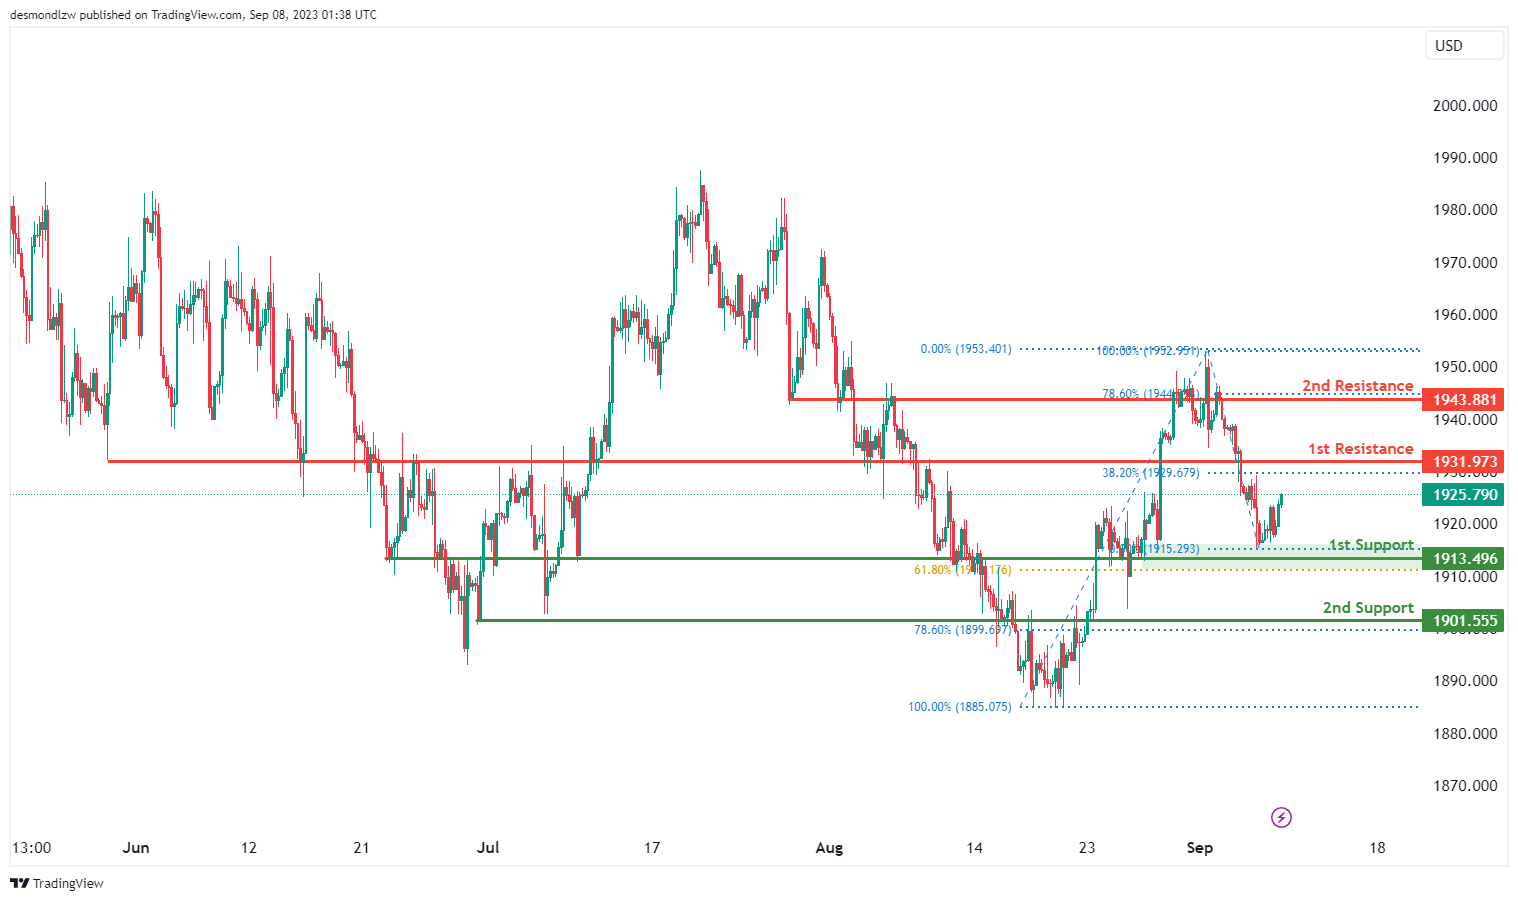
XAU/USD (GOLD):
The XAU/USD chart currently exhibits a bearish overall momentum, indicating a potential downward trend in price movement. This is supported by the fact that the price is below a major descending trend line, reinforcing the notion of bearish momentum.
There’s a possibility of a short-term rise in price towards the 1st resistance level at 1945.31 before a potential reversal and a drop towards the 1st support.
The 1st support level at 1906.85 is considered significant as it represents an overlap support and aligns with the 61.80% Fibonacci Retracement level, indicating a strong potential support zone.
Additionally, the 2nd support at 1888.80 is also marked as an overlap support and aligns with the 78.60% Fibonacci Retracement, further reinforcing its potential role as a support level.
On the resistance side, the 1st resistance at 1945.31 is identified as an overlap resistance, potentially acting as a barrier to any bullish movements.
Furthermore, the 2nd resistance level at 1981.69 is noted as an overlap resistance, indicating potential resistance in this area.
The accuracy, completeness and timeliness of the information contained on this site cannot be guaranteed. IC Markets does not warranty, guarantee or make any representations, or assume any liability regarding financial results based on the use of the information in the site.
News, views, opinions, recommendations and other information obtained from sources outside of www.icmarkets.com, used in this site are believed to be reliable, but we cannot guarantee their accuracy or completeness. All such information is subject to change at any time without notice. IC Markets assumes no responsibility for the content of any linked site.
The fact that such links may exist does not indicate approval or endorsement of any material contained on any linked site. IC Markets is not liable for any harm caused by the transmission, through accessing the services or information on this site, of a computer virus, or other computer code or programming device that might be used to access, delete, damage, disable, disrupt or otherwise impede in any manner, the operation of the site or of any user’s software, hardware, data or property.


