
Key risk events today:
Australia Retail Sales m/m; China Inflation (CPI/PPI) y/y; BOC Business Outlook Survey; ECB President Lagarde Speaks.
(Previous analysis as well as outside sources – italics).
EUR/USD:
Weekly gain/loss: +0.03% (Flat)
Weekly close: 1.2218
Weekly perspective:
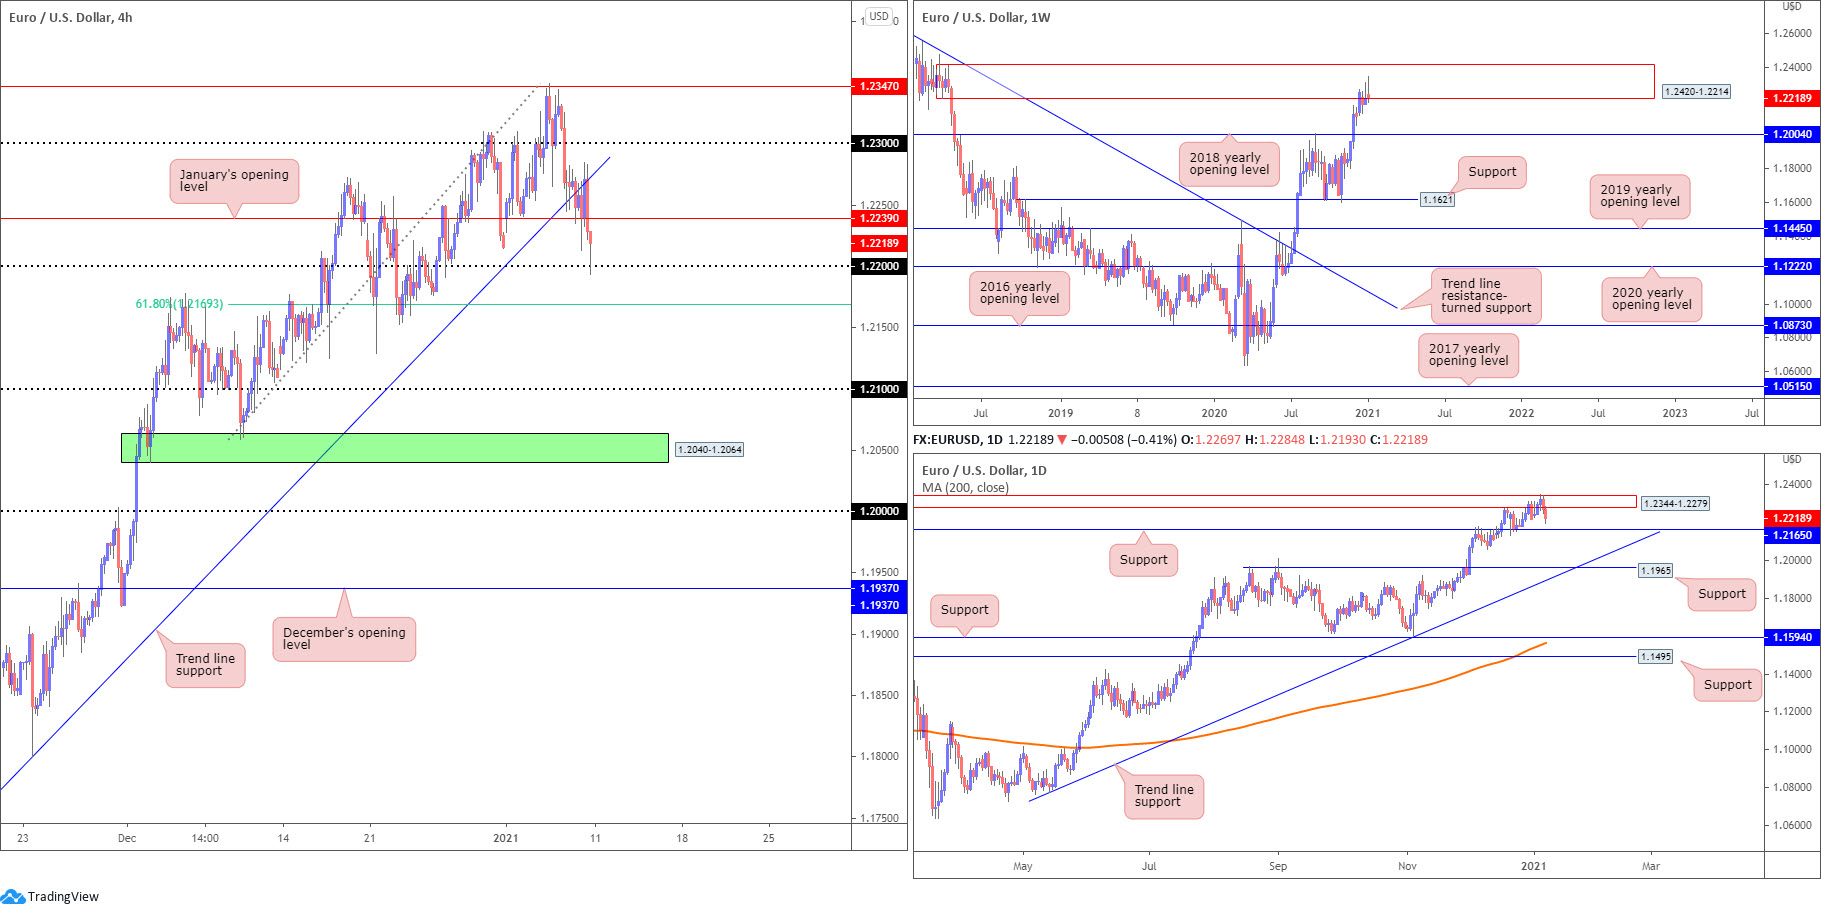
Supply at 1.2420-1.2214 remains central focus on the weekly scale, with last week establishing a shooting star pattern off multi-month peaks at 1.2349.
Should sellers take the reins, the 2018 yearly opening value at 1.2004 is likely a level downside movement may target.
In terms of trend, however, upside remains favoured – more so if price overthrows the 1.2555 February 12 high (2018). The above implies buyers could take the wheel and attempt to overthrow the aforementioned supply zone.
Daily perspective:
Nestled within the walls of weekly supply mentioned above at 1.2420-1.2214 is a daily supply base coming in at 1.2344-1.2279.
1.2344-1.2279 remained a key zone last week, with price action now honing in on support drawn from 1.2165. A break of this boundary not only lays the basis for further selling to another support at 1.1965 (and trend line support, taken from the low 1.0774), a bearish move would also add conviction to the weekly timeframe’s recent shooting star to weekly support at 1.2004 (sited just above 1.1965 daily support).
H4 perspective:
According to the US Bureau of Labour Statistics on Friday, total non-farm employment fell by 140,000 in December vs. expectations of a 60,000 rise – the first decline in employment since the job market started to recover in May. The US unemployment rate was unchanged at 6.7% (expected: 6.8%), and average hourly earnings jumped to 0.8% from 0.3% (expected: 0.2%).
Employment data caused a minor USD sell-off, though was not really anything to write home about. The US dollar index finished the week strongly off multi-year lows, consequently directing EUR/USD H4 candles south of trend line support, extended from the low 1.1602, and January’s opening value at 1.2239 towards the 1.22 figure.
1.22. together with daily support at 1.2165 (merges with a 61.8% H4 Fibonacci retracement ratio at 1.2169), appear to be all that stands in the way of 1.21 (H4) making an appearance this week.
Areas of consideration:
- The area between the 1.22 figure and daily support at 1.2165 could prove interesting support.
- Longer term, although the trend has faced an upward trajectory since early 2020, weekly price displays signs of weakness within supply at 1.2420-1.2214, in the shape of a shooting star.
- With the two above points taken on board, 1.2165/1.22 is likely to be a key zone this week. A reaction suggests possible dip buying is in play, in line with the current uptrend; a break beneath 1.2165/1.22, nevertheless, helps confirm weekly price and implies the unit could be headed for at least 1.21.
GBP/USD:
Weekly gain/loss: -0.74%
Weekly close: 1.3554
Weekly perspective:
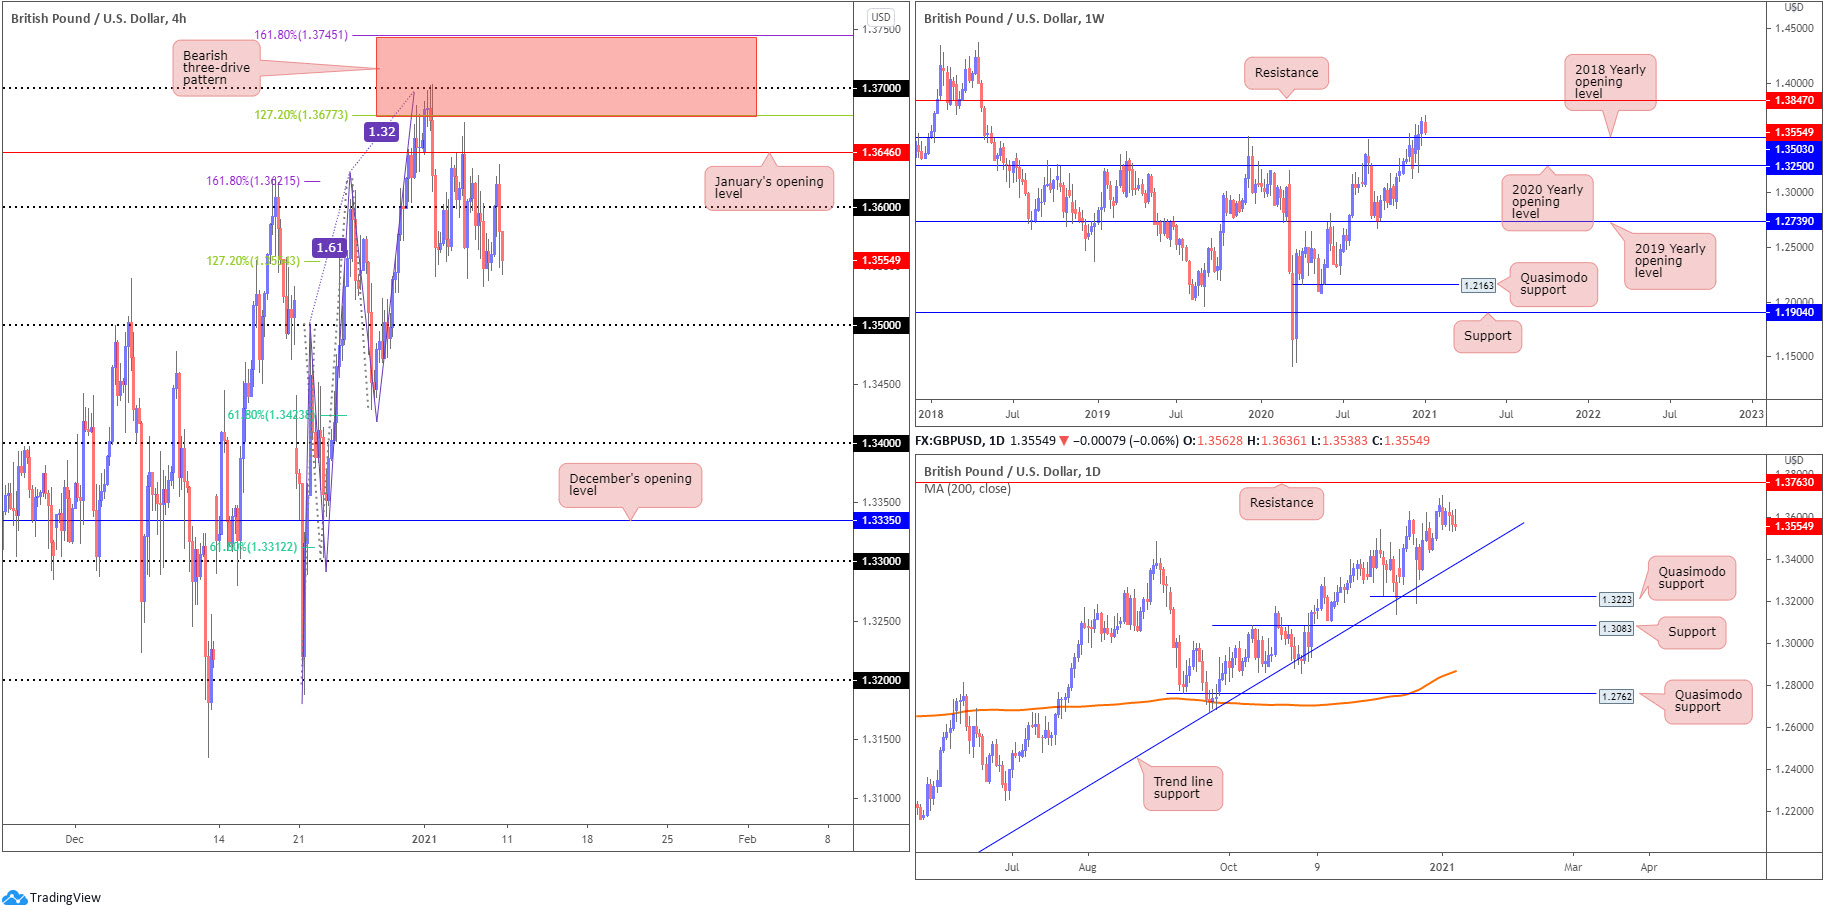
Price faded 2021 yearly peaks at 1.3703 last week, on track to possibly cross swords with support at 1.3503 this week, the 2018 yearly opening value. To the upside, resistance at 1.3847 is on the radar.
Also of technical interest is a recent engulf of 1.3514 (December 9 [2019] high), helping to confirm the current uptrend (since early 2020).
Daily perspective:
From the daily timeframe, price is seen hovering between 1.3763 resistance (previous Quasimodo support level) and trend line support, etched from the low 1.1409.
As a result, focus is likely to remain on the two aforementioned levels this week.
H4 perspective:
Despite last week kicking off with reasonably dominant downside from 1.37 (surrounded by a three-drive bearish reversal zone – 1.3745/1.3677), price action spent the week fluctuating around 1.36, south of January’s opening value at 1.3646
Friday’s session was mostly unresponsive to US labour data, though the pair concluded south of the 1.36 figure. H4 support next on tap is likely to form around the 1.35 area (converges with the 2018 yearly opening value mentioned above on the weekly timeframe at 1.3503).
Areas of consideration:
- 35 stands as potentially strong support this week, not only merging with weekly support at 1.3503 but also forms in conjunction with the current uptrend.
- 34, should 1.35 offer little support, may also interest, having seen the level merge with daily trend line support, taken from the low 1.1409.
AUD/USD:
Weekly gain/loss: +0.86%
Weekly close: 0.7766
Weekly perspective:
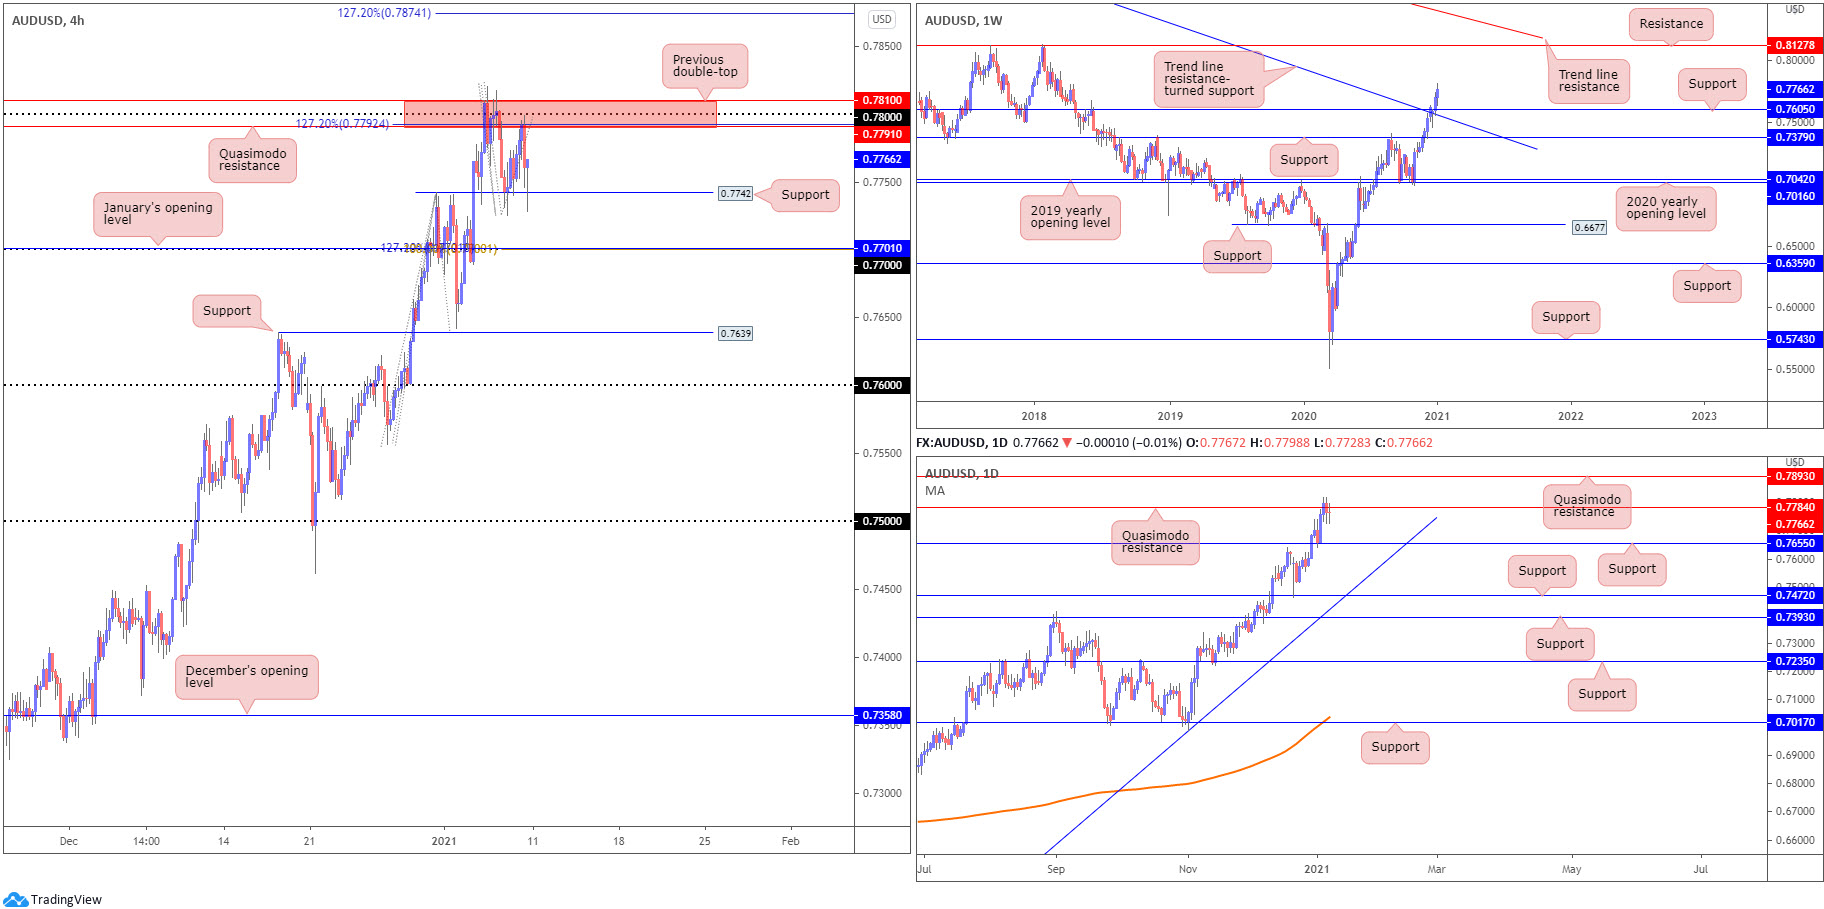
The Australian dollar wrapped up another week on the front foot against the US dollar, sailing to a fresh 30-month high at 0.7820 and further fuelling the current uptrend.
Late 2020 saw price glide through Quasimodo resistance at 0.7605 (now serving support) and trend line resistance, taken from the high 1.1065.
This places buyers in a strong position with room to possibly reach as far north as resistance coming in at 0.8127.
Daily perspective:
Price action on the daily timeframe shook hands with Quasimodo resistance priced in at 0.7784, which, as you can see, posed somewhat of a problem for buyers in recent days. Should sellers intensify their position this week, chart studies indicate support at 0.7655 could make an appearance. Be that as it may, an advance beyond 0.7784 shines the technical spotlight on another Quasimodo resistance at 0.7893.
H4 perspective:
Last week saw price action on the H4 timeframe establish a range between support at 0.7742 (previous swing high) and resistance between 0.7810/0.7791 (a previous double-top and a Quasimodo resistance), which happens to house the 0.78 figure and a 127.2% Fibonacci projection point at 0.7792.
The upper edge of the aforementioned range is effectively reinforced by the daily Quasimodo resistance level pointed out above at 0.7784. Beyond H4 support at 0.7742, the 0.77 figure calls for attention given its connection with a 127.2% Fibonacci projection point and a 100% Fibonacci extension point.
Areas of consideration:
- Despite H4 entering into an early consolidation and daily price showing interest at Quasimodo resistance from 0.7784, overall, the AUD/USD’s technical trend remains firmly north.
- H4 breaking above the current H4 range (0.7810) could have breakout buyers target the 127.2% Fibonacci projection point at 0.7874 this week.
- The 0.77 figure on the H4 is a possible support to be mindful of, blending with clear Fibonacci levels.
USD/JPY
Weekly gain/loss: +0.68%
Weekly close: 103.95
Weekly perspective:
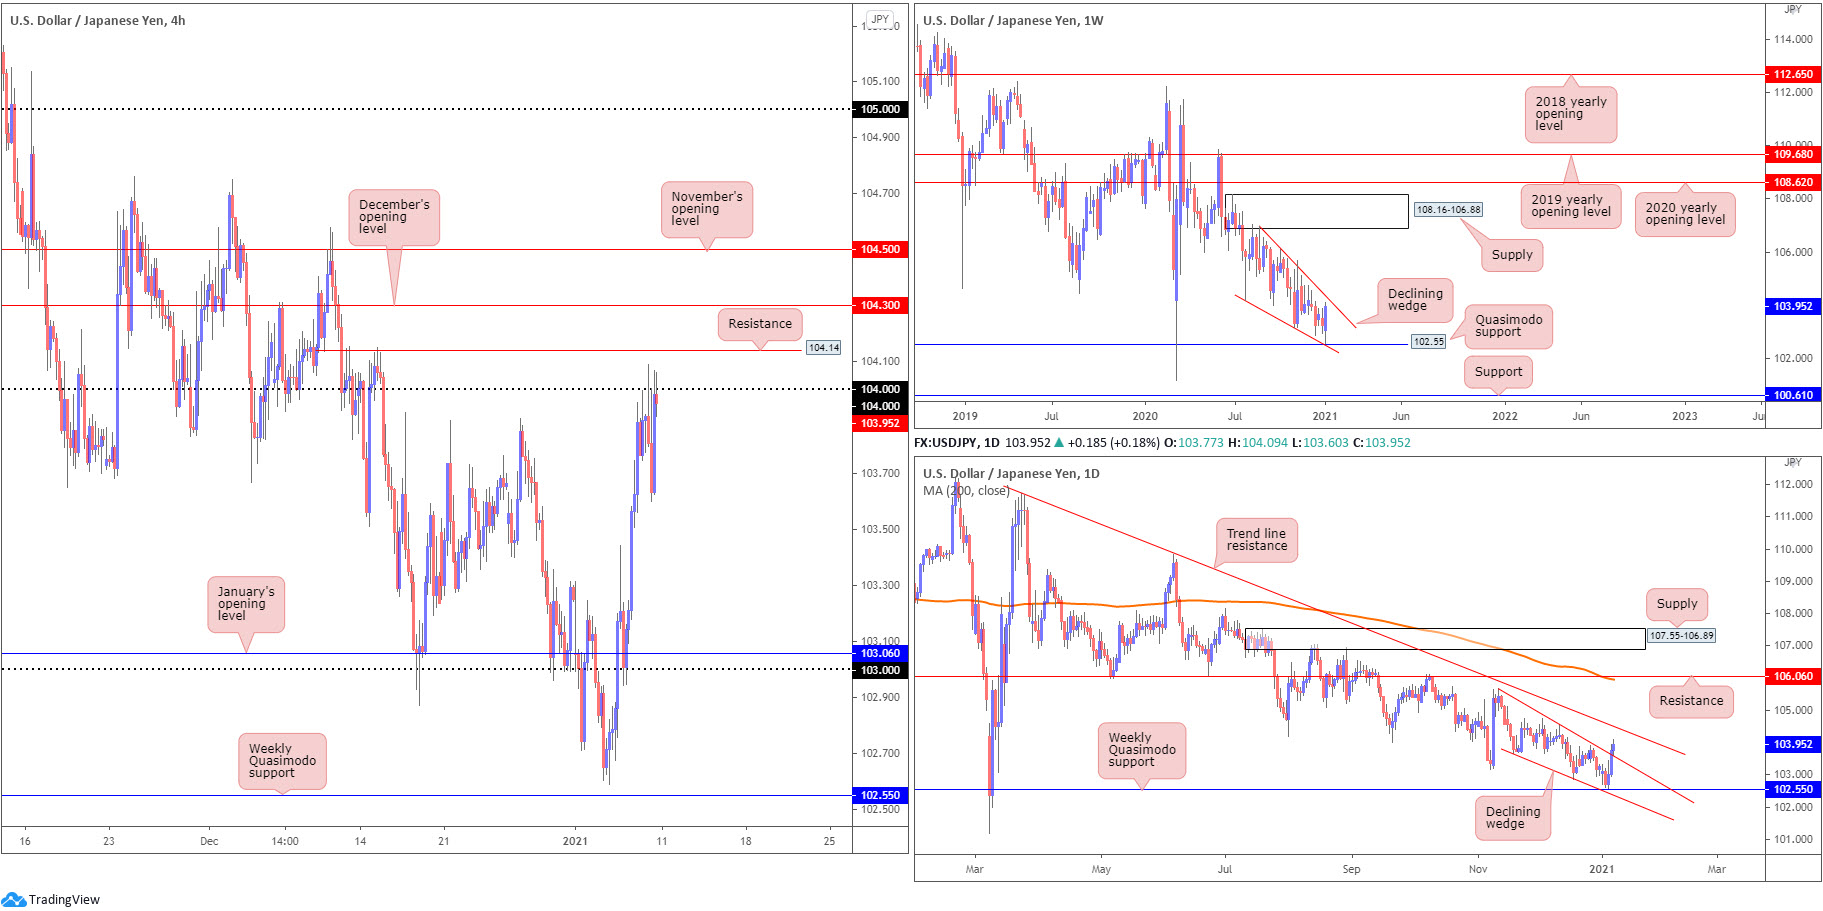
Since connecting with the underside of weekly supply at 108.16-106.88 in August, price has gradually shifted lower and developed a weekly declining wedge (106.94/104.18).
Quasimodo support at 102.55 came within touching distance of entering the picture last week, prompting a robust advance. Further upside may provide enough impetus for buyers to attempt a breakout above the current declining wedge and unlock a reversal signal.
Daily perspective:
The technical landscape on the daily timeframe reveals the rebound north of the noted weekly Quasimodo support at 102.55 sparked a daily close above the declining wedge between 105.67/103.65.
Having seen daily price establish a close above the aforementioned declining wedge, this is likely to be interpreted as a potential reversal signal this week, targeting at least trend line resistance, etched from the high 111.71.
H4 perspective:
USD/JPY initially declined following Friday’s US employment figures (see M30 for clearer chart view), yet downside was short-lived, bottoming around 103.60 and reconnecting with the underside of the 104 figure.
Should buyers attempt to extend Thursday’s risk-fuelled rally this week, overthrowing 104 throws 104.14 into the spotlight as nearby resistance, with a break exposing December and November’s opening values at 104.30 and 104.50, respectively. Interestingly, November’s opening value actually corresponds with the daily trend line resistance highlighted above.
Areas of consideration:
- The break of the daily declining wedge could spark follow-through buying to daily trend line resistance this week, a descending level aligning closely with not only November’s opening value at 104.50 on the H4, but also the upper edge of the weekly declining wedge pattern.
- A H4 move above 104 will likely be viewed as a bullish indicator, though buyers face neighbouring resistance at 104.14, 104.30 and 104.50.
USD/CAD:
Weekly gain/loss: -0.55%
Weekly close: 1.2685
Weekly perspective:
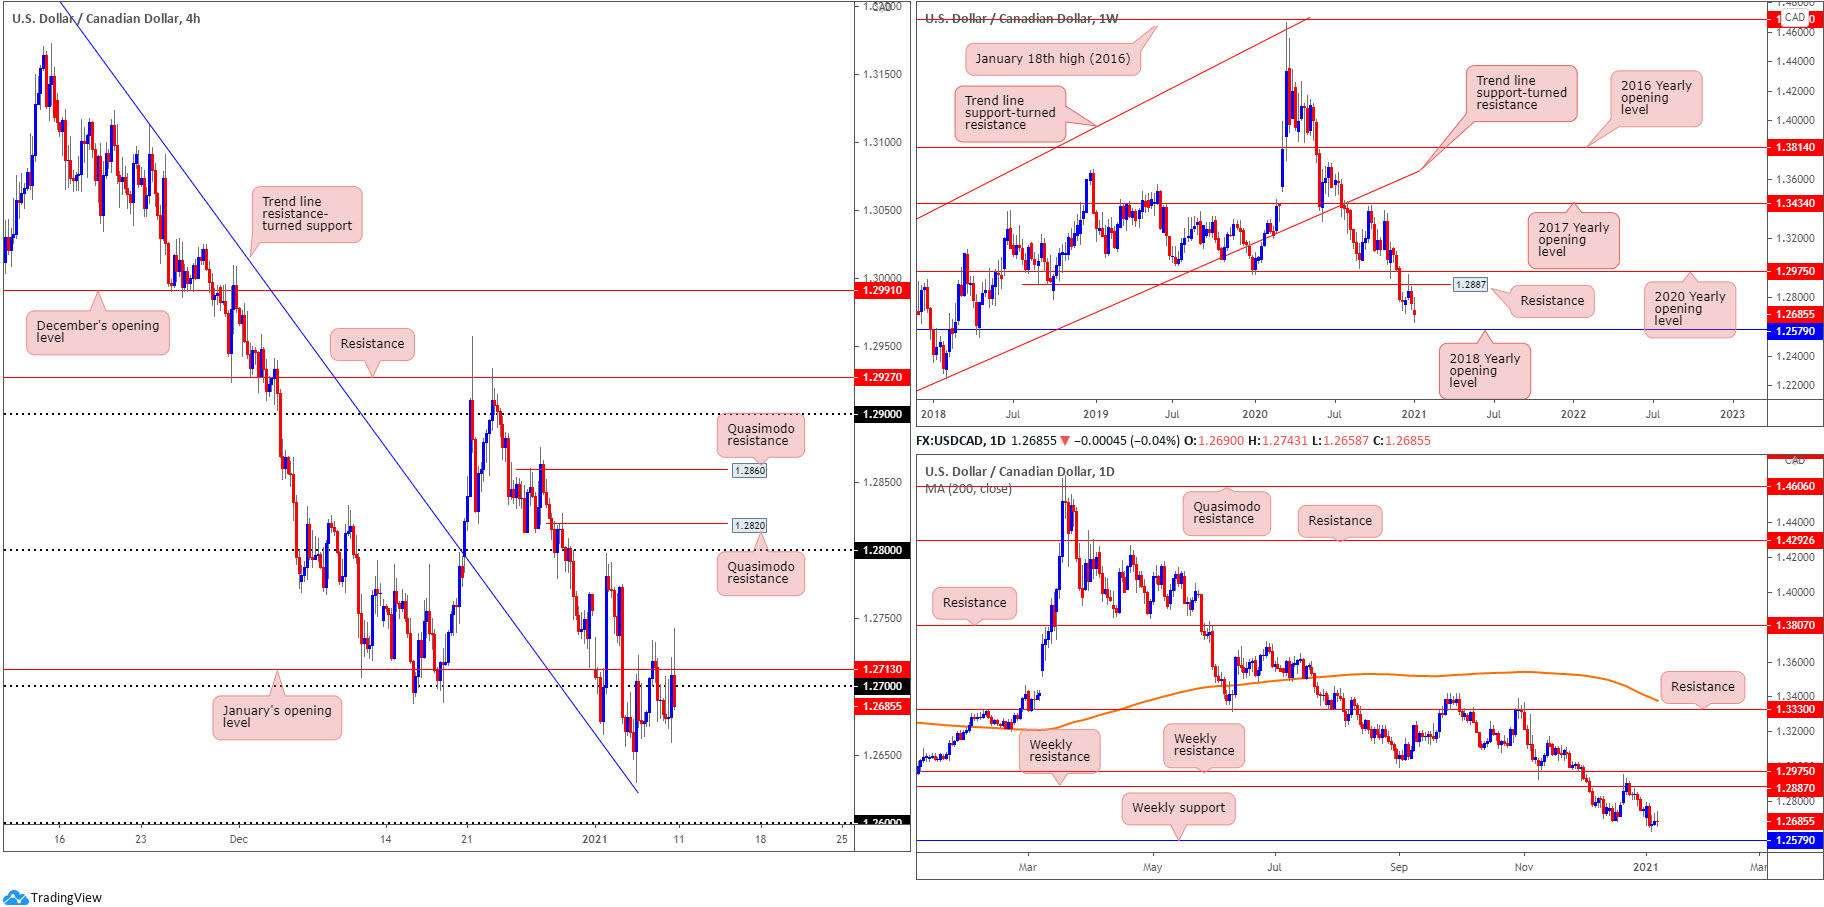
Early December obliterated the 2020 yearly opening value at 1.2975 and Quasimodo support at 1.2887. With 1.2887 serving as resistance heading into the close of 2020, this (although last week formed an indecision candle) seats the 2018 yearly opening value at 1.2579 in the firing line this week
Also important to note is that long-term flow (trend) has been pointing lower since topping in March (2020)
Daily perspective:
Mid-week onwards displayed clear signs of upside rejection.
Aside from the above, technical structure pretty much resembles that of the weekly timeframe: weekly resistance at 1.2887 and weekly support plotted at 1.2579.
H4 perspective:
Dismal labour figures out of Canada and the US kept USD/CAD somewhat side-lined around January’s opening value at 1.2713 and the 1.27 figure on Friday. This followed a half-hearted recovery on Wednesday, a touch north of trend line resistance-turned support, extended from the high 1.3389.
Holding south this week throws multi-year lows back on the scene at 1.2630 and the 1.26 figure (H4), sited just north of the weekly support level mentioned above at 1.2579.
Areas of consideration:
- All three timeframes, according to the technical studies presented above, exhibit bearish posture this week.
- With the above on board, a bearish scenario could form around January’s opening value at 1.2713 and the 1.27 figure this week (H4). Although 1.2630 and the 1.26 figure (H4) offer obvious downside targets, ultimately traders are likely eyeing weekly support around 1.2579.
USD/CHF:
Weekly gain/loss: -0.05% (flat)
Weekly close: 0.8851
Weekly perspective:
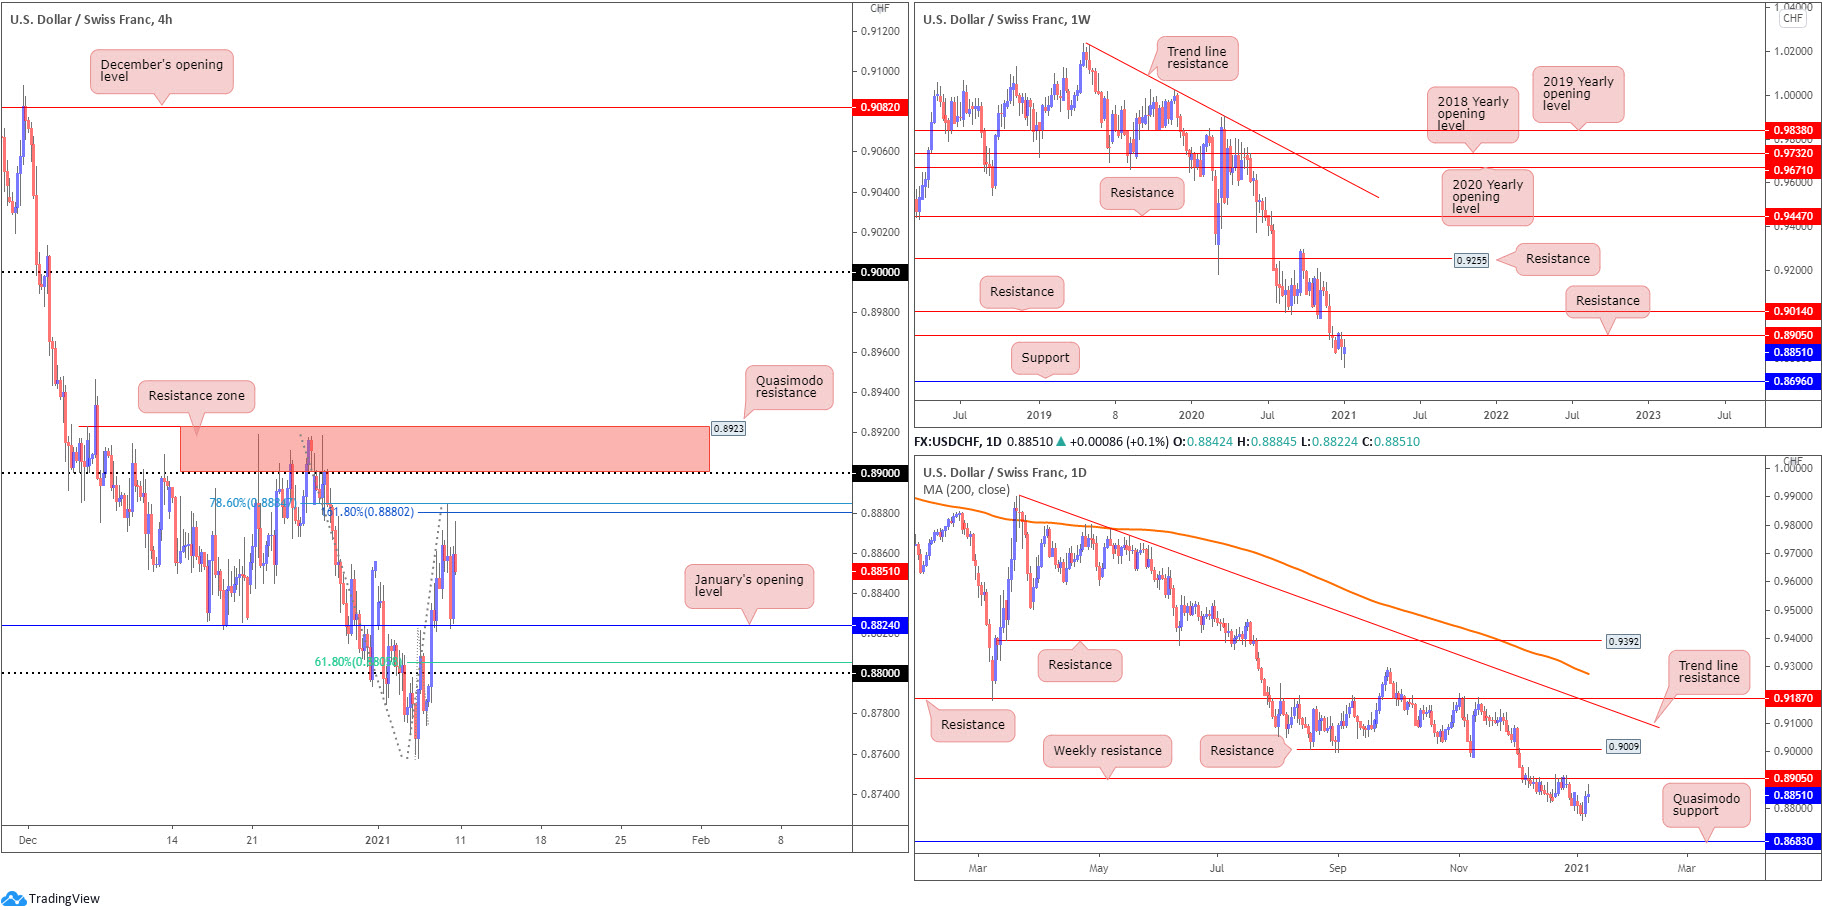
The weekly timeframe shows not only has USD/CHF been entrenched within a downtrend since May 2019, the pair also remains loitering at the underside of resistance drawn from 0.8905. Because of this, sellers are expected to maintain control in the coming weeks.
Support on the weekly timeframe is not expected to make an appearance until 0.8696.
Daily perspective:
Similar to the weekly scale, the daily timeframe reveals weekly resistance at 0.8905 as a prominent base. However, Quasimodo support at 0.8683 serves as the next downside target on the daily timeframe, situated a touch beneath weekly support at 0.8696.
H4 perspective:
Modest selling materialised following Friday’s US non-farm payrolls release, prompting a short-lived retest of January’s opening value at 0.8824.
Upside structure is found around 0.8880, a 78.6% Fibonacci retracement ratio at 0.8884 and a 161.8% Fibonacci extension point at 0.8880, with a break exposing the 0.89 figure and 0.8923 Quasimodo resistance level (red zone). What’s interesting from a technical perspective is weekly resistance at 0.8905 coincides with the aforementioned H4 resistance zone.
Areas of consideration:
- A short-term range may form between Fibonacci resistances at around 0.8880 and January’s opening value from 0.8824 (H4).
- H4 resistance zone at 0.8923/0.89 is an area to be conscious of this week, having noted weekly resistance converging with the base at 0.8905.
- The 0.88 figure – reinforced by a 61.8% Fibonacci retracement ratio at 0.8805.
Dow Jones Industrial Average:
Weekly gain/loss: +1.71%
Weekly close: 31,145
Weekly perspective:
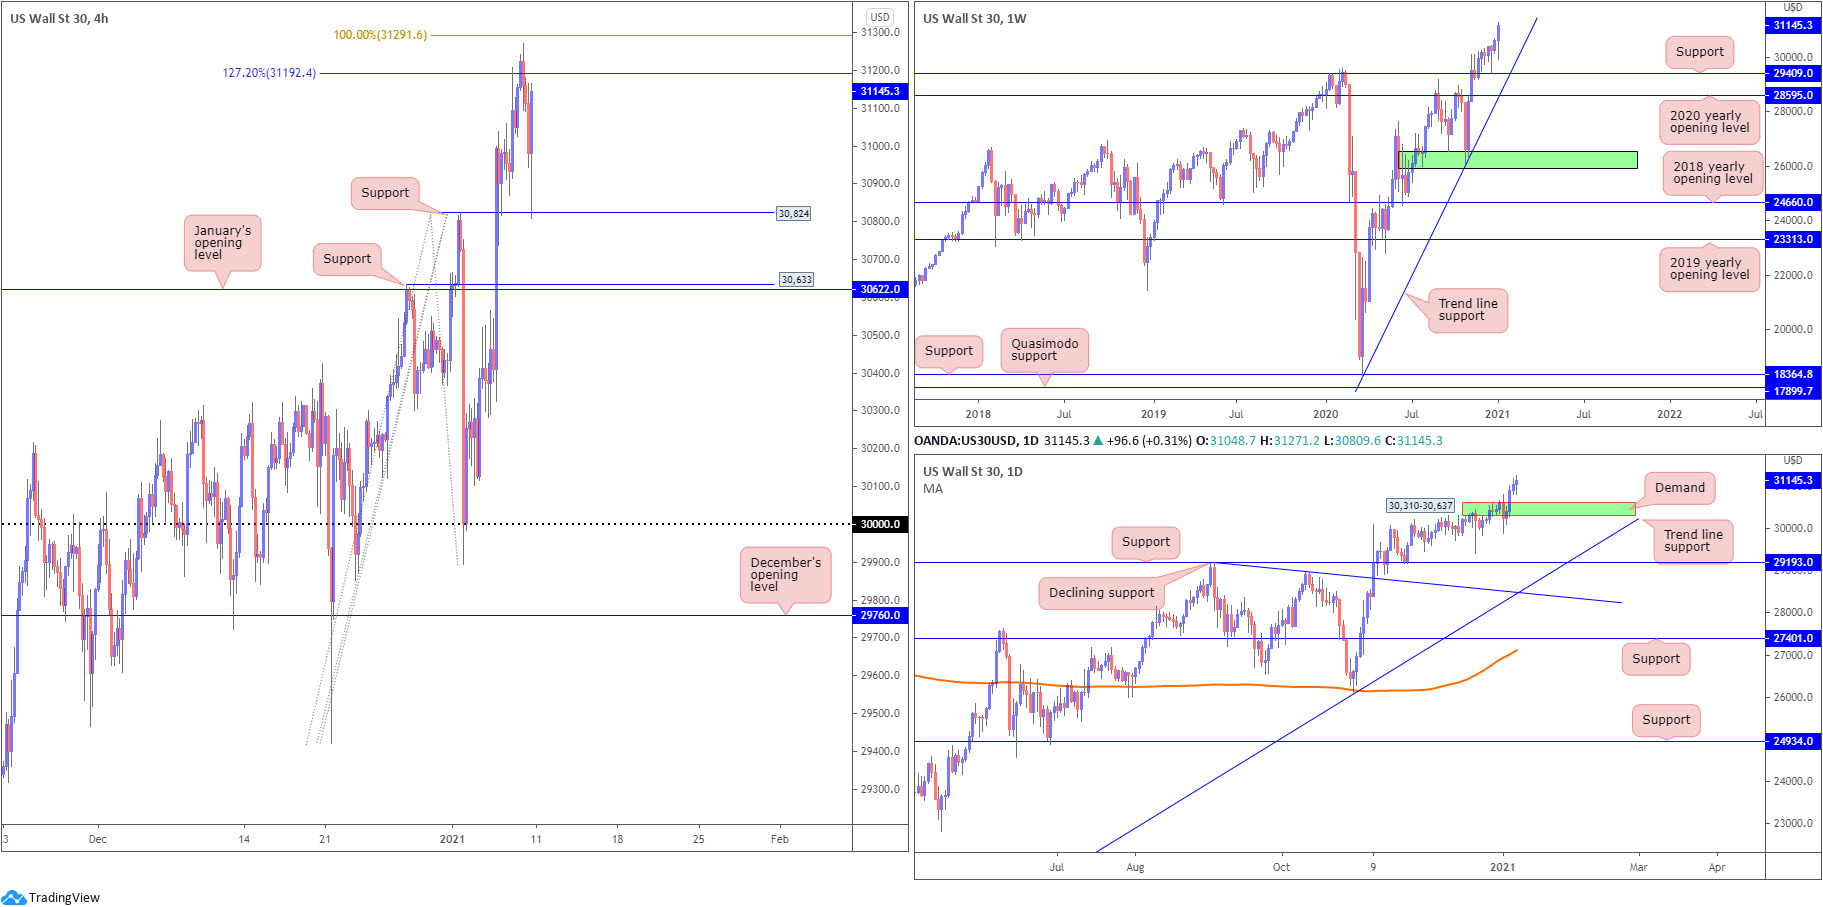
The first full trading week of 2021 kicked off registering fresh all-time highs at 31,271 on the Dow Jones Industrial Average.
Although the unit concluded the week around session peaks (generally a sign of strength), a correction this week has limited support in sight until around 29,409 (previous Quasimodo resistance), together with trend line support, extended from the low 18,213.
Daily perspective:
Wednesday’s upside move exhibited strength – the candle’s real body closed nearby session highs and formed a healthy range. Subsequent candles, however, demonstrated decreased momentum.
This implies a correction may be on the horizon, threatening a test of demand at 30,310-30,637.
H4 perspective:
The Dow Jones Industrial Average added 56.84 points, or 0.18%; the S&P 500 advanced 20.89 points, or 0.55% and the Nasdaq advanced 134.50 points, or 1.03%.
Despite clocking fresh all-time highs, the DJIA ran into a 127.2% Fibonacci projection point at 31,192, sited just south of a 100% Fibonacci extension level at 31,291. This guided H4 action back to support at 30,824 (swing high). Below here, support resides at 30,633, a previous Quasimodo resistance level that blends with January’s opening value at 30,622.
Areas of consideration:
- Although H4 support at 30,824 stepped forward Friday, price could retreat as far south as H4 support at 30,633 this week, a level plotted within the upper range of daily demand at 30,310-30,637. Therefore, this is likely an area dip-buyers may find interest in.
- A H4 breakout above 31,291, on the other hand, potentially fuels a bullish breakout theme to refresh all-time peaks.
XAU/USD (GOLD):
Weekly gain/loss: -2.59%
Weekly close: $1,849
Weekly perspective:
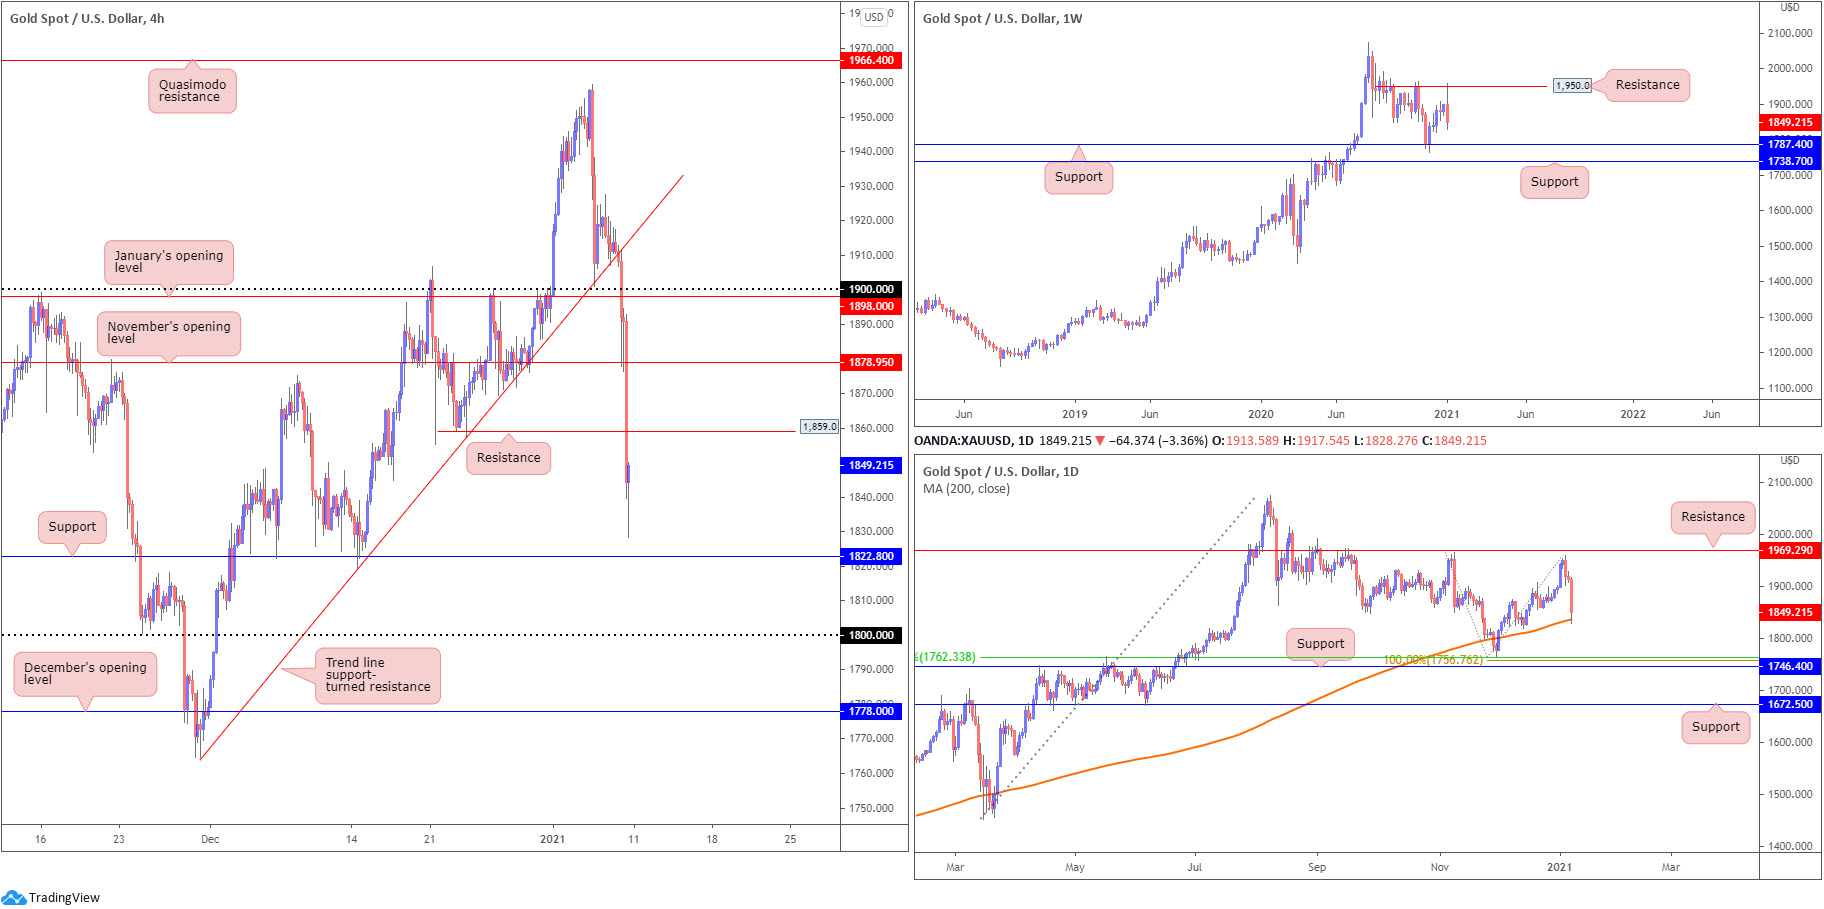
Shedding nearly $50, XAU/USD witnessed strong sellers step forward last week, establishing a clear-cut outside range off resistance at $1,950.
Should sellers strengthen their grip this week, support at $1,787 could play a leading role, a level plotted just north of another layer of support at $1,738.
While the recent sell-off may have triggered short-term interest to the downside, it is worth noting that in terms of trend we’ve been higher since early 2016.
Daily perspective:
Friday concluded down by more than 3% against a broadly stronger US dollar, hauling gold back to its 200-day SMA (orange – $1,836). SMAs are known to provide dynamic support and resistance, particularly the 200-day setting, therefore buyers may attempt to recoup lost ground this week.
In the event buyers fail to hold things higher, support at $1,746 could act as a magnet to price, a level sponsored by nearby Fibonacci support around $1,760ish.
H4 perspective:
Friday’s depreciation conquered a number of key support levels on the H4 scale (including $1,900), ending the week modestly bottoming ahead of support coming in at $1,822, forming a hammer pattern (bullish signal often found around troughs).
Should buyers regain consciousness this week, resistance is posted around the $1,859 region, a previous Quasimodo support level, and November’s opening value priced at $1,878.
Areas of consideration:
- Weekly resistance at $1,950 suggests sellers want to keep things lower, potentially at least until weekly support enters the fight at $1,787. The concern for sellers, however, may be Friday’s test of the 200-day SMA and, of course, the prevailing uptrend.
- Short-term resistance on the watchlist this week are likely the $1,859 region on the H4 and November’s opening value at $1,878.
- Short-term support levels to be aware of on the H4 scale this week are $1,822 and the round number $1,800. December’s opening value at $1,778 is also interesting as it forms a connection with weekly support at $1,787.
The accuracy, completeness and timeliness of the information contained on this site cannot be guaranteed. IC Markets does not warranty, guarantee or make any representations, or assume any liability regarding financial results based on the use of the information in the site.
News, views, opinions, recommendations and other information obtained from sources outside of www.icmarkets.com.au, used in this site are believed to be reliable, but we cannot guarantee their accuracy or completeness. All such information is subject to change at any time without notice. IC Markets assumes no responsibility for the content of any linked site.
The fact that such links may exist does not indicate approval or endorsement of any material contained on any linked site. IC Markets is not liable for any harm caused by the transmission, through accessing the services or information on this site, of a computer virus, or other computer code or programming device that might be used to access, delete, damage, disable, disrupt or otherwise impede in any manner, the operation of the site or of any user’s software, hardware, data or property.


