
A note on lower timeframe confirming price action…
Waiting for lower timeframe confirmation is our main tool to confirm strength within higher timeframe zones, and has really been the key to our trading success. It takes a little time to understand the subtle nuances, however, as each trade is never the same, but once you master the rhythm so to speak, you will be saved from countless unnecessary losing trades. The following is a list of what we look for:
- A break/retest of supply or demand dependent on which way you’re trading.
- A trendline break/retest.
- Buying/selling tails/wicks – essentially we look for a cluster of very obvious spikes off of lower timeframe support and resistance levels within the higher timeframe zone.
- Candlestick patterns. We tend to only stick with pin bars and engulfing bars as these have proven to be the most effective.
We search for lower timeframe confirmation between the M15 and H1 timeframes, since most of our higher-timeframe areas begin with the H4. Stops are usually placed 5-10 pips beyond confirming structures.
EUR/USD:
Weekly gain/loss: – 37 pips
Weekly closing price: 1.1196
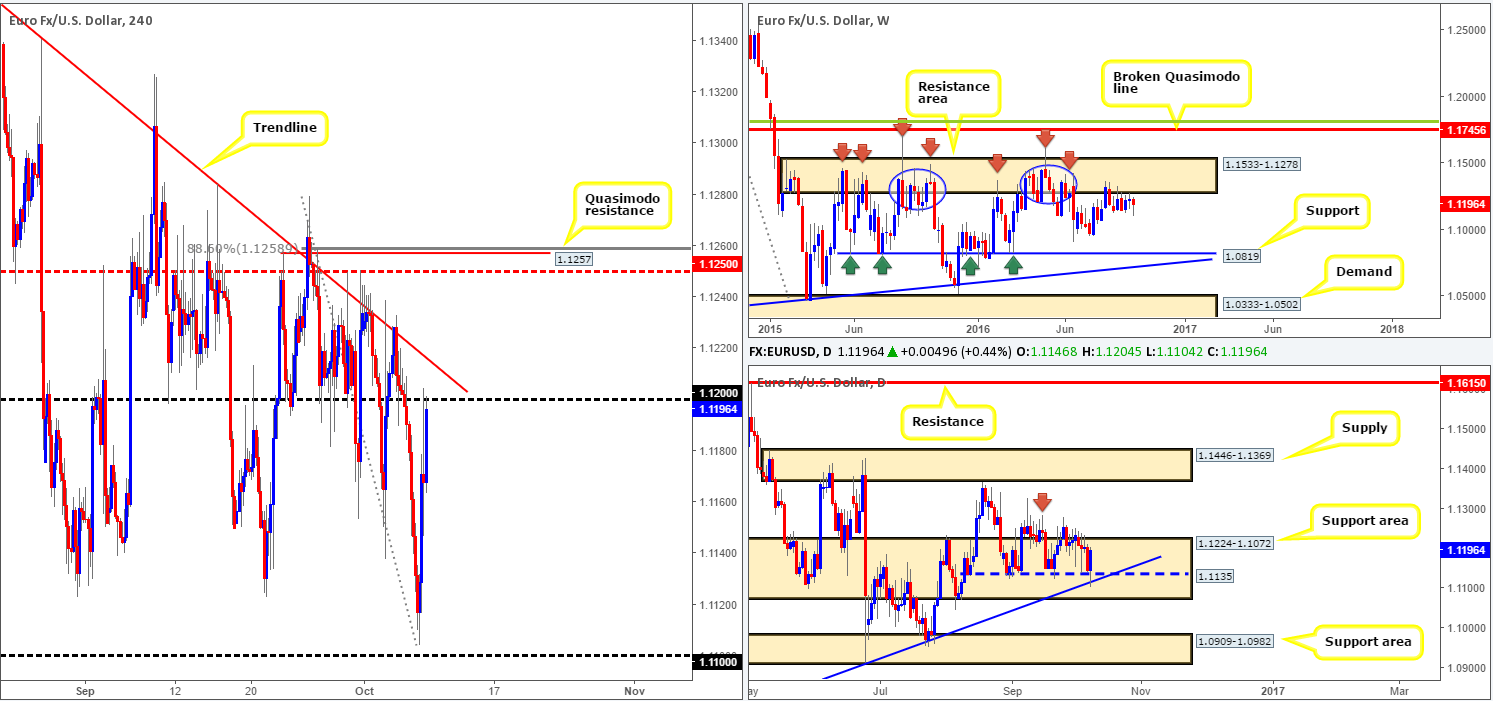
Weekly view: As you can see, the weekly candles remain hugging the underside of a major resistance area seen at 1.1533-1.1278. While we’re confident that this zone will eventually force the pair lower, it’s difficult to judge when that will be as in the past we’ve seen price consolidate for long periods before plunging south (see blue circles). The next downside targets to have an eyeball on from this neighborhood can be seen at the 1.0970 region, followed closely by a major support seen at 1.0819.
Daily view: From this angle, the major, once again, caught a bid from support coming in at 1.1135, which happens to merge with a trendline support taken from the low 1.0516. Although this line has held firm since mid-Aug and is housed within a support area seen at 1.1224-1.1072 that stretches back as far as Jan 2015, trading long from here is challenging given the weekly picture. Nevertheless, a decisive break above the September 15th high at 1.1284 (red arrow) could spark a round of buying up to the supply base coming in at 1.1446-1.1369.
H4 view: Friday’s US non-farm employment change came in lower than expected at 156k, which, as can be seen from the chart, drove the common currency skyward as a result. Offers around the 1.12 handle were triggered an hour or so after the event which managed to hold the market lower into the week’s close.
Direction for the week: Similar to our last weekly report, we feel that this market will eventually decline in value. However, given the conflicting signals seen on the higher timeframes at the moment, it may be a while before we see this come to fruition.
Direction for today: By and large, our team has come to a general consensus that 1.12 may be taken out today, which in turn, will likely see the H4 candles attack the trendline resistance extended from the high1.1366. A break above this hurdle, nonetheless, would likely stimulate an advance up to the H4 mid-way resistance 1.1250, more specifically, a H4 Quasimodo resistance at 1.1257.
Our suggestions: From our point of view, shorting the above said H4 Quasimodo formation is high probability. Not only does this level converge with a deep H4 88.6% Fib at 1.1258, it also, as mentioned above, connects nicely with the H4 mid-way resistance line. In addition, we can see that the head of this H4 Quasimodo formation (1.1279) is bolstered by the underside of the above said weekly resistance area, thus, giving this H4 setup a little more influence.
On the data front, however, we have a relatively light docket ahead of us, along with US banks being closed in observance of Columbus Day. Therefore, the H4 Quasimodo resistance may have to wait until Tuesday!
Levels to watch/live orders:
- Buys: Flat (Stop loss: N/A).
- Sells: 1.1257 ([dependent on the time of day, we would consider entering here at market] Stop loss: 1.1285).
GBP/USD:
Weekly gain/loss: – 542 pips
Weekly closing price: 1.2429
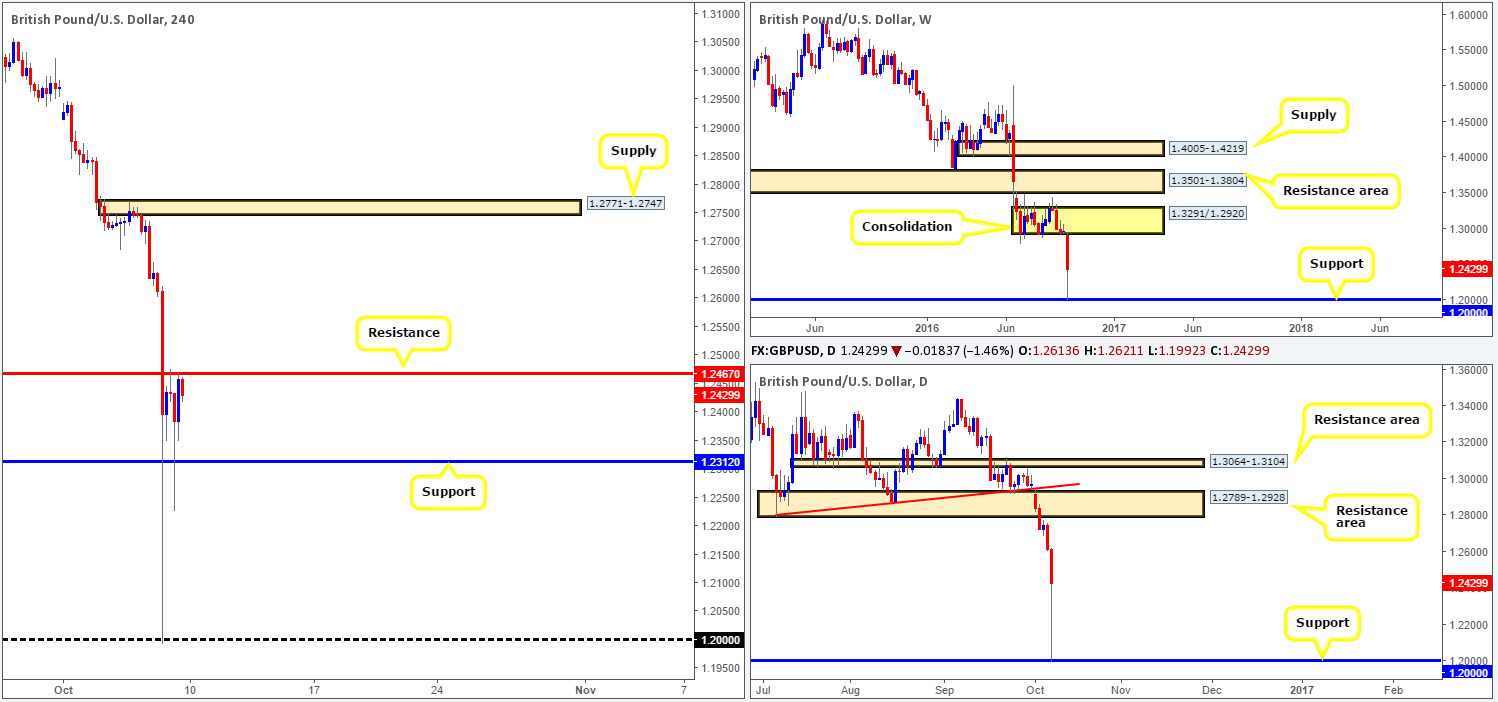
Weekly view: It’s amazing what a new week of trade can bring! This time last week cable was hovering around the 1.29 mark. Today, however, thanks to Thursday’s ‘flash crash’, the pair currently trades at 1.2429, following a rather sharp recovery from the 1.20 region. Reports suggest this selloff was caused by comments made by the French president Francois Hollande regarding the ‘Brexit’ situation, and increased algorithmic trading.1.20 is an interesting barrier since not only is it considered a key psychological landmark, it is also housed within a large demand seen on the monthly chart back in 1987 (see: http://fxtop.com/en/historical-exchange-rates-graph-zoom.php?C1=GBP&C2=USD&A=1&DD1=07&MM1=10&YYYY1=1960&DD2=14&MM2=10&YYYY2=2016&LARGE=1&LANG=en&VAR=0&MM1M=0&MM3M=0&MM1Y=0 ).
Daily view: Other than the fact that the pound stabbed into a monthly demand base, there is not really much to hang our hat on at the moment regarding the daily timeframe. To the upside, the next barrier of interest comes in at 1.2789-1.2928: a resistance area, while to the downside, 1.20 is the next available support.
H4 view: Following Thursday’s monumental selloff, the H4 candles appear to be in the process of chiseling out a consolidation zone fixed between resistance penciled in at 1.2467 and support drawn from 1.2312 (seen much clearer on the M30 timeframe). This is likely the work of Friday’s disappointing UK manufacturing data, along with a poor US NFP reading seen a few hours later.
Direction for the week: While the pair is clearly entrenched in a downtrend at present, direction, as far as structure is concerned, is limited. The best we feel we can do here is keep an eye on 1.20 and the aforementioned daily resistance area.
Direction for today: With US banks closed today and little UK data on the docket, we fail to see price breaching the current H4 resistance band at 1.2467.
Our suggestions: One could consider hunting for lower timeframe sell entries (see the top of this report for ideas on lower timeframe confirmation) around the above said H4 resistance today, targeting the lower edge of the H4 range: 1.2312. Aside from this, we unfortunately see little else that tickles our fancy.
Levels to watch/live orders:
- Buys: Flat (Stop loss: N/A).
- Sells: 1.2467 region ([lower timeframe confirmation preferred] Stop loss: dependent on where one confirms this area).
AUD/USD:
Weekly gain/loss: – 71 pips
Weekly closing price: 0.7584
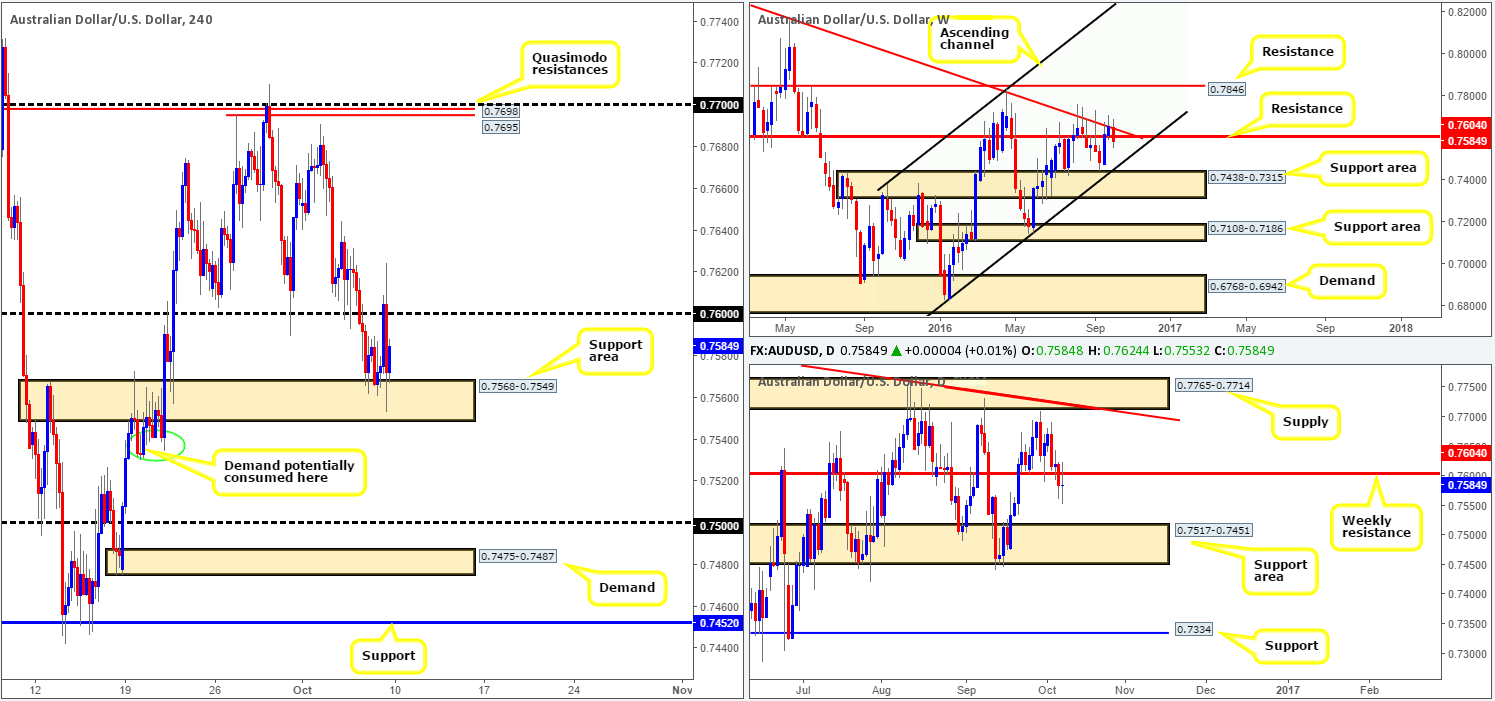
Weekly view: During the course of last week’s sessions, the commodity currency came under pressure after locking horns with the trendline resistance extended from the high 0.8295. In addition to this, we also saw price close below support registered at 0.7604 (now acting resistance). From a technical standpoint, this likely places the channel support line taken from the low 0.6827 in the spotlight this week.
Daily view: Thursday’s close below weekly support has potentially opened up the path south for prices to challenge the support area coming in at 0.7517-0.7451, which has been active since late Mar 2016. Granted, Friday’s retest to the underside of the weekly barrier is a little concerning given that it represents indecision. Nevertheless, pressure from weekly sellers will likely help push things along here.
H4 view: The aftermath of Friday’s US job’s report saw the Aussie break through the 0.76 handle and clock highs of 0.7624. Be that as it may, the rally was a relatively short-lived one as price hit the brakes and reversed from here, pushing back below 0.76 and regrouping around the support area at 0.7568-0.7549 to end the week. As we highlighted in Friday’s report, this support area is significant in that it was used to propel the currency beyond the weekly resistance 0.7604 back on the 21st September. So we’re not surprised by the bounce seen from here.
Direction for the week: According to the higher-timeframe structures, further downside seems feasible to the aforementioned daily support area. After that, direction is difficult to judge, in our opinion, since this daily area intersects with the above said weekly channel support line.
Direction for today: Until the current H4 support area is taken out, we do not see this market selling off. A close below this barrier would likely open the trapdoor down to the 0.75 handle, which, as you can probably see, is housed within the daily support area discussed above.
Our suggestions: For our team to become sellers in this market, we require a H4 close beyond the current H4 support area, followed up by a retest and a H4 bearish candle. For all that though, this may not come into view today due a light news docket and US banks being closed in observance of Columbus Day.
Levels to watch/live orders:
- Buys: Flat (Stop loss: N/A).
- Sells: Watch for a close below the H4 support area at 0.7568-0.7549 and then look to trade any retest seen thereafter (H4 bearish candle is required before pulling the trigger).
USD/JPY:
Weekly gain/loss: + 162 pips
Weekly closing price: 102.89
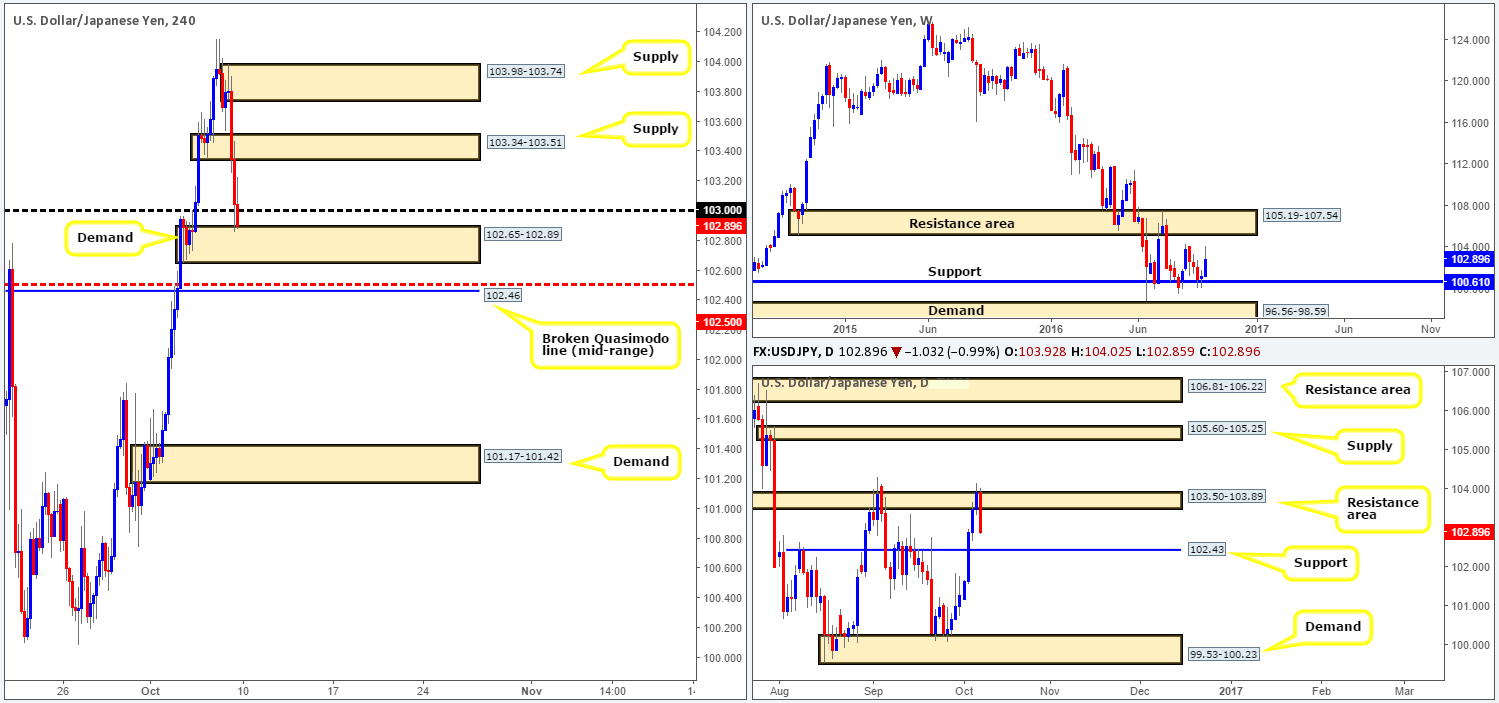
Weekly view: USD/JPY bulls went on the offensive last week, extending the prior week’s bounce off support drawn from 100.61. Be that as it may, it was not all sunshine and roses for the pair. Towards the end of the week, price struck weekly highs chalked up on the 29/08 around the 104.32ish range, consequently forcing the candles to pullback into the close. Should the bulls continue with last week’s intensity, nonetheless, we may see a break of these highs and a push up to the resistance area at 105.19-107.54.
Daily view: The story on the daily chart shows that price sold off from a resistance zone coming in at 103.50-103.89, following a week’s worth of buying. To our way of seeing things, there’s a good chance that this area will continue to hold this market lower here this week, with it having been a considerably strong support/resistance zone on a number of occasions right back to the year 2008! The next downside target to keep an eyeball on is the support fixed at 102.43, followed by demand coming in at 99.53-100.23.
H4 view: The impact of Friday’s non-farm payrolls data aggressively sent prices lower, taking out both demand at 103.34-103.51 (now acting supply) and the 103 handle, leaving price free to tag a nearby H4 demand at 102.65-102.89 at the close. Should we see price rotate from this area today and close back above 103, this could signal that the buyers are ready to retest the underside of supply at 103.34-103.51. Conversely, a close below this area would almost immediately land the pair within touching distance of the mid-way support 102.50/broken (mid-range) Quasimodo line at 102.46.
Direction for the week: As far as higher-timeframe structure is concerned, price could effectively trade either way this week. A continuation move north may come into view on the weekly timeframe surpassing the above mentioned highs and tagging the resistance area at 105.19-107.54. On the other side of the field, however, a move lower from the current daily resistance area is, as we explained above, certainly not out of the question.
Direction for today: From current prices, there is not really much to look at as far as direction is concerned (see above in bold). However, a close below the aforementioned H4 broken Quasimodo line (mid-range) could portend a selloff down to H4 demand coming in at 101.17-101.42, since the Quasimodo line also represents daily support discussed above at 102.43. However, we’re not expecting much action today given that both the US and Japanese banks are closed.
Our suggestions: Given the above points, the best course of action seems to be to wait for a close beyond the aforementioned H4 broken Quasimodo (mid-range) line. Should this come to fruition and price retests the underside of this neighborhood along with a H4 bearish candle, we would look to short from here, targeting the above noted H4 demand at 101.17-101.42.
Levels to watch/live orders:
- Buys: Flat (Stop loss: N/A).
- Sells: Watch for price to close below the H4 broken Quasimodo (mid-range) line at 102.46 and then look to trade any retest seen thereafter (H4 bearish candle is required before pulling the trigger).
USD/CAD:
Weekly gain/loss: + 171 pips
Weekly closing price: 1.3293
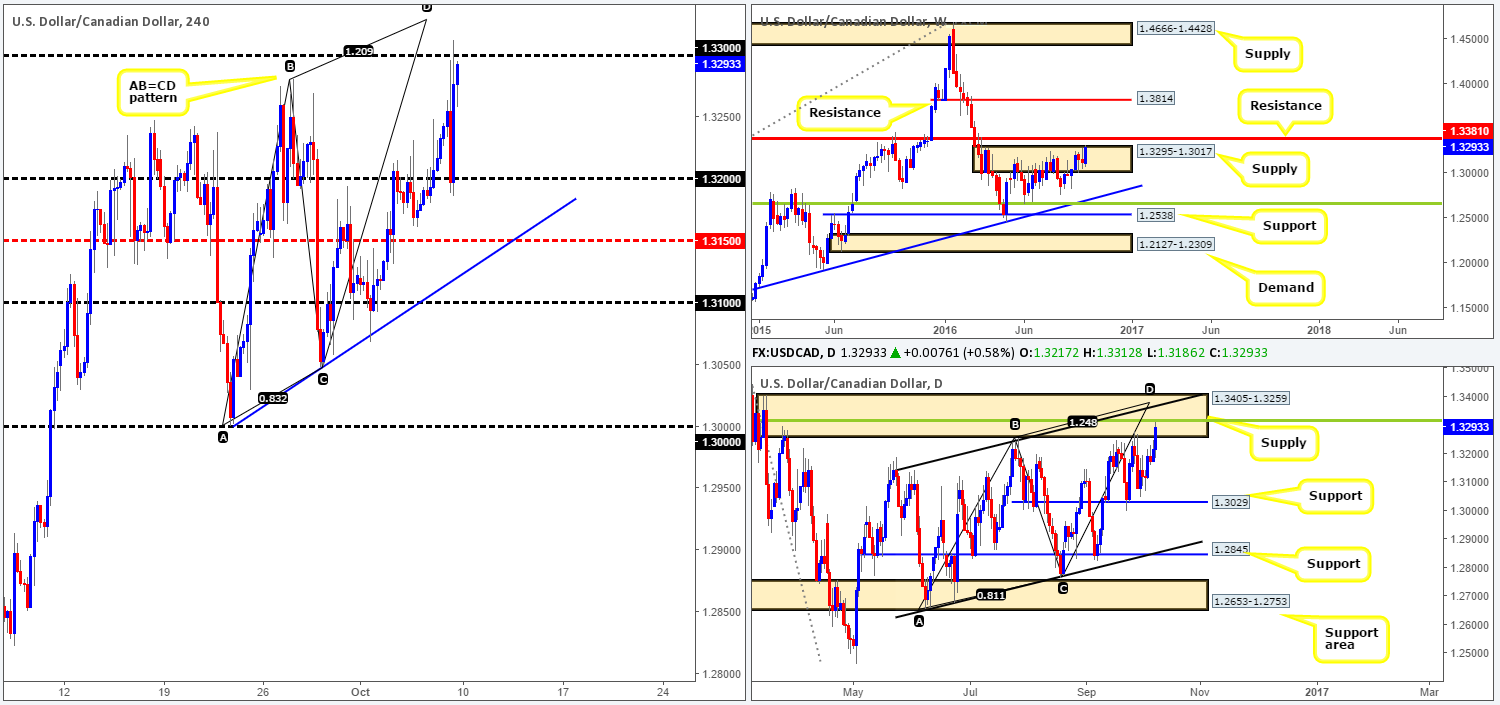
Weekly view: After seeing price action loiter within supply at 1.3295-1.3017 for the past two weeks, the zone suffered a slight break last week. As such, a continuation move up toward the resistance boundary seen at 1.3381 is now something traders need to be prepared for this week.
Daily view: Looking down to the daily chart, the unit is also seen trading within a supply zone drawn from 1.3405-1.3259. On top of this, the loonie is now lurking within shouting distance of a daily convergence point made up of: a 38.2% Fib resistance level at 1.3315 (green line), the weekly resistance level mentioned above at 1.3381, a channel resistance taken from the high 1.3241 and an AB=CD completion point around the 1.3376ish range.
H4 view: A quick recap of Friday’s trading on the H4 chart shows that the USD/CAD sold off following a better than expected Canadian job’s report. However, it was not too long after this did we see price catch a bid from the 1.32 handle and push on up to the 1.33 neighborhood into the close.
Direction for the week: With weekly action trading around supply and resistance, as well as daily price trading within a heavily confluent supply zone, we feel the more likely direction this week is south.
Direction for today: Due to the fact that US and Canadian banks are closed today, liquidity may be thin. Therefore, we will not be expecting much from this market today.
Our suggestions: Despite both countries being on vacation today, we are very interested in shorting from around 1.3315ish region. Not only does this area boast a truckload of daily/weekly confluence (see above) and a H4 AB=CD bearish completion point (1.3328), it also allows one to place their stops above the current daily supply! As a result, our team has a pending sell order set at 1.3315 and a stop placed above at 1.3407.
Levels to watch/live orders
- Buys: Flat (Stop loss: N/A).
- Sells: 1.3315 ([pending order] Stop loss: 1.3407).
USD/CHF:
Weekly gain/loss: + 56 pips
Weekly closing price: 0.9769
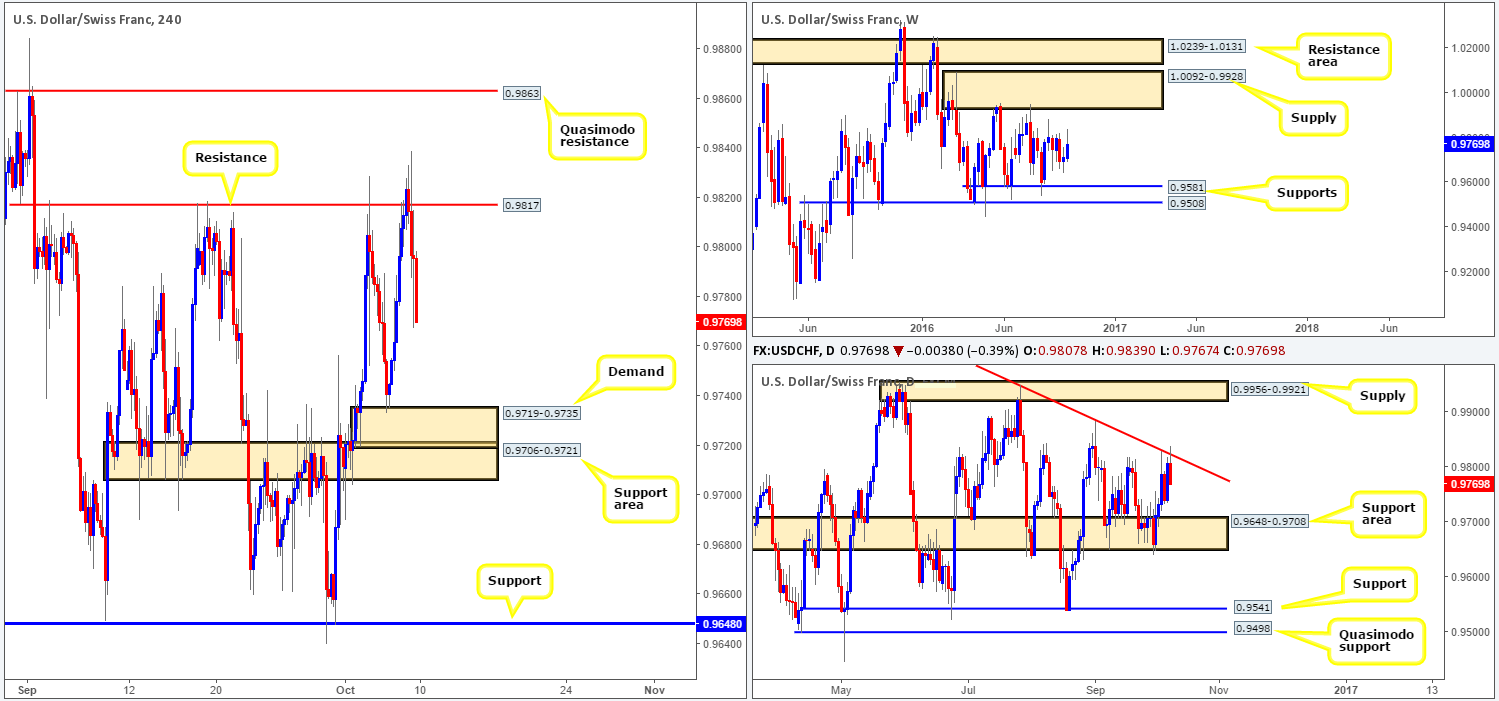
Weekly view: By and large, the weekly timeframe’s structure has remained pretty much in the same position since the beginning of May. The pair has been consolidating between a supply zone painted at 1.0092-0.9928 and a support band drawn from 0.9581. It’s unlikely that price will breach the walls of this range this week, so the best we can do is continue to keep a tab on the edges of this consolidation.
Daily view: Despite weekly price showing little direction right now, the daily candles recently sold off beautifully from a trendline resistance extended from the high 1.0256. The next port of call from this boundary comes in at 0.9648-0.9708: a well-rounded support area that stretches back to early Feb 2016.
H4 view: Following a rather aggressive push above resistance coming in at 0.9817, the after-effects of Friday’s US jobs report saw the Swissy tumble lower. This – coupled with the daily picture, will likely encourage further selling in this market down to at least the demand base penciled in at 0.9719-0.9735 (bolstered by a support area at 0.9706-0.9721).
Direction for the week: We see very little stopping the sellers from pushing prices lower this week until at least the daily support area mentioned above at 0.9648-0.9708. Once/if we reach here, a decision will need to be made as a push lower could portend further downside to daily support at 0.9541, seen 40 pips below the aforementioned weekly support.
Direction for today: With the US session likely to be a relatively dry one today due to US banks closed in observance of Columbus Day, the most we expect from this market, which is a notoriously slow mover anyway, is the H4 demand at 0.9719-0.9735.
Our suggestions: Given that both the above said H4 demand and support areas are positioned in close proximity to the above noted daily support area, this could be somewhere traders may look to bid prices higher from this week. With that in mind, our team will look to buy from here assuming that we’re able to spot a reasonably sized H4 bull candle. This, in our opinion, signals that the buyers have arrived and they may be ready to take things higher.
Levels to watch/live orders:
- Buys: Will be watching for a reasonably sized H4 bull candle to take shape between the lower edge of the H4 support area at 0.9706 and the upper edge of a H4 demand at 0.9735 (Stop loss: beyond the trigger candle).
- Sells: Flat (Stop loss: N/A).
DOW 30:
Weekly gain/loss: – 54 points
Weekly closing price: 18240
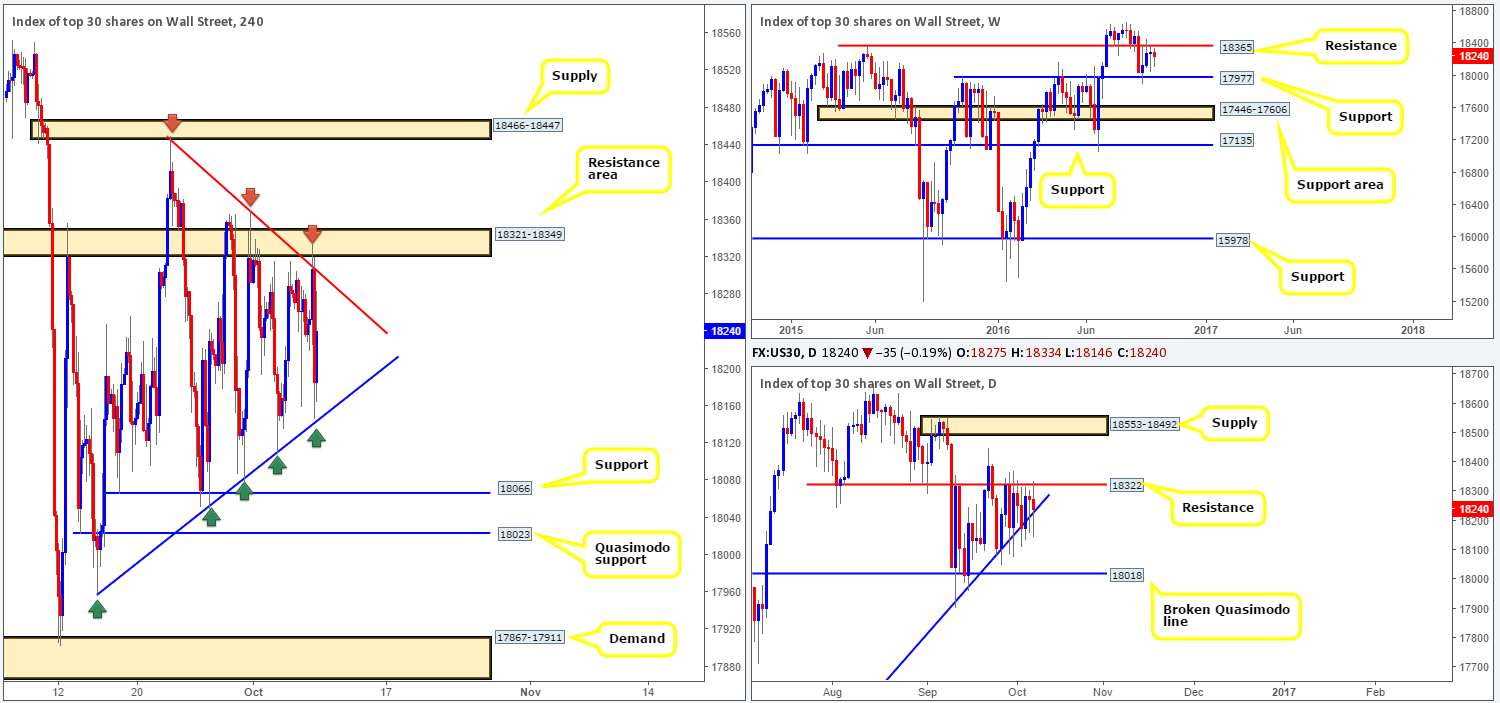
Weekly view: Despite the DOW shaking hands with a resistance level seen at 18365 three weeks back, the sellers, as of yet, have been unable to push prices lower. If/when the sell-side of this market regains consciousness, we might see the unit grind down to support coming in at 17977. A push above this current resistance level on the other hand, could signal that the bulls are ready to strike fresh highs and continue trading northbound.
Daily view: Since the 27th September, the daily candles have been seen compressing between a resistance at 18322 and a trendline support taken from the low 15501. Looking solely at this chart, we feel the sticks are at near boiling point and ready to explode! To the upside, the next area to have jotted down can be seen at 18553-18492: a supply area, whereas, a break lower has the broken Quasimodo line at 18018 to target.
H4 view: Although the market-moving US employment report hit the wire on Friday, it was not enough to free the candles from between the two converging trendlines (17959/18450). In spite of the responses seen from these lines, we would still not feel comfortable risking capital trading either line right now.
Direction for the week: In that weekly price is kissing the underside of resistance, a selloff is the more likely route this week down to the aforementioned weekly support.
Direction for today: As US bank traders are enjoying a long weekend; it’s unlikely we’ll see much action today. In fact, we’d be surprised to see the H4 candles breach the merging trendlines.
Our suggestions: The only area that we have noted in our watchlist at the moment is the H4 Quasimodo support level at 18023 for buys. The line sits just above a daily broken Quasimodo hurdle at 18018 and is also positioned nearby the current weekly support level. In light of how fresh the H4 Quasimodo is and its connection with the higher-timeframe supports, we will, dependent on the time of day and H4 approach, look to enter at market from this perimeter, with stops placed below the apex of this formation at 17953.
Levels to watch/live orders:
- Buys: 18024 ([market order] Stop loss: 17953).
- Sells: Flat (Stop loss: N/A).
GOLD:
Weekly gain/loss: – $60
Weekly closing price: 1255.3
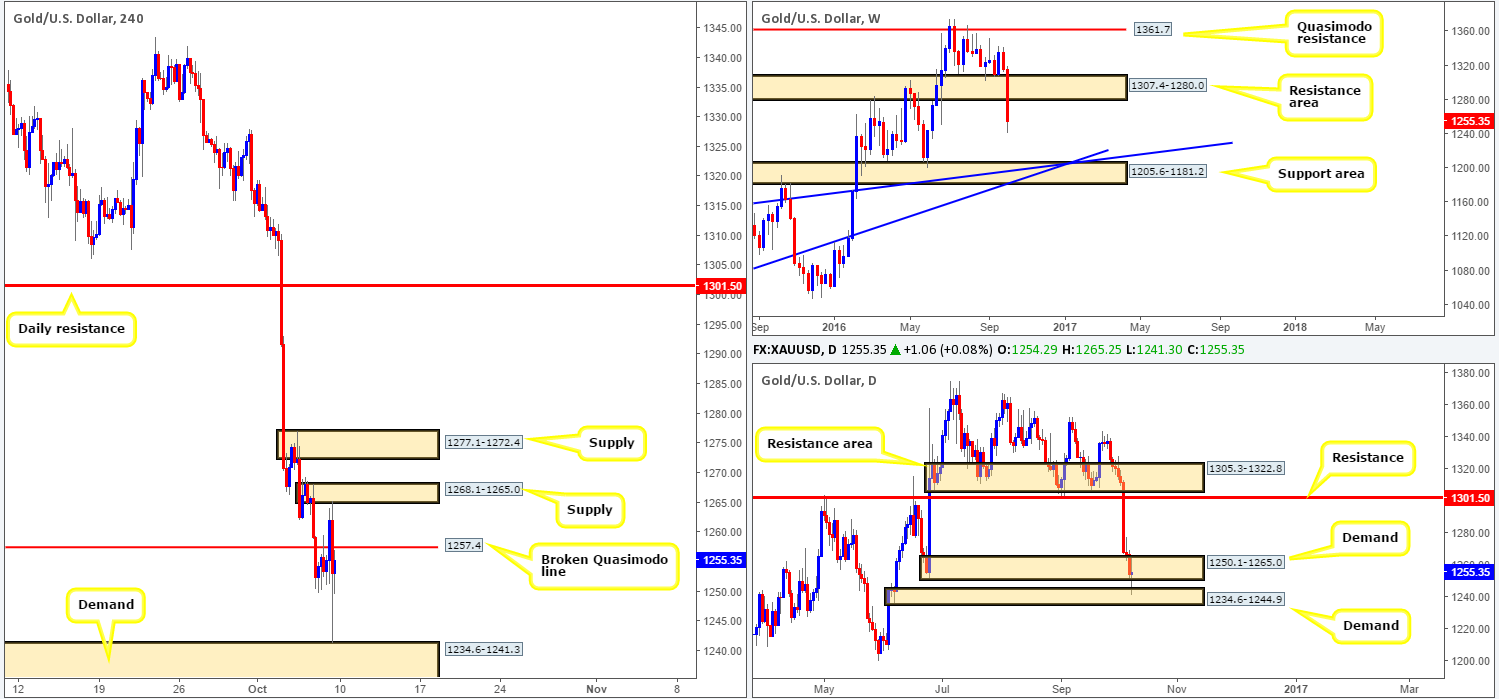
Weekly view: The gold market dropped sharply last week, resulting in price taking out the support area at 1307.4-1280.0 (now acting resistance). Given the velocity of the move, this could set the stage for a continuation move south this week down to the support area logged in at 1205.6-1181.2, which happens to converge nicely with two trendline supports (1130.1/1071.2).
Daily view: While the weekly picture is currently showing scope for further downside this week, the daily candlesticks are interacting with demand. As you can see from the chart, price fed off a smaller (less obvious) demand at 1234.6-1244.9 on Friday, allowing the more prominent demand at 1250.1-1265.0 to remain intact for now. In the event that the bulls manage to remain afloat here, there is very little that we see stopping price action from rallying back up to retest daily resistance coming in at 1301.5.
H4 view: Thanks to a lower than expected US jobs report on Friday, we saw the yellow metal whipsaw through the broken Quasimodo line at 1257.4, touch gloves with a supply at 1268.1-1265.0 and then aggressively push down to demand chalked up at 1234.6-1241.3 (located within the extremes of the daily demand discussed above at 1234.6-1244.9).
Direction for the week: This all depends on how the daily buyers handle themselves around the above said daily demands. Supposing that they’re able to hold ground and push higher, weekly action may be forced back up to retest the recently broken support area.
Direction for today: Direction today looks rather limited since there’s little space for price to move. As far as we see things, buying, when we have not only the aforementioned H4 broken Quasimodo line in view, but also two H4 supplies at 1268.1-1265.0/ 1277.1-1272.4, is just asking for some drawdown! In regard to selling, yes, there’s a little room for price to retest the top edge of H4 demand at 1234.6-1241.3 from current prices, but selling here knowing that you’re shorting into daily demand, even though the weekly candles look set to extend lower, is not something we would feel comfortable participating in.
Our suggestions: ‘Sometimes the best position is no position’. This is so very true, and we believe this to be case with gold right now. That is, at least until the daily candles give some indication into which way they may break.
Levels to watch/live orders:
- Buys: Flat (Stop loss: N/A).
- Sells: Flat (Stop loss: N/A).


