![]() Technical analysis requires the use of various tools, and is often associated with the application of indicators. The award-winning MetaTrader 4 (MT4) platform offers an extensive selection of technical indicators. It is one of the most popular trading platforms for forex traders, owing to its ease of use, generous features and automated trading ability.
Technical analysis requires the use of various tools, and is often associated with the application of indicators. The award-winning MetaTrader 4 (MT4) platform offers an extensive selection of technical indicators. It is one of the most popular trading platforms for forex traders, owing to its ease of use, generous features and automated trading ability.
What’s an indicator?
A technical indicator uses a statistical approach, calculated by means of historical price data. Its central function is forecasting future price movement.
in indicators use closing prices as a means of calculation, whereas others also integrate the open, high, and low. In addition to this, some include volume/open interest into the formula, though this is a challenge in the foreign exchange market given its decentralised over-the-counter (OTC) nature.
According to their functionalities, indicators split into two primary groups:
- Oscillators are the more common type of technical indicator, typically restricted within a range from 0 to a high of 100, where 0 represents oversold (bullish) conditions and 100 signifies overbought (bearish) territory.
- Trend indicators function best when markets develop strong trends. These indicators tend to be ineffective within ranging markets and, more often than not, lead to false signals.
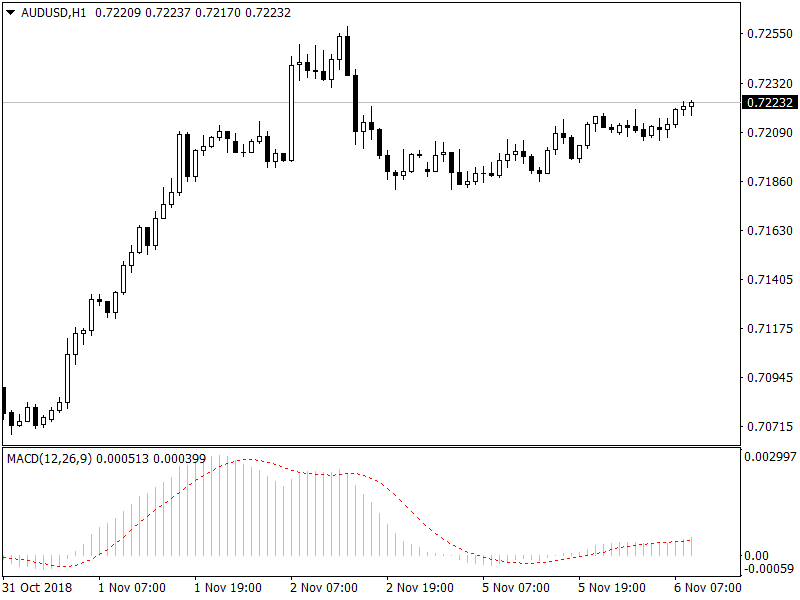
Depending on the indicator selected, it’s generally applied in a separate window on MT4 that has a specific vertical scale, essentially segregated from price action (as shown using the MACD below).
Popular MT4 indicators
Did you know most trading platforms offer in excess of 100 indicators? As you might expect, this often leaves forex traders overwhelmed.
Before diving into some of the indicators that have stood the test of time, traders may want to note the best indicator will always be the one that suits YOUR trading style and personality. What may work for one trader might be ineffective for another!
Moving averages:
Moving averages are trend indicators, which essentially helps to smooth out price fluctuations over a given time period.
Two of the most popular moving averages are the simple (SMA – red) and exponential (EMA – blue), both of which are displayed on the chart below, calculated using a value of 200 periods.
The slower the moving average, the smoother it’ll appear on the chart as it’s calculated over a longer period. The only difference between the SMA and EMA is the sensitivity between the two calculations. The EMA applies a higher weighting to recent prices, whereas the SMA assigns equal weighting to all values.
A well-known technique using moving averages is trend identification. If price action remains above the moving average, the uptrend is intact. A sustained move below the moving average, nevertheless, portends a down trending market. Another popular technique is the moving average crossover. This can be used as either part of an entry method, or as a way of indicating a potential trend change.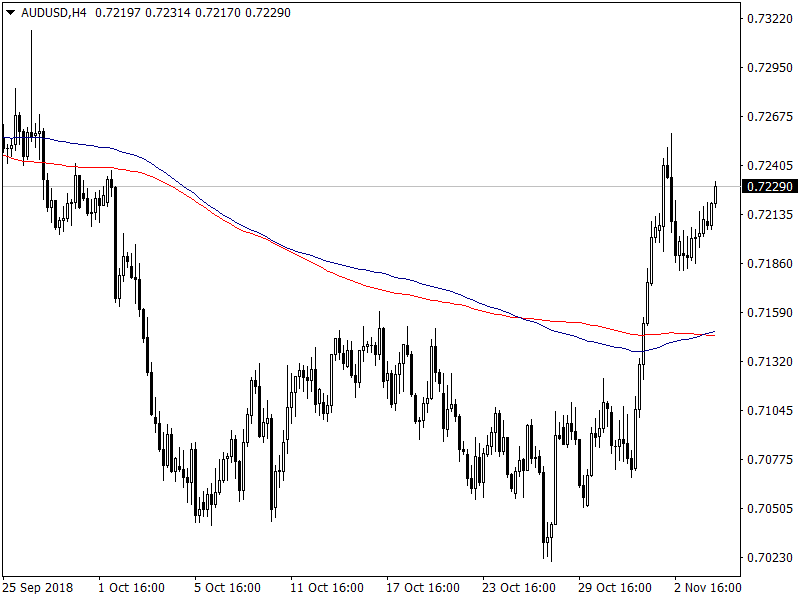
Relative Strength Index:
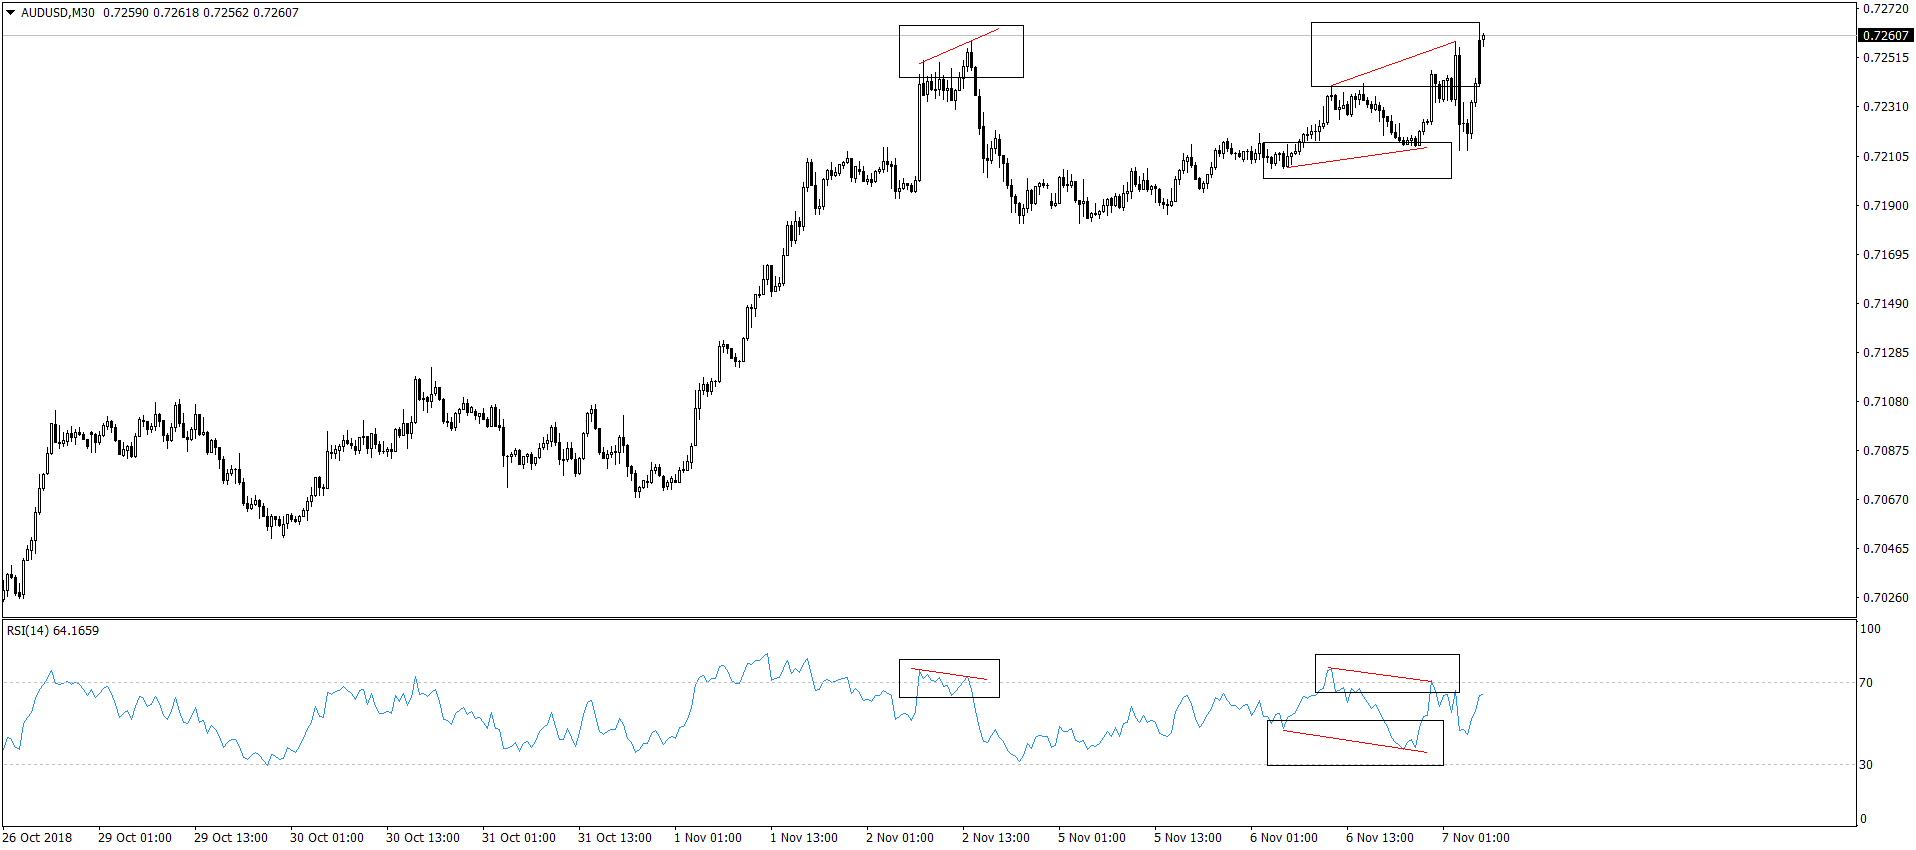
Developed by J. Welles Wilder, the Relative Strength Index, or RSI, is a momentum oscillator. This is an incredibly popular indicator among market technicians.
The indicator’s primary use is to identify overbought and oversold readings in the market. Traditionally, an RSI value beyond 70 indicates overbought conditions (a potentially weakening market); whereas an RSI value below 30 suggests oversold conditions (an advance higher may be in the offing). Another common technique to forecast potential price direction is divergence. Divergence occurs when the underlying price (the candles) prints a new high/low not confirmed by the RSI indicator (shown on the chart below).
During strong trends, the RSI may remain overbought or oversold for extended periods of time. This is important to recognize as it can lead to numerous false signals.
The RSI indicator’s default calculation is 14 periods, which is the suggested value by Wilder in his book. This means the indicator examines the behaviour of 14 previous candle closes to create a reading, regardless of the timeframe being analysed.
In terms of the indicator’s calculation, today’s trading platforms are capable of performing the RSI calculation automatically, leaving traders free to focus on trading. However, for those who wish to understand how the RSI reading is determined, here’s a brief look at its calculation:
RS = average gain in the period / loss in the period.
RSI = 100 – (100 / [1 + RS]).
Average gain is calculated as (previous average gain * (period – 1) + current gain) / period except for the first day which is just a SMA. The average loss is similarly calculated using losses.
Pivot points:
Initially employed by pit traders on the floors of equity and futures exchanges, pivot point levels have, for most technicians, proven useful.
Traders use pivot points as a way of computing horizontal support and resistance levels, drawn directly on the platform’s chart. Pivot points are generally traded the same way as traditional s/r levels.
Pivot points form their calculation using the high, low and closing prices of a previous day, week or month.
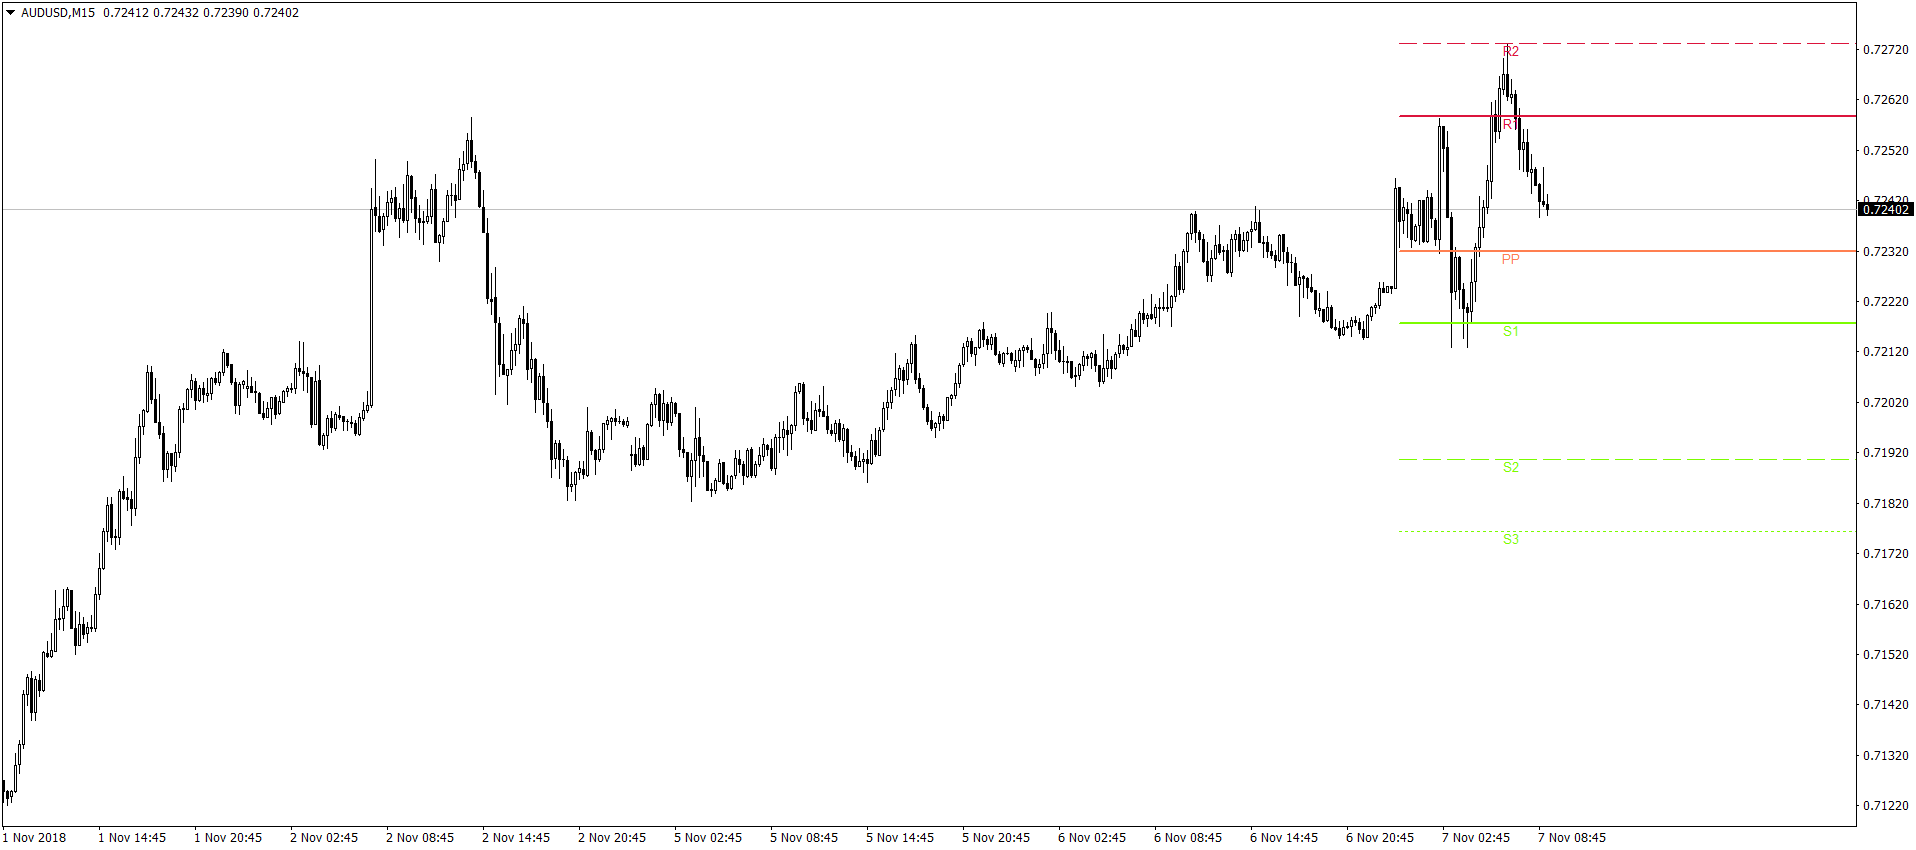
As you can see from the chart below, the arrangement consists of seven levels:
- The ‘P’ represents the pivot point.
- R1, 2 and 3 (not seen on the screen) are corresponding resistances.
- S1, 2 and 3 are corresponding supports.
Assembled in daily (as below), weekly, monthly and yearly format, just about any type of trader can find use in this tool.
Your trading strategy
Although the indicators presented here are some of the most popular and widely used in the forex market, the article barely scratches the surface regarding the world of forex indicators. For instance, the stochastic indicator and MACD indicator offer similar roles as the RSI. There’s also the popular Bollinger band indicator which is applied atop of price action. In addition to a wide variety of technical indicators included in the MT4 platform, traders are also able to create their own custom indicators (think expert advisor here [EA]) based on specified factors. It is your job, as a trader, to find which suits your style of trading.
A closing point for aspiring FX traders is to try and avoid relying exclusively on one metric/indicator to base a trading decision on. When price joins a point at which multiple technical tools meet (in agreement), this is where high-probability trading setups are found. The ability to exercise patience and hold for these areas of confluence is a common trait among professional traders.