
Key risk events today:
RBA Financial Stability Review; Canada Employment Change and Unemployment Rate.
(Previous analysis and outside sources – italics).
EUR/USD:
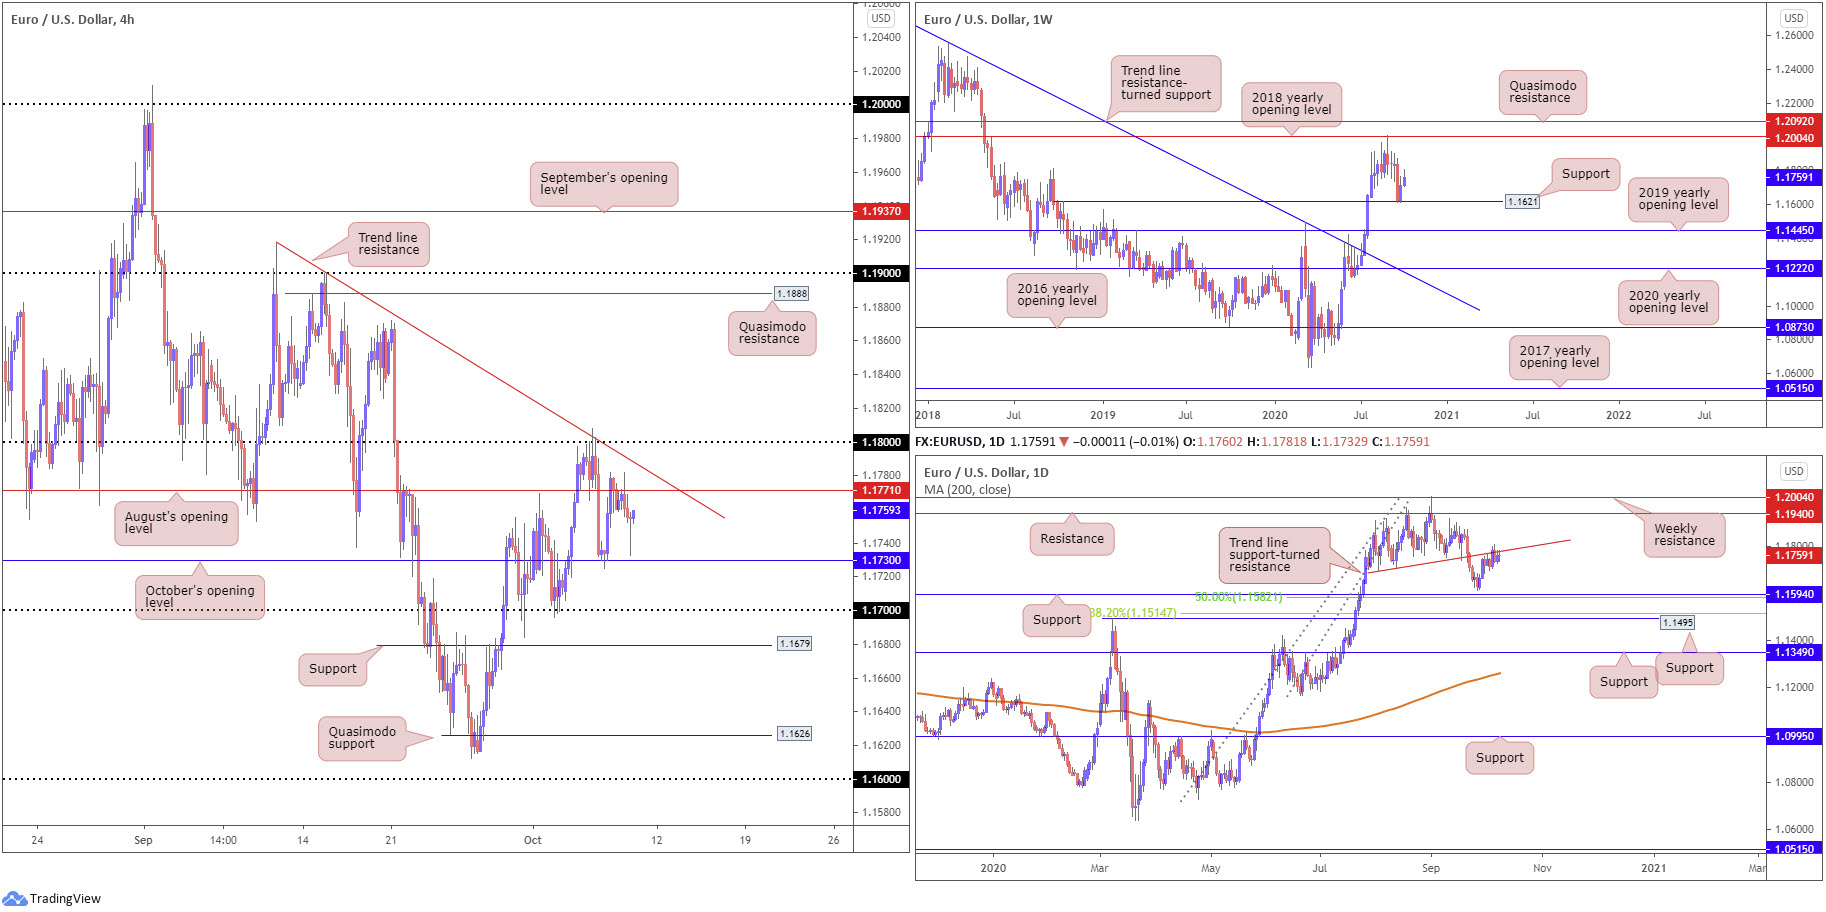
It was a relatively muted session for EUR/USD Thursday, capped under August’s opening value at 1.1771 on the H4 timeframe. An attempt to draw in fresh bids off October’s opening value at 1.1730 was seen, though price fell short at lows from 1.1732. Overhead, trend line resistance, taken from the high 1.1917, and the 1.18 handle is visible. Beyond here, we do not see much on offer until Quasimodo resistance at 1.1888. Below 1.1730, nevertheless, 1.17 is likely to call for attention.
Further out on the weekly timeframe, price action recently responded to minor support at 1.1621, set just north of the 2019 yearly opening value at 1.1445. An extension to the upside potentially throws the 2018 yearly opening value at 1.2004 back into action. A closer reading of price action on the daily timeframe reveals the unit to be challenging a trend line support-turned resistance, etched from the low 1.1695. Removing this line calls for resistance at 1.1940, whereas a rejection shines the spotlight on support at 1.1594 (and 50.0% retracement ratio at 1.1582).
Areas of consideration:
H4 trend line resistance, taken from the high 1.1917, and August’s opening value at 1.1771 offers noteworthy resistance, particularly as we’re trading from a daily channel resistance. October’s opening value at 1.1730 and maybe a test of 1.17 could be on the cards, should sellers make an appearance.
In the event 1.18 gives way, a continuation to H4 Quasimodo resistance at 1.1888 could be seen. In line with weekly direction, climbing above 1.18 is potentially appealing to intraday breakout buyers (conservative traders, nevertheless, are likely to seek at least a 1.18 retest before committing).
GBP/USD:
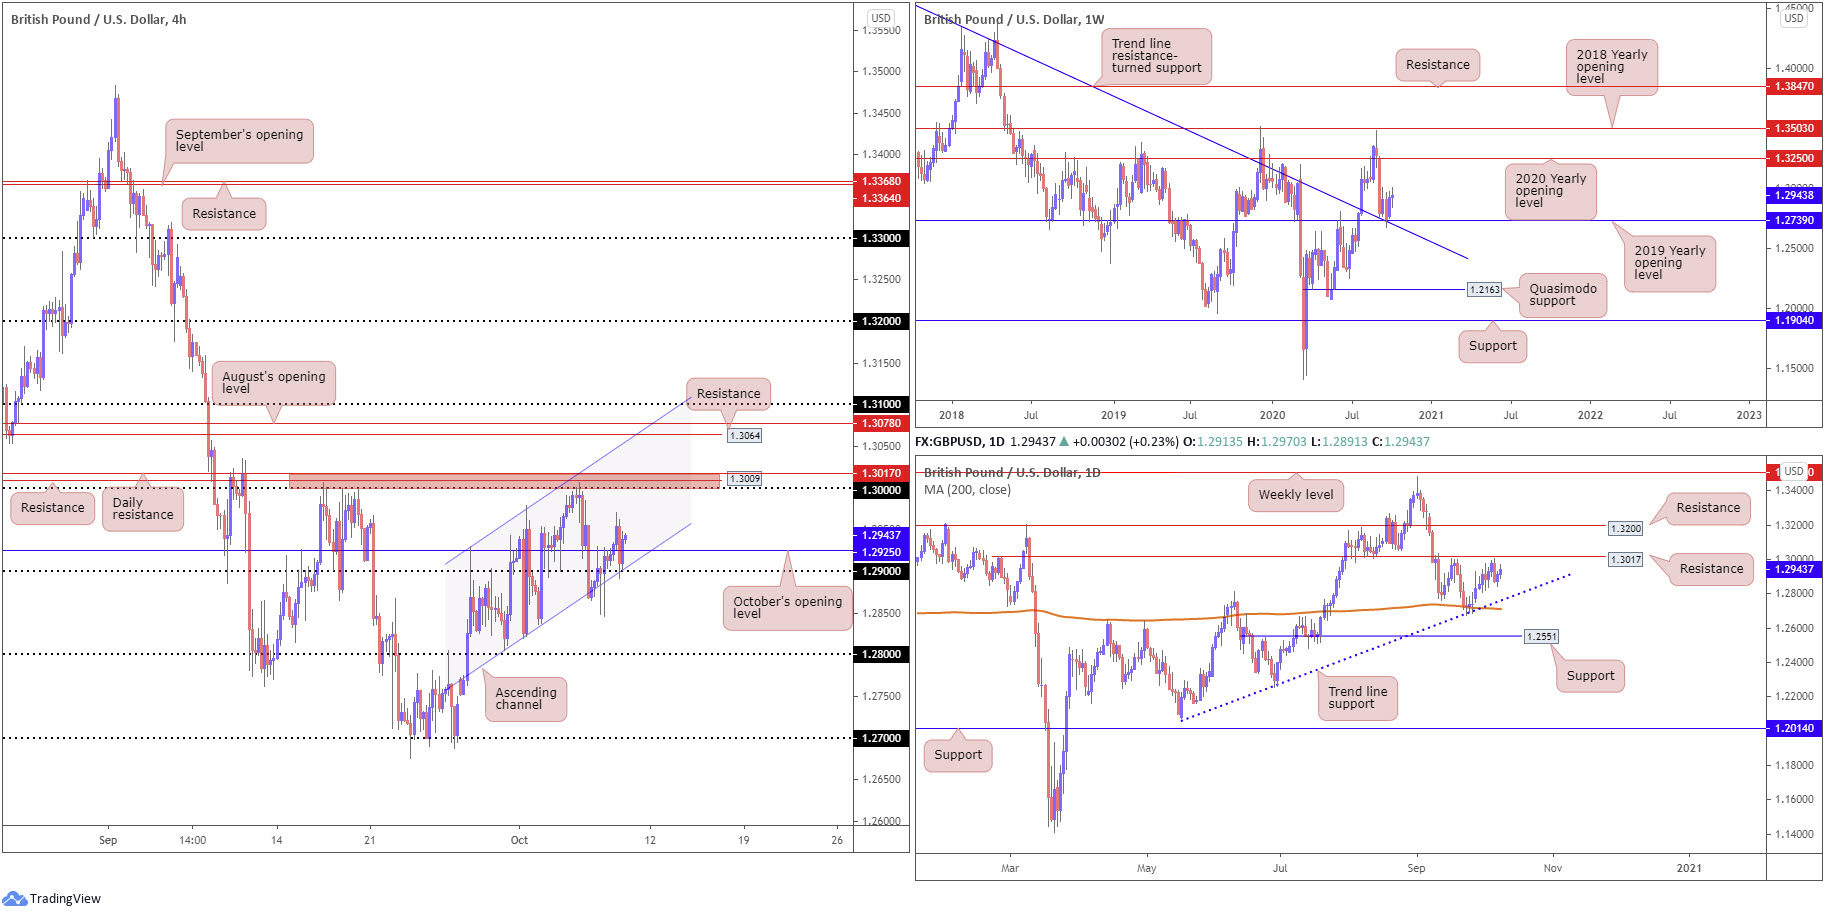
Thursday, as can be seen from the H4 chart, retested the 1.29/channel support (1.2805) combination and held firm, printing a close back above October’s opening value at 1.2925. This has potentially transferred energy back towards the key figure 1.30 ([red] surrounded by H4 resistance at 1.3009 and daily resistance at 1.3017).
From the weekly timeframe, GBP/USD finished last week higher by nearly 200 points after crossing swords with support at 1.2739, a 2019 yearly opening value. Technicians will acknowledge 1.2739 also blends with trend line resistance-turned support, extended from the high 1.5930. In terms of resistance, price has room to advance as far north as the 2020 yearly opening value at 1.3250. Crossing 1.2739, on the other hand, registers a bearish setting, with the 1.2251 June 29 low targeted, closely shadowed by Quasimodo support priced in at 1.2163.
On the daily timeframe, levels to be aware of are the 200-day SMA (orange – 1.2710) and joining trend line support, extended from the low 1.2075, along with 1.3017 resistance.
Areas of consideration:
- 3017/1.30 resistance (red area on the H4) remains a zone to be mindful of.
- The break back above October’s opening value at 1.2925 is likely to spark intraday bullish scenarios to 1.30.
Violating 1.29 and channel support (H4), extended from the low 1.2805, would help confirm bearish strength south of daily resistance at 1.3017 and may see H4 hone in on 1.28, which happens to merge closely with daily trend line support coming in from the low 1.2075.
AUD/USD:
A day after FOMC and the VP Presidential debate, financial markets echoed a subdued tone Thursday.
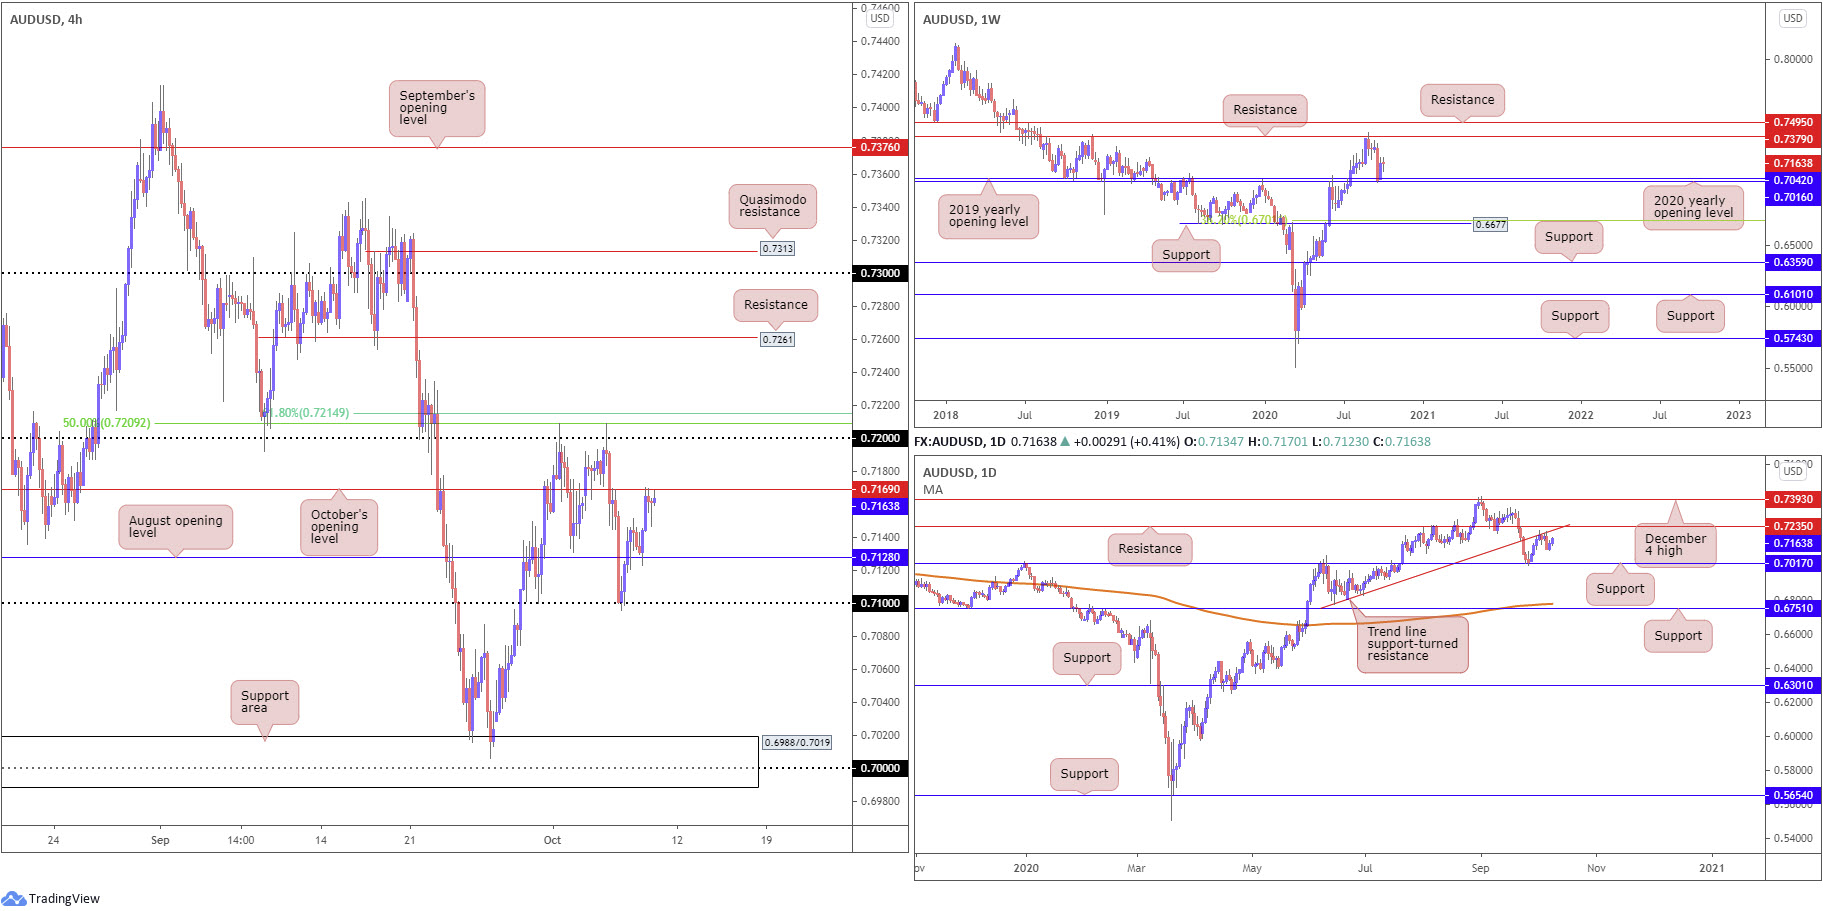
The Australian dollar chalked up modest gains against the US dollar, following an early retest at August’s opening value from 0.7128 on the H4 timeframe. Upside momentum, though, as you can see, slowed as price crossed swords with October’s opening value at 0.7169. A break north of the latter today, however, could find candle action rallying to shake hands with the 0.72 handle, closely shadowed by a 50.0% retracement at 0.7209 and a 61.8% Fibonacci retracement ratio at 0.7215.
From the weekly timeframe (unchanged since Monday’s weekly report):
Buyers pencilled in a strong presence off the 2020 and 2019 yearly opening values at 0.7016 and 0.7042 last week, respectively, following a 3.6% decline the week prior. Additional bullish sentiment could target as far north as resistance at 0.7379. It might also be worth noting the trend in this market remains to the upside, therefore the rebound from 0.7016/0.7042 may be interpreted as a dip-buying signal. Should the market fail to extend recovery gains, support priced in at 0.6677 is next in the firing range, alongside a 38.2% Fibonacci retracement ratio at 0.6701.
From the daily timeframe, trend line support-turned resistance, extended from the low 0.6776, remains an active base, sited ahead of another resistance at 0.7235. Support at 0.7017 is seen as the next downside target, with a break exposing the 200-day SMA (orange – 0.6780).
Areas of consideration:
Transitioning into Friday’s sessions, buyers appear to hold the upper hand. Room to rally higher on both the weekly and daily charts could lift H4 above October’s opening value at 0.7169 and spark an intraday bullish theme towards the 0.72 neighbourhood and, with some oomph, maybe daily resistance at 0.7235.
USD/JPY:
USD/JPY traded sideways on Thursday, struggling to pin down any firm direction. As a result of this, much of the following analysis will echo thoughts aired in Thursday’s technical briefing.
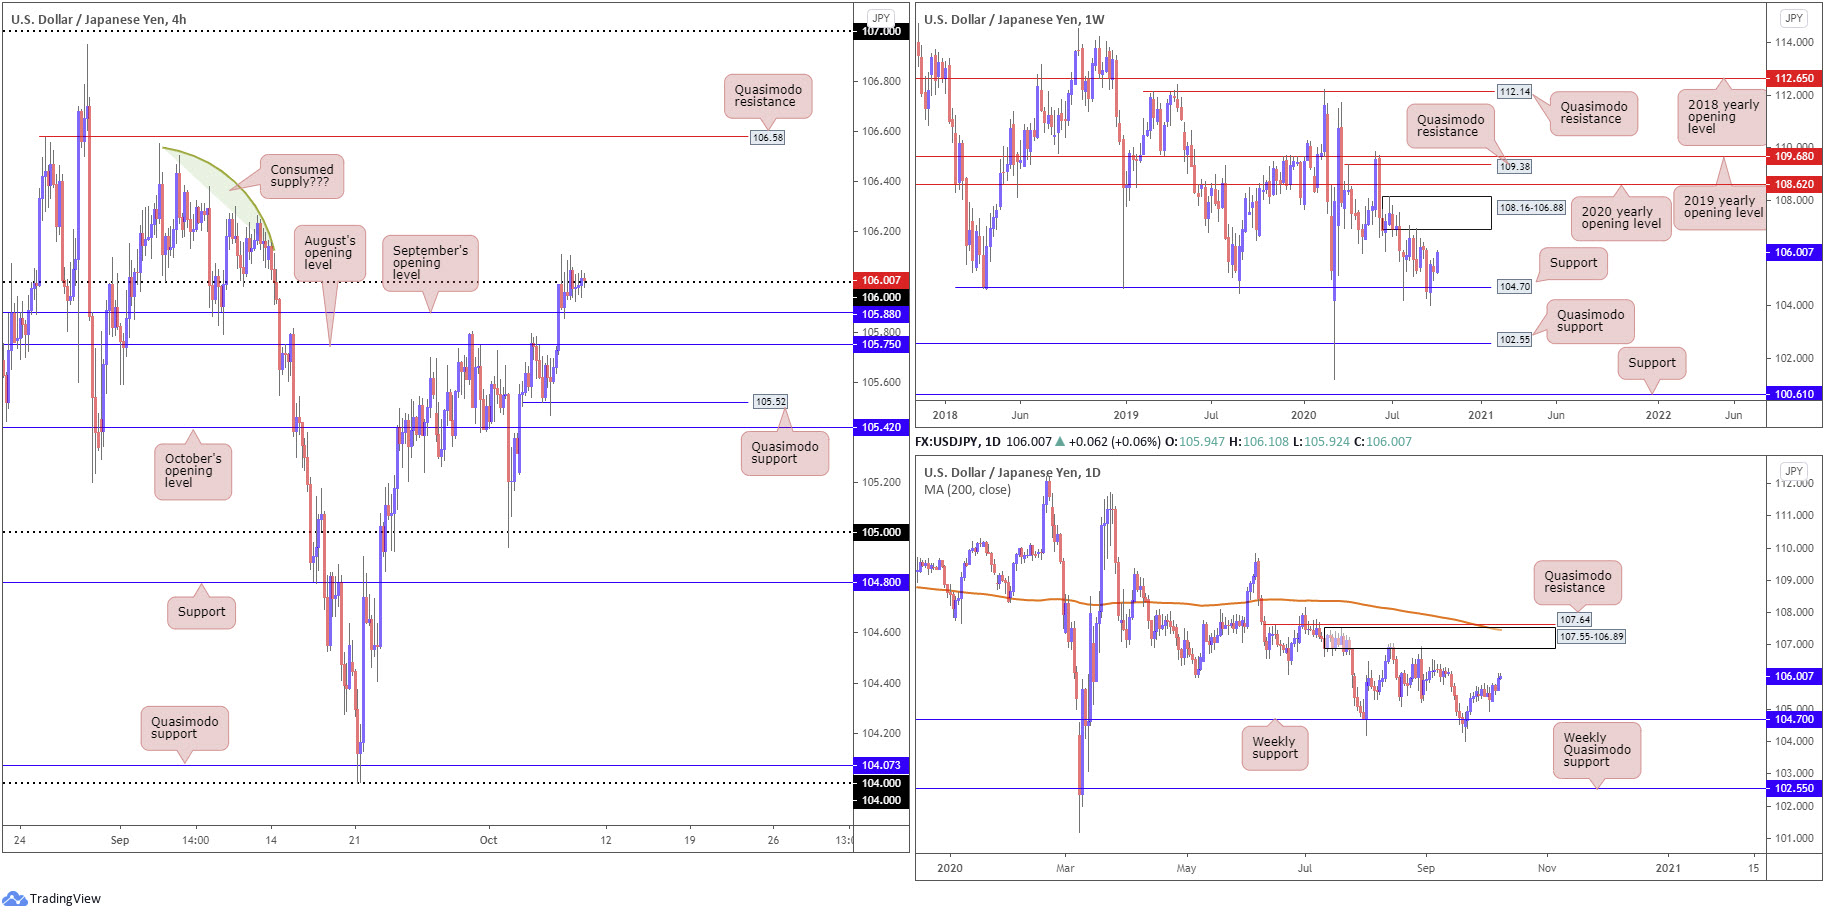
Following a retest at the top edge of September’s opening value from 105.88 (H4), intraday flow is on course to overthrow 106 and shine the spotlight on Quasimodo resistance at 106.58.
From the weekly timeframe (unchanged since Monday’s weekly report):
Supply at 108.16-106.88 remains prominent on the weekly timeframe, capping upside since price made its way off support at 104.70 at the end of July. The aforementioned support also recently made a second showing, with price rebounding nearly 1%. Both areas, therefore, remain firmly on the watchlist.
From the daily timeframe (unchanged since Monday’s weekly report):
Supply at 107.55-106.89, an area housed within the lower boundary of weekly supply mentioned above at 108.16-106.88, remains on the radar. Upside momentum derived from weekly support at 104.70 highlights the possibility of readdressing the aforementioned supply. Of note, the daily area also benefits from nearby Quasimodo resistance at 107.64 and the 200-day SMA (orange – 107.46).
Areas of consideration:
H4 settling above the 106 could stimulate activity towards H4 Quasimodo resistance at 106.58, followed by 106.88/89 (the underside of higher timeframe supply). A successful 106 retest will also likely be interpreted as willingness from buyers.
USD/CAD:
Weighed on the back of a rise in oil prices, USD/CAD plunged to levels not seen since September 21.
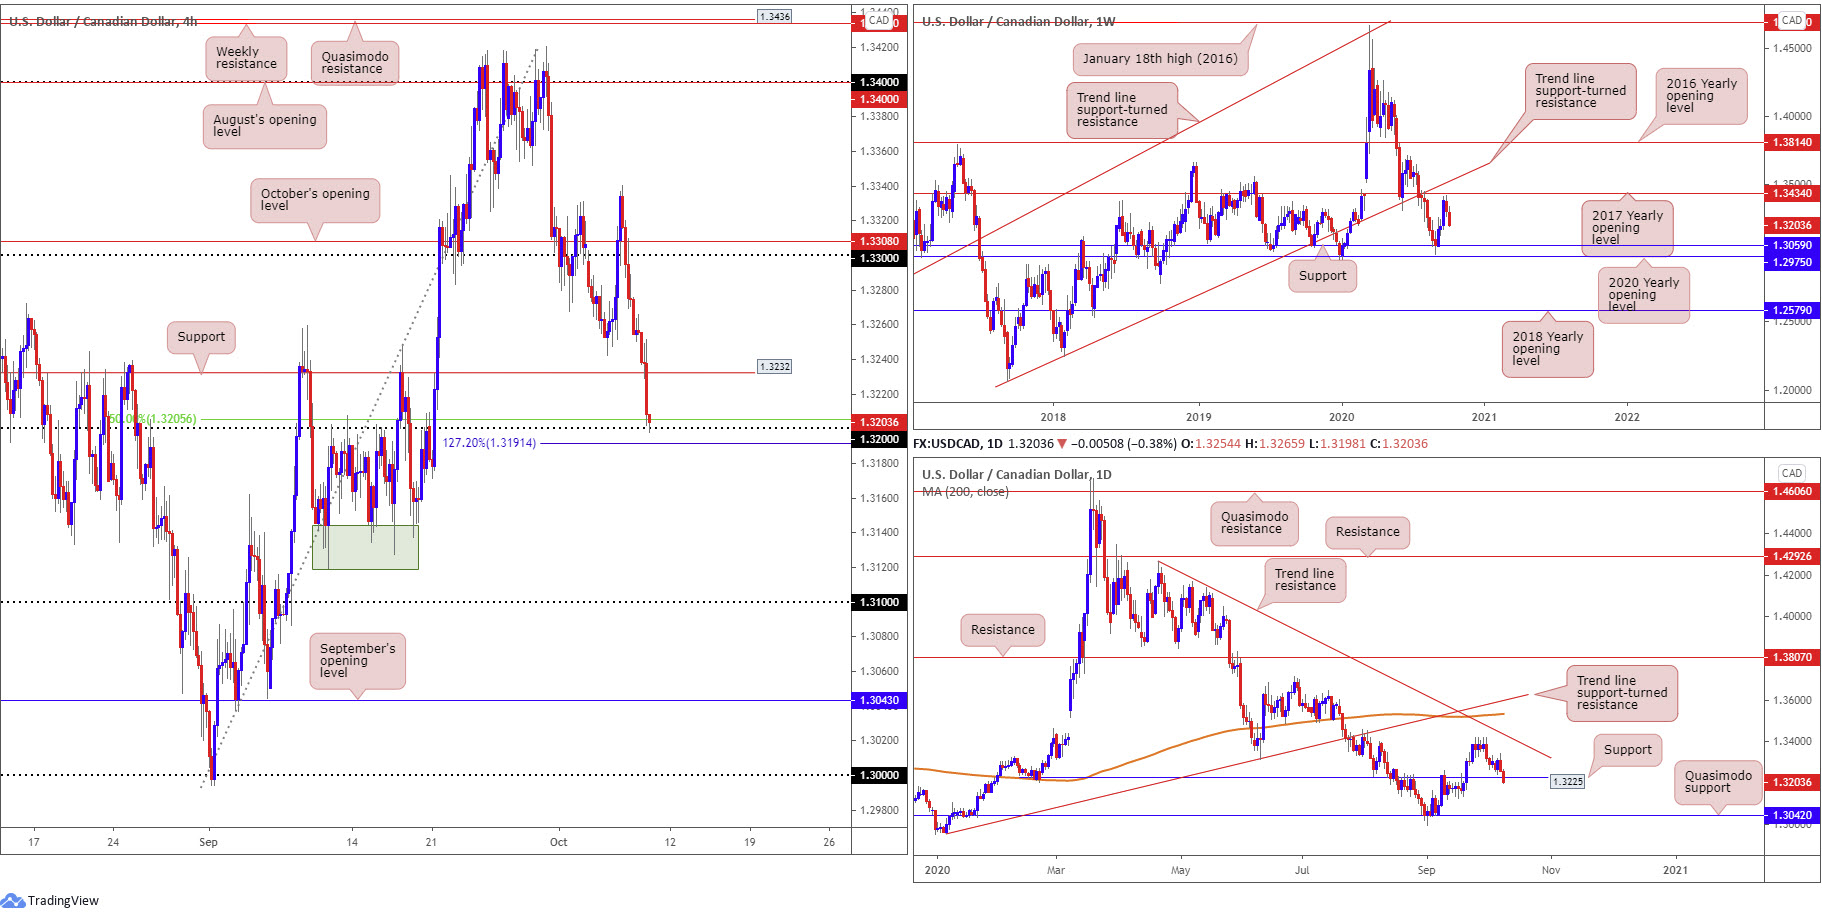
H4 tunnelled under support at 1.3232 (now a serving resistance) and ran into the 1.32 handle, a level which happens to be surrounded by a 50.0% retracement ratio at 1.3205 and a 127.2% Fibonacci extension point at 1.3191. Below here, sellers have room to address lower territory until reaching a base of support around 1.3130 (green) and the 1.31 handle.
Higher on the curve, daily price is seen navigating terrain under support at 1.3225. A close lower could unshackle downside to Quasimodo support coming in at 1.3042. On the weekly timeframe, price recently came within touching distance of the 2017 yearly opening value at 1.3434 and rotated lower (sited just under trend line support-turned resistance, taken from the low 1.2061). Follow-through selling could eventually tug the currency pair back to support at 1.3059, pinned just north of the 2020 yearly opening value at 1.2975.
Areas of consideration:
1.32 on the H4, and surrounding Fibonacci levels at 1.3191 and 1.3205, is unlikely to deliver much upside. This is largely due to weekly price turning lower ahead of resistance with room to extend downside, and daily action recently slicing through support at 1.3225. In addition, the immediate trend faces south (see daily timeframe).
With the above in mind, bearish signals could form south of 1.32 today/early next week, targeting 1.3130ish on the H4, followed by 1.31.
USD/CHF:
In light of yesterday’s lacklustre performance, the outlook going into Friday’s sessions remains mostly unchanged.
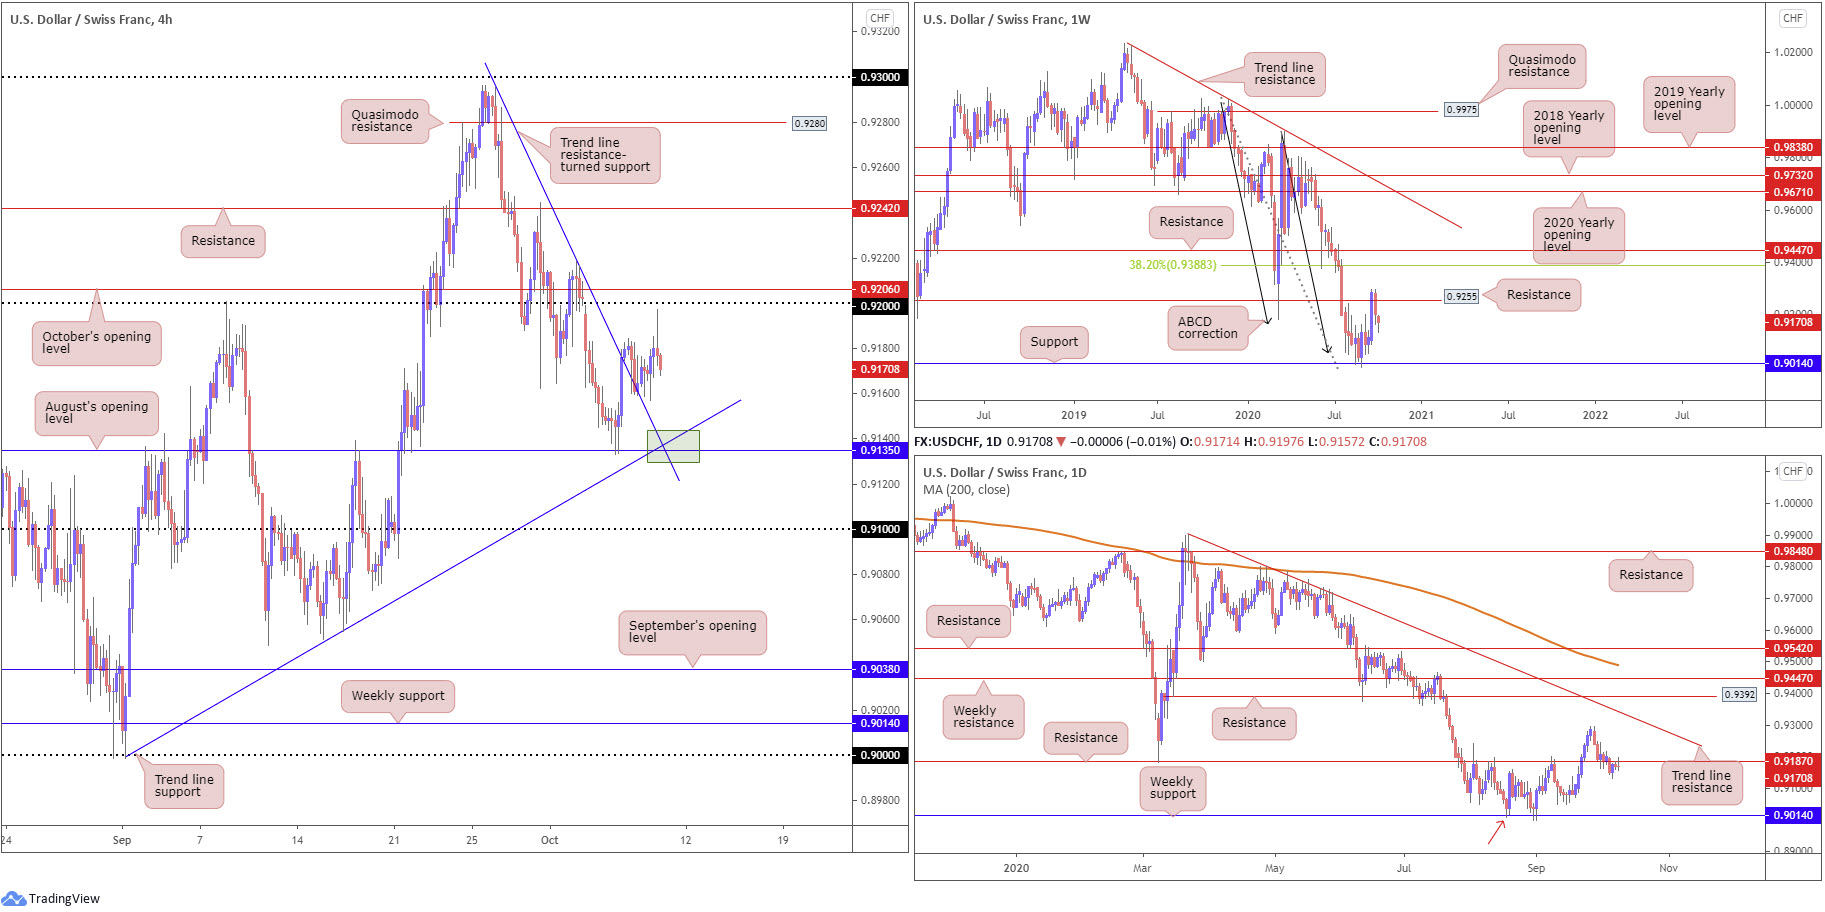
Technical flow has weekly price languishing south of resistance at 0.9255 (a previous Quasimodo support level). This follows a recent rebound from support at 0.9014, as well as ABCD support at 0.9051 (black arrows). Should buyers regain consciousness, the focus above current resistance falls in at a 38.2% Fibonacci retracement ratio at 0.9388, a common take-profit target out of ABCD patterns (derived from legs A-D).
A closer examination of price action on the daily timeframe, nonetheless, reveals the unit absorbing orders around resistance at 0.9187, a critical level during August and September. Dropping through this level on Monday offers an early cue to further weakness on the weekly timeframe, targeting the aforementioned weekly support (also stands as a Quasimodo support on the daily chart – red arrow).
Meanwhile, on the H4 timeframe, Thursday modestly responded from trend line resistance-turned support, taken from the high 0.9295, spiking to peaks just south of the 0.92 handle. With Thursday also printing a half-hearted shooting star candle pattern (bearish signal), traders are urged to pencil in the possibility of a retreat to August’s opening value at 0.9135, particularly at the green area as it is a point the level merges with two trend line supports (0.9295/0.8998).
Areas of consideration:
According to the weekly and daily timeframes, both charts show scope to explore lower levels. This, of course, adds weight to the recently established H4 shooting star candlestick pattern printed below 0.92.
On the basis of the above, H4 sellers are likely to target August’s opening value at 0.9135 as an initial point, with a break through the level perhaps fuelling further selling towards 0.91.
Dow Jones Industrial Average:
US stocks elbowed higher Thursday amid optimism surrounding a possible agreement on fiscal stimulus measures. The Dow Jones Industrial Average advanced 122.05 points, or 0.43%; the S&P 500 climbed 27.38 points, or 0.80% and the Nasdaq traded higher by 56.38 points, or 0.50%.
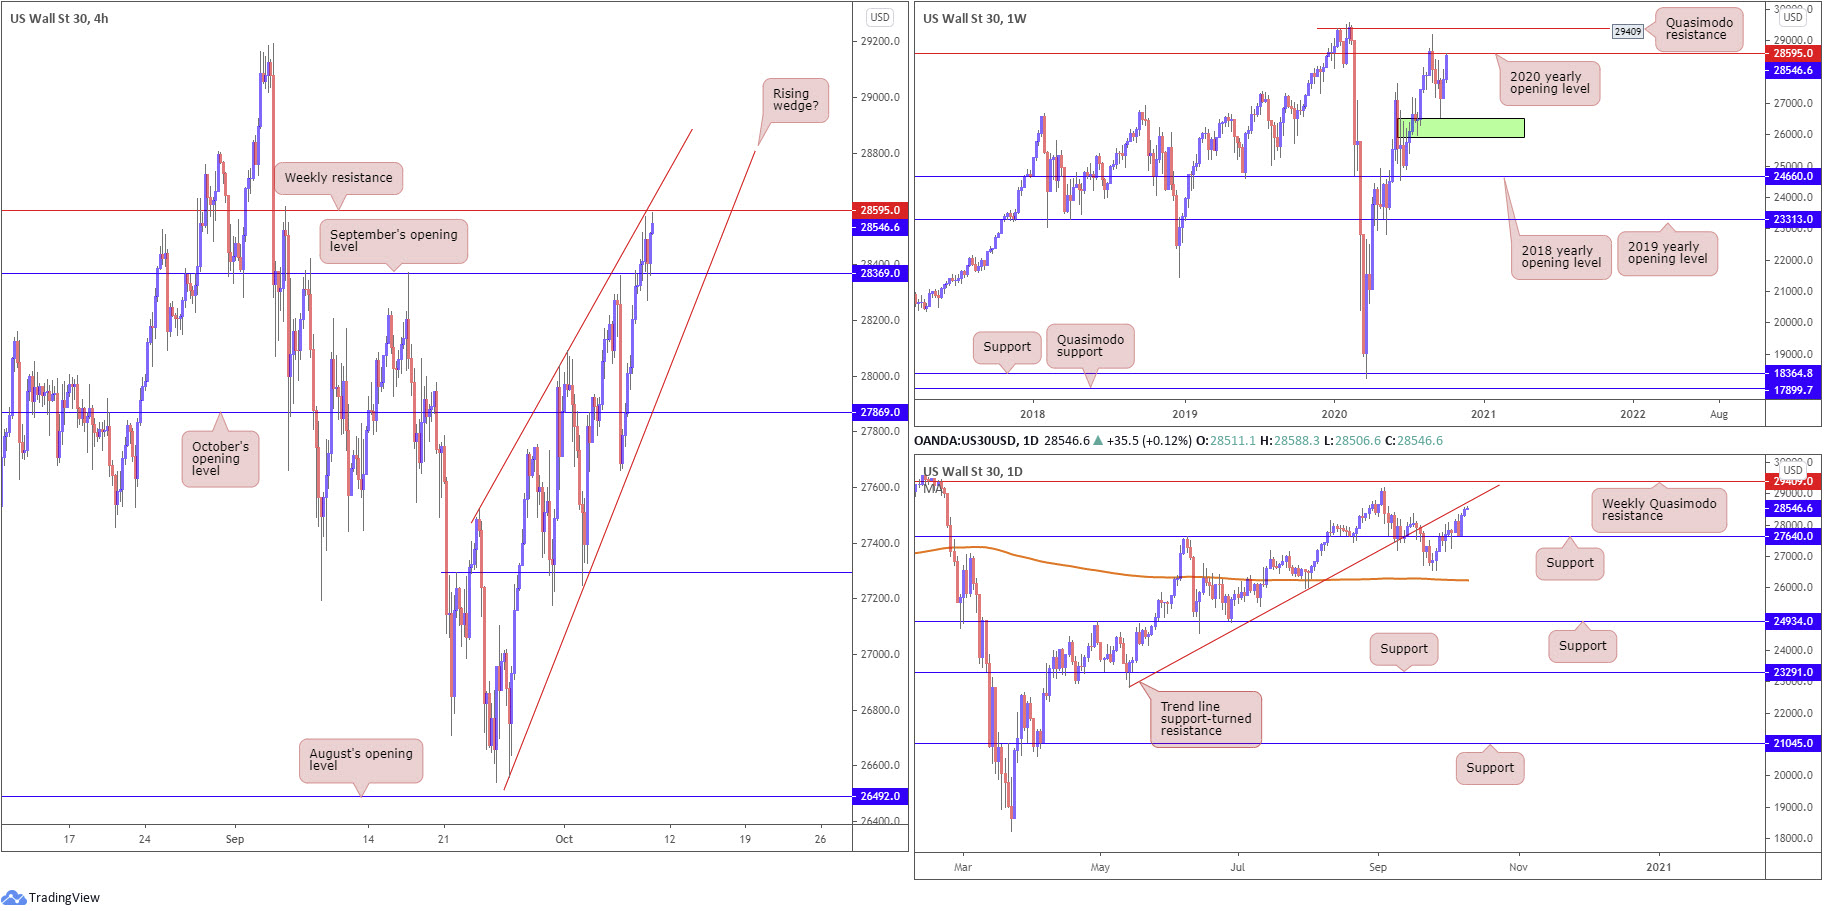
Technically, we’re at an interesting juncture. Price action, thanks to the wave of buying recently seen, is within striking distance of testing the 2020 yearly opening value at 28595 on the weekly timeframe, considered resistance. Not only that, we can also see daily structure throwing in a trend line support-turned resistance, extended from the low 22803, and H4 establishing a potential rising wedge from 26558/27521.
Areas of consideration:
A reaction from the 2020 yearly opening value at 28595, movement that takes the index back under September’s opening value at 28369 (H4), signals a bearish scenario.
A H4 close beneath the lower edge of the rising wedge pattern would likely see additional downside materialise. Structurally, we do not see much support to hang our hat on until October’s opening value at 27869 on the H4 timeframe.
XAU/USD (GOLD):
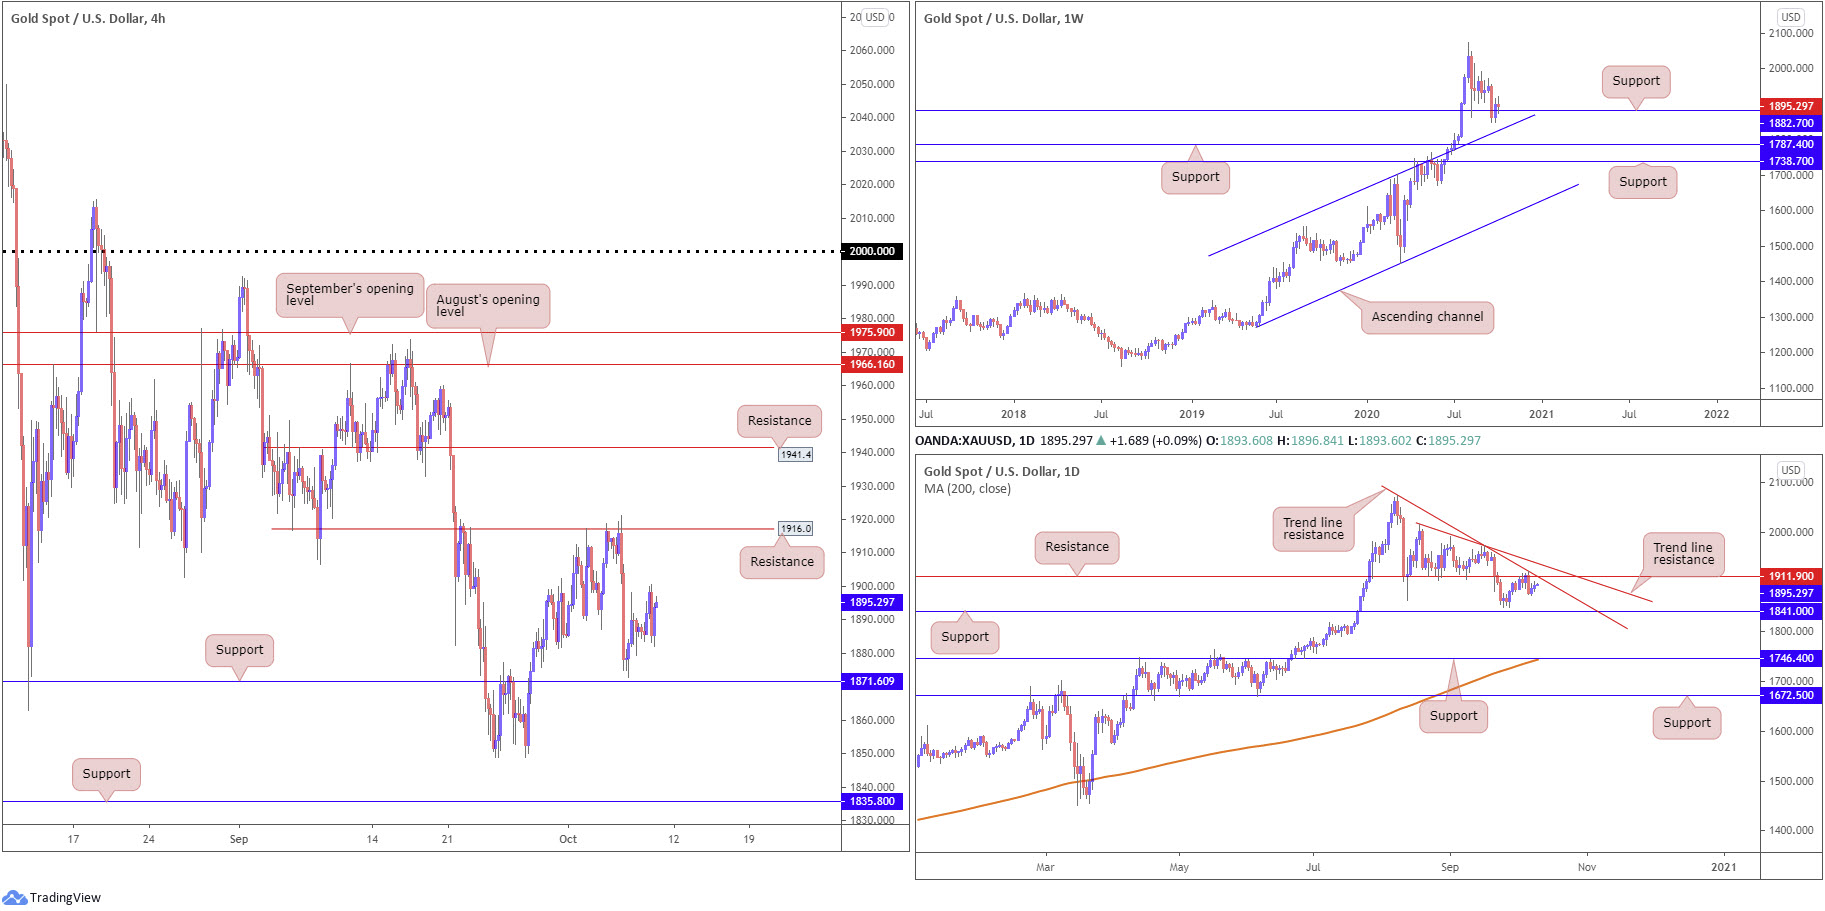
XAU/USD prices were little changed Thursday, hovering just north of H4 support at $1,871. Gaining ground from here throws H4 resistance at $1,916 back into the pot, while a break uncovers another layer of resistance priced in at $1,941. In the event buyers lose their flavour and we take out $1,871, bottoms around $1,848 are seen, as is H4 support coming in at $1,835.
Daily price receded from resistance at $1,911 earlier in the week, aided by trend line resistance, extended from the high $2,075. Scope to approach support at $1,841 is still on the cards, despite the mild two-day recovery.
On the weekly timeframe, however, price remains circling a support level at $1,882 (positioned above channel resistance-turned support, taken from the high $1,703). In addition to this, the trend in this market has faced decisively north since 2016.
Areas of consideration:
Outlook mostly unchanged due to the lacklustre response on Thursday.
Traders are likely monitoring H4 support at $1,871 today.
A H4 close below $1,871 could ultimately trigger bearish scenarios to H4 support at $1,835, which sits just under daily support at $1,841 (the next downside target on the daily timeframe).
A decisive rebound from $1,871, nevertheless, suggests the pendulum may swing in favour of weekly bulls off support at $1,882.
H4 resistance at $1,916 is also worth keeping a tab on, owing to its connection with the daily resistances.
The accuracy, completeness and timeliness of the information contained on this site cannot be guaranteed. IC Markets does not warranty, guarantee or make any representations, or assume any liability regarding financial results based on the use of the information in the site.
News, views, opinions, recommendations and other information obtained from sources outside of www.icmarkets.com.au, used in this site are believed to be reliable, but we cannot guarantee their accuracy or completeness. All such information is subject to change at any time without notice. IC Markets assumes no responsibility for the content of any linked site.
The fact that such links may exist does not indicate approval or endorsement of any material contained on any linked site. IC Markets is not liable for any harm caused by the transmission, through accessing the services or information on this site, of a computer virus, or other computer code or programming device that might be used to access, delete, damage, disable, disrupt or otherwise impede in any manner, the operation of the site or of any user’s software, hardware, data or property.


