A note on lower timeframe confirming price action…
Waiting for lower timeframe confirmation is our main tool to confirm strength within higher timeframe zones, and has really been the key to our trading success. It takes a little time to understand the subtle nuances, however, as each trade is never the same, but once you master the rhythm so to speak, you will be saved from countless unnecessary losing trades. The following is a list of what we look for:
- A break/retest of supply or demand dependent on which way you’re trading.
- A trendline break/retest.
- Buying/selling tails – essentially we look for a cluster of very obvious spikes off of lower timeframe support and resistance levels within the higher timeframe zone.
- Candlestick patterns. We tend to only stick with pin bars and engulfing bars as these have proven to be the most effective.
EUR/USD:
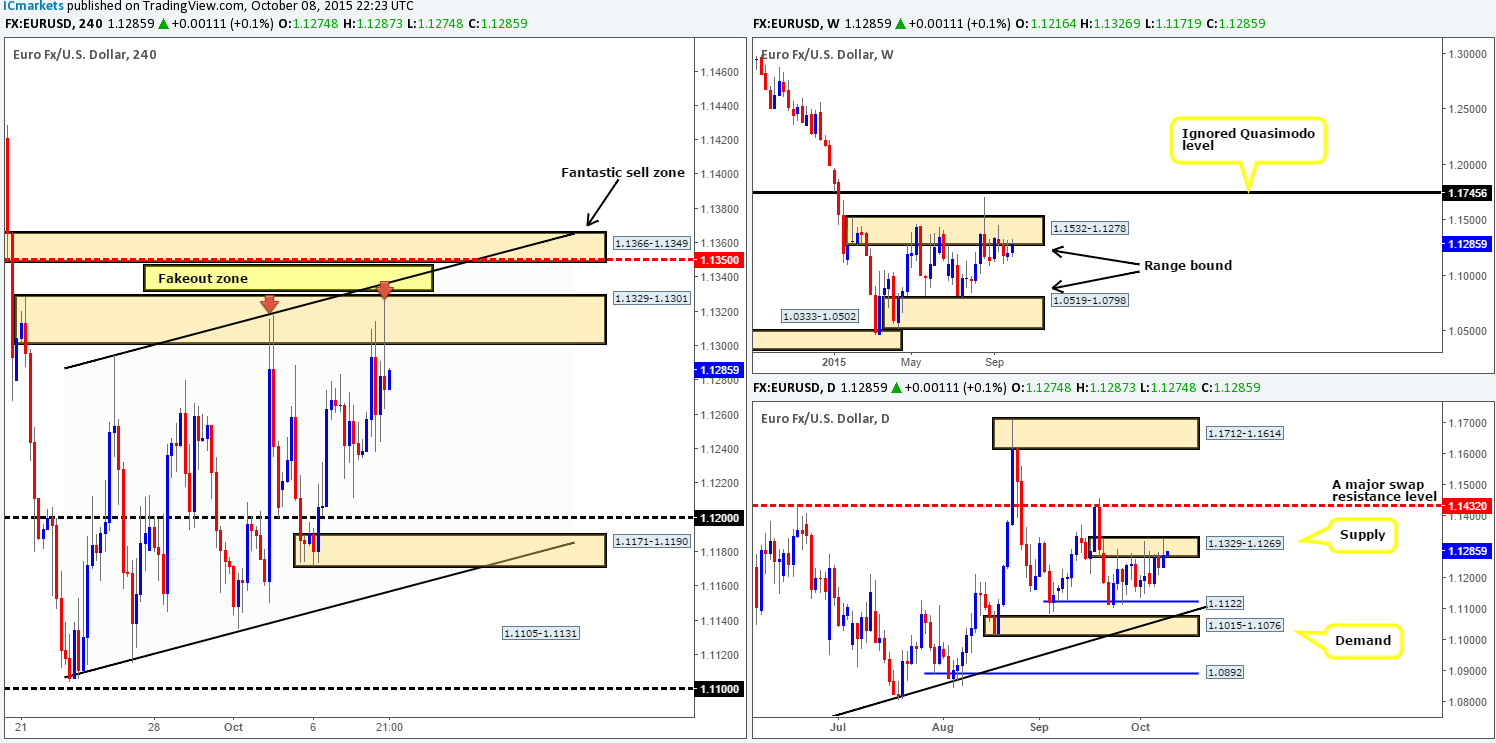
Going into the early hours of yesterday’s sessions, a relatively strong wave of bids came into the market consequently pushing price up to the underside of supply at 1.1329-1.1301, reaching highs of 1.1325 on the day.
This is just beautiful price action forming here guys! As we mentioned in our previous report (http://www.icmarkets.com/blog/thursday-8th-october-volatile-moves-expected-between-11am-12-30pm-gmt-in-gbp-and-usd-markets-remain-vigilant/), there is just a mine field of buy stops above current price begging to be taken! The two red arrows mark resistance points with buy stops likely residing above (1.1318/1.1325). This should be obvious to those who read our last analysis. However, what we did not mention yesterday was there are also buy stops almost certainly sitting just above the aforementioned supply area as well. The big boys know this, and this is exactly why we believe the above said stops will be taken out and price will drive into supply at 1.1366-1.1349. Why this area? Well, it’s fresh; it converges nicely with mid-level resistance at 1.1350 and also coincides with the channel resistance extended from the high 1.1294.
Now, tie all of the above in together with converging weekly and daily supply (1.1532-1.1278/1.1329-1.1269), and we have one awesome sell zone to watch today!
Levels to watch/live orders:
- Buys: Flat (Stop loss: N/A).
- Sells: 1.13465 (Stop loss: 1.13717).
GBP/USD:
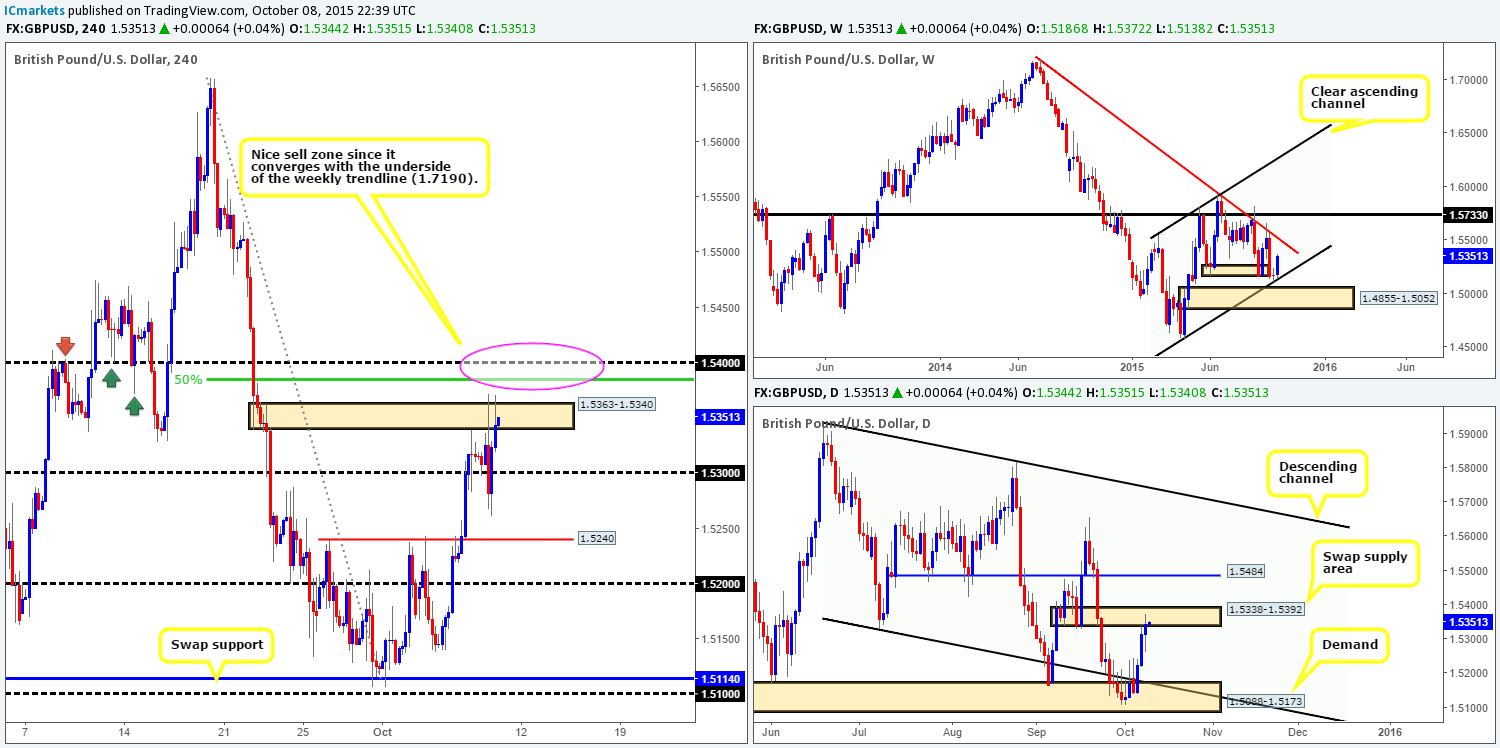
Mid-way through yesterday’s London morning session, Cable stabbed above supply at 1.5363-1.5340, which, as you can see, resulted in a relatively aggressive down move below the 1.5300 handle, reaching session lows of 1.5261. Despite this, trade just as aggressively rallied from this low and ended printing yet another spike above the aforementioned supply zone, suggesting that there’s little offers left within this region.
Now, for anyone who read our previous report on the GBP (http://www.icmarkets.com/blog/thursday-8th-october-volatile-moves-expected-between-11am-12-30pm-gmt-in-gbp-and-usd-markets-remain-vigilant/), you will already know we had little interest in shorting the supply mentioned above other than for an intraday bounce. Ultimately, our team still has their eye on the psychological resistance 1.5400, which, if our above analysis is correct (see above in bold), we may see price connect with later on today. The reasons we believe 1.5400 is a nice barrier to look for confirmed shorts today comes from the following reasons:
- Good swap level history at 1.5400.
- 50% Fibonacci level at 1.5385.
- Positioned just a few pips above the daily swap (supply) area at 1.5338-1.5392.
Levels to watch/ live orders:
- Buys: Flat (Stop loss: N/A).
- Sells: 1.5400 [Tentative – confirmation required] (Stop loss: dependent on where one confirms this level).
AUD/USD:
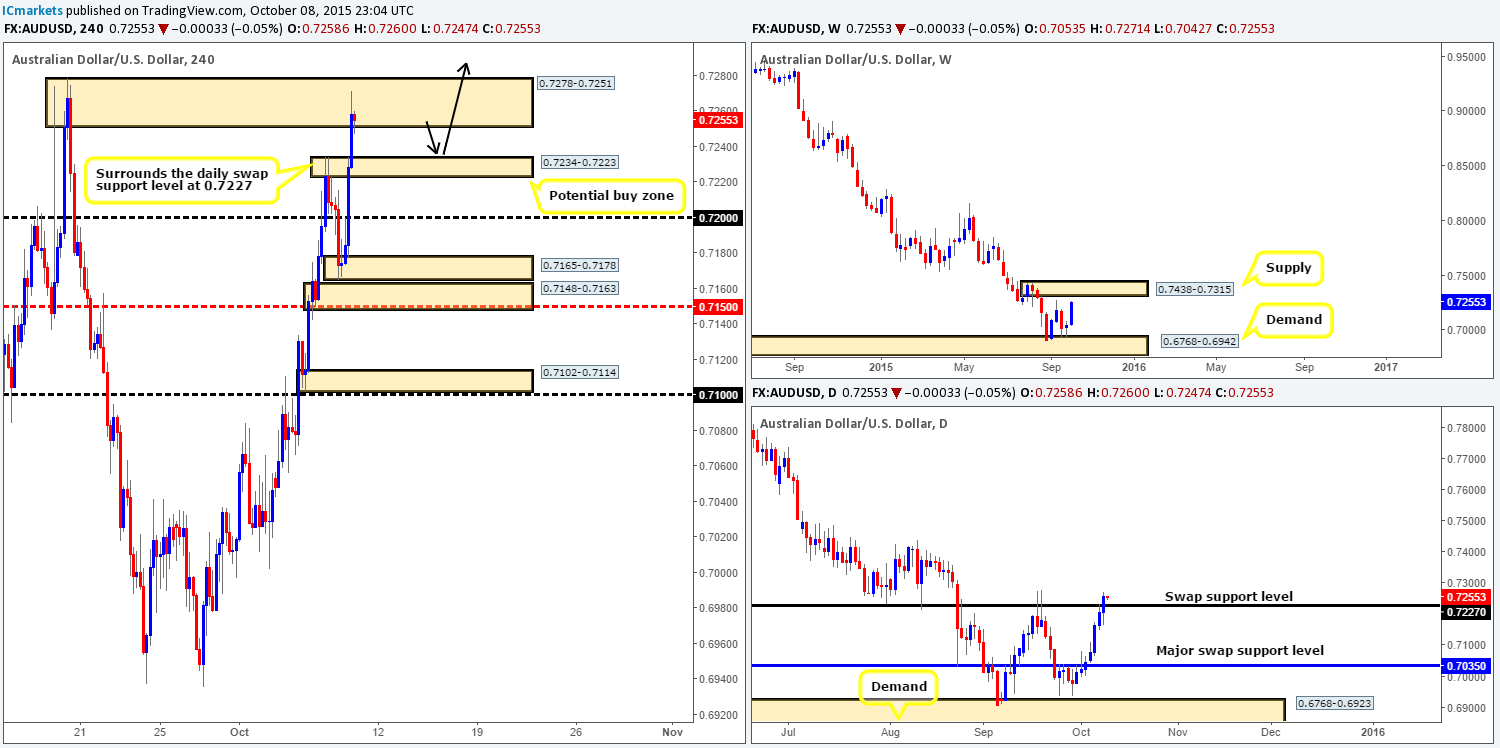
Beginning with the weekly timeframe this morning, we can see that price continues to steam north following the recent rebound from demand coming in at 0.6768-0.6942. The next upside target from here falls in around supply given at 0.7438-0.7315. Daily action on the other hand, shows that buyers printed the seventh consecutive bull candle yesterday after sellers failed to muster enough strength to defend the swap resistance level at 0.7227. Looking down to the 4hr timeframe, The Aussie pair came within touching distance of connecting with our demand zone seen at 0.7148-0.7163, before screaming over 100 pips north up towards supply drawn from 0.7278-0.7251.
So, with the weekly in supply – the daily closing above resistance, and the 4hr also located in supply (see above), where do we see this market heading today?
Taking a short from the 4hr supply today is not really something that interests us. We see very little room to profit, as there are potentially strong bids sitting just below around a swap (demand) area at 0.7234-0.7223 (converges with the daily swap support level at 0.7227).
A long from 0.7234-0.7223 on the other hand could be viable today, since (noted above) this converges with daily structure, as well as there being room seen on the weekly scale to appreciate higher (see above). In addition to this, the recent drive into the current 4hr supply has likely removed a major slab of offers from this area, thus making a long from 0.7234-0.7223 even more appealing. Since this potential buy zone is relatively small, however, a fakeout is highly likely, thus waiting for lower timeframe confirmation before taking a trade is highly recommended!
Levels to watch/ live orders:
- Buys: 0.7234-0.7223 [Tentative – confirmation required] (Stop loss: dependent on where one confirms this area).
- Sells: Flat (Stop loss: N/A).
USD/JPY (slightly revised):
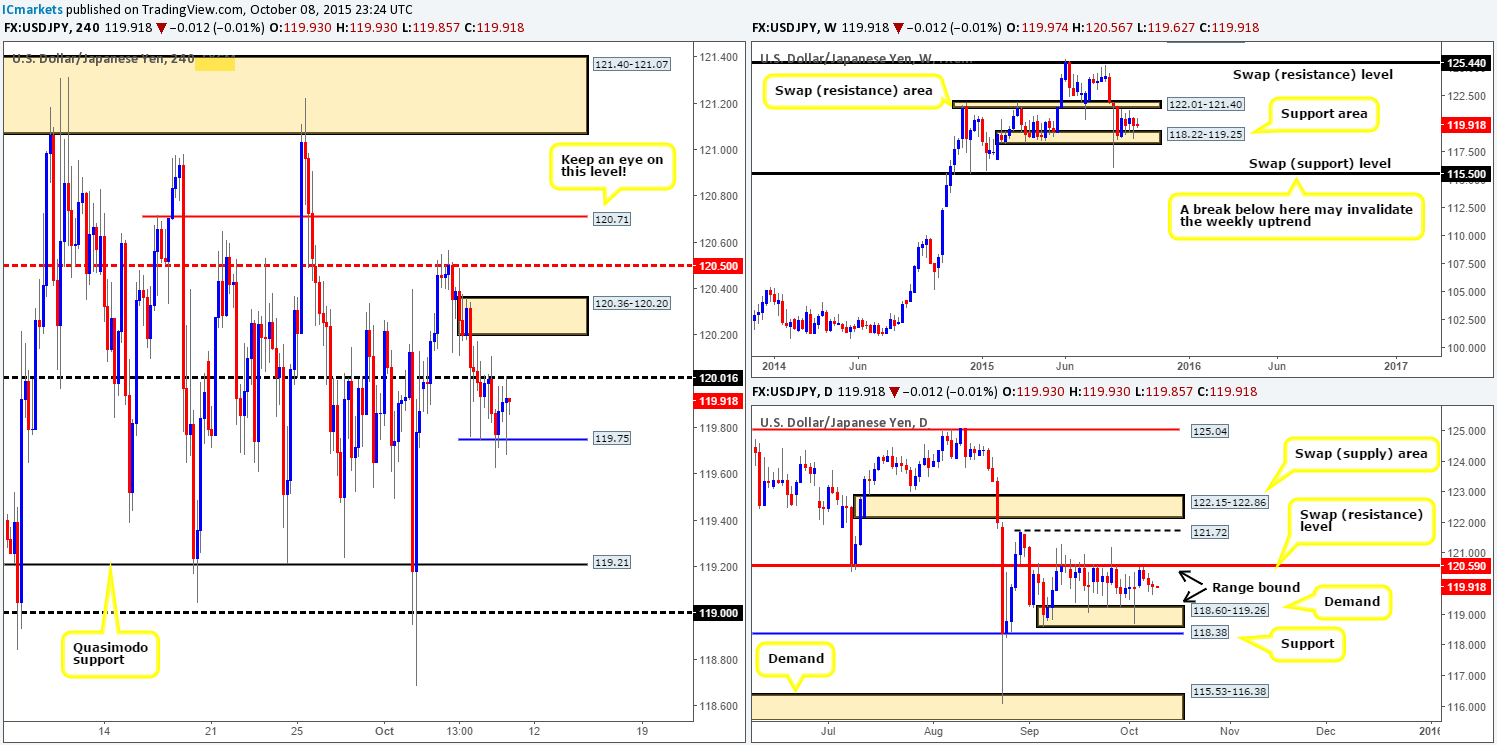
The USD/JPY pair, as you can see, continued to remain locked between psychological resistance 120.00 and minor support drawn from 119.75 during trade yesterday.
In regard to today’s trade, we have absolutely no interest in trading between this current range band. We do, however, have our eye on supply lurking just above it at 120.36-120.20 because of its sturdy-looking base and relatively aggressive sell-off. However, if you do consider this area as a viable trading base, do be prepared for the possibility that a fakeout higher may be seen here as this zone sits over twenty pips below 120.59 – the daily upper range limit. In addition to this, keep an eye on 120.50 as this beauty not only lines up nicely with the aforementioned daily upper range limit, but it also has already proved its worth back on the 06/10/15 at 120.56.
To the downside, the only area we currently have interest in right now is the 4hr Quasimodo support level at 119.21. This hurdle lines up perfectly with not only daily demand at 118.60-119.26 (lower range limit), but also with a weekly support area coming in at 118.22-119.25.
Levels to watch/ live orders:
- Buys: 119.21 [Tentative – confirmation required] (Stop loss: dependent on where one confirms this level).
- Sells: 120.36-120.20 [Tentative – confirmation required] (Stop loss: dependent on where one confirms this area) 120.50 [Tentative – confirmation required] (Stop loss: dependent on where one confirms this level).
USD/CAD:
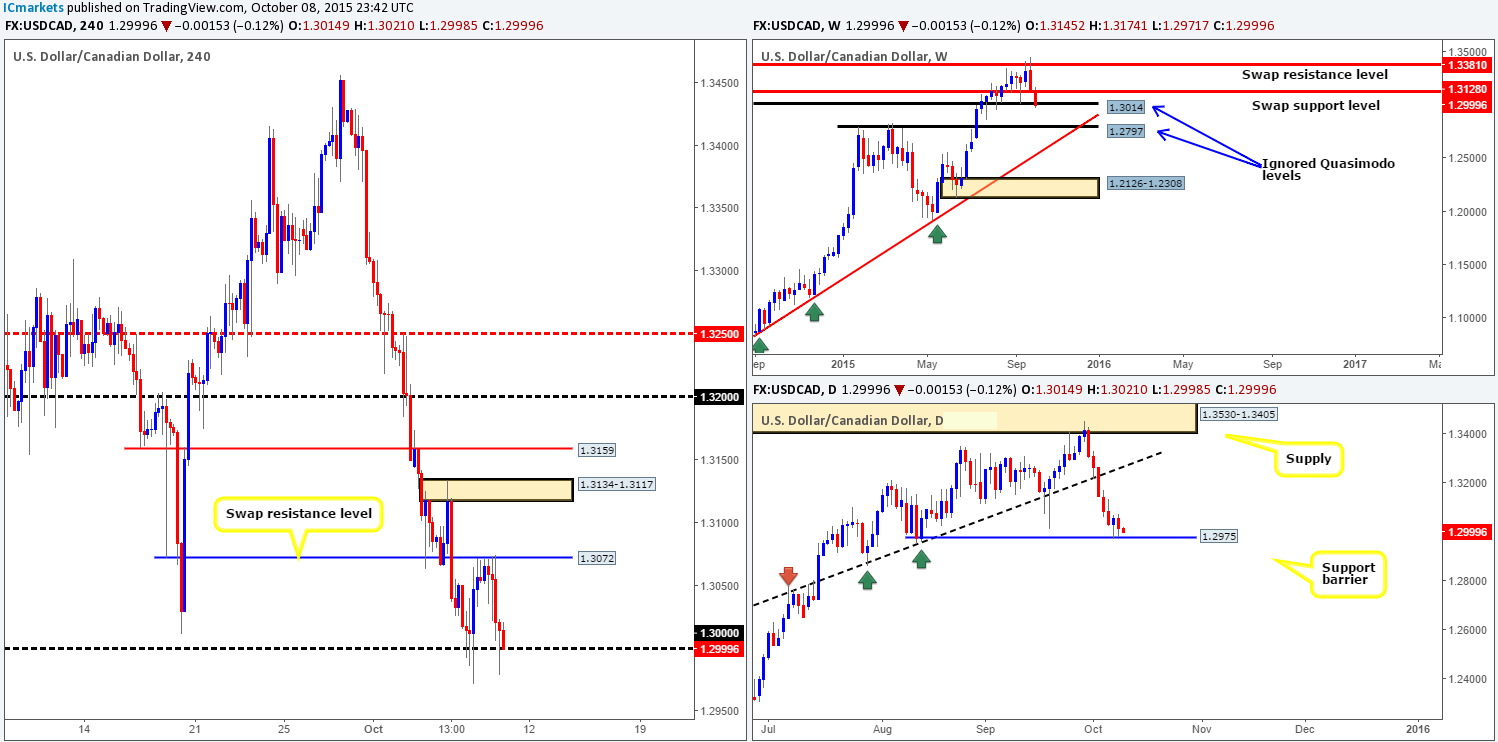
Using a top-down approach this morning, it’s clear to see the bulls are currently struggling to defend the ignored Quasimodo level at 1.3014 as price edged slightly lower recently. In spite of this, it might be worth waiting for the weekly candle to close shop before presuming that this weekly level is consumed. Rolling down to the daily timeframe, we can see that price is currently attempting to draw support from 1.2975.
Recent 4hr action saw a beautiful array of selling tails print at the underside of a swap resistance level coming in at 1.3072. This, as shown on the chart, sent the USD/CAD steaming into large psychological support 1.3000 going into yesterday’s American session.
Given the above, a certain harmony is being seen in this market right now. All three of our traded timeframes show price at supportive structures (see above). Therefore, today’s spotlight will be firmly focused on 1.3000 today for potential (confirmed) buy trades. In the event that we manage to spot an entry north from here, we’ll be eyeing 1.3072 as our immediate take-profit target.
Levels to watch/ live orders:
- Buys: 1.3000 [Tentative – confirmation required] (Stop loss: dependent on where one confirms this level).
- Sells: Flat (Stop loss: N/A).
USD/CHF:
The USD/CHF pair cascaded lower amidst yesterday’s sessions, engulfing both psychological support 0.9700 and demand at 0.9641-0.9666, ending with price coming within a nat’s hair of connecting with channel support (0.9686).
Overall, we see this pair continuing to trade lower today and possibly into early next week down to psychological support 0.9600. The reasons for why are as follows:
- The weekly timeframe shows price loitering at the underside of a swap resistance level coming in at 0.9796.
- Space to continue falling lower is being seen on the daily timeframe down towards a swap demand area at 0.9597-0.9502.
Therefore, should we see price rally back up into the jaws of 0.9700 today, this would be a level we may consider shorting from depending on the time of day (TOD) and how the lower timeframe action responds. Conversely, should price hit 0.9600 before 0.9700, we may, again subject to TOD, look for confirmed longs since at that point price would also be crossing swords with the aforementioned daily swap (demand) area. It will be interesting to see how this market plays out today.

Levels to watch/ live orders:
- Buys: 0.9600 [Tentative – confirmation required] (Stop loss: dependent on where one confirms this level).
- Sells: 0.9700 [Tentative – confirmation required] (Stop loss: dependent on where one confirms this level).
DOW 30:
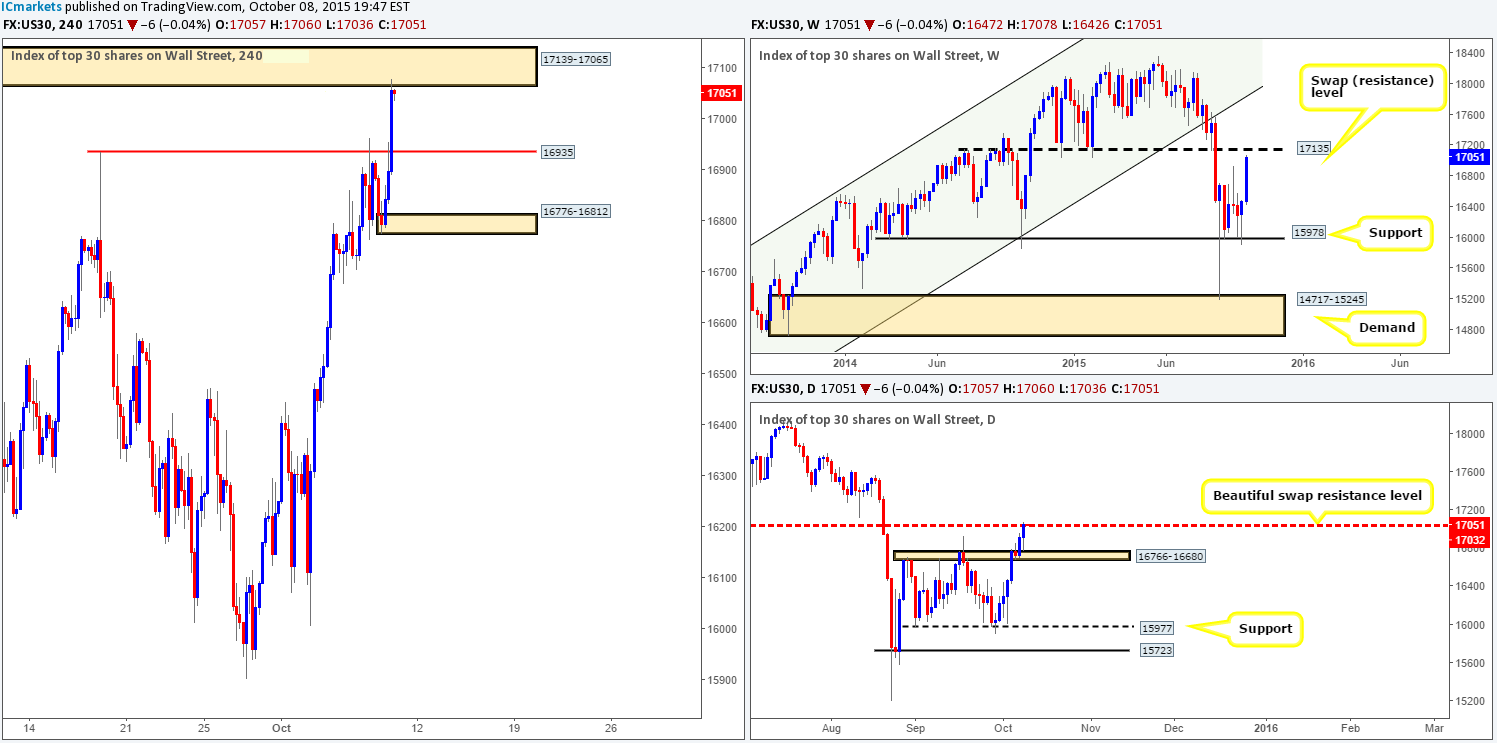
Starting with the weekly scale this morning, we can see that the DOW continued to drive higher, resulting in price now trading within shouting distance of a swap resistance level coming in at 17135. Consequent to this incessant buying lately, daily action has touched gloves with a nice-looking swap resistance level visible at 17032.
In addition to the above, 4hr candle action has also just recently collided with supply at 17139-17065, thus from the weekly down to the 4hr timeframe, this market is, in our book, trading within overall supply right now. Therefore, our objective today is relatively simple. Watch for lower timeframe selling confirmation within the current 4hr supply zone. Supposing we manage to spot an entry south here, the 16935 level (weekly high [14/09/15]) would be our first port of call in regards to taking profit.
The reason for us still requiring confirmation at the current 4hr supply zone simply comes down to the weekly level being lodged at the upper extreme of this area, thus indicating the possibility a fakeout may be seen above our 4hr sell zone. We’ve found it’s always best to trade on the side of caution when dealing with weekly barriers!
Levels to watch/ live orders:
- Buys: Flat (Stop loss: N/A).
- Sells: 17139-17065 [Tentative – confirmation required] (Stop loss: dependent on where one confirms this area).
XAU/USD: (Gold)
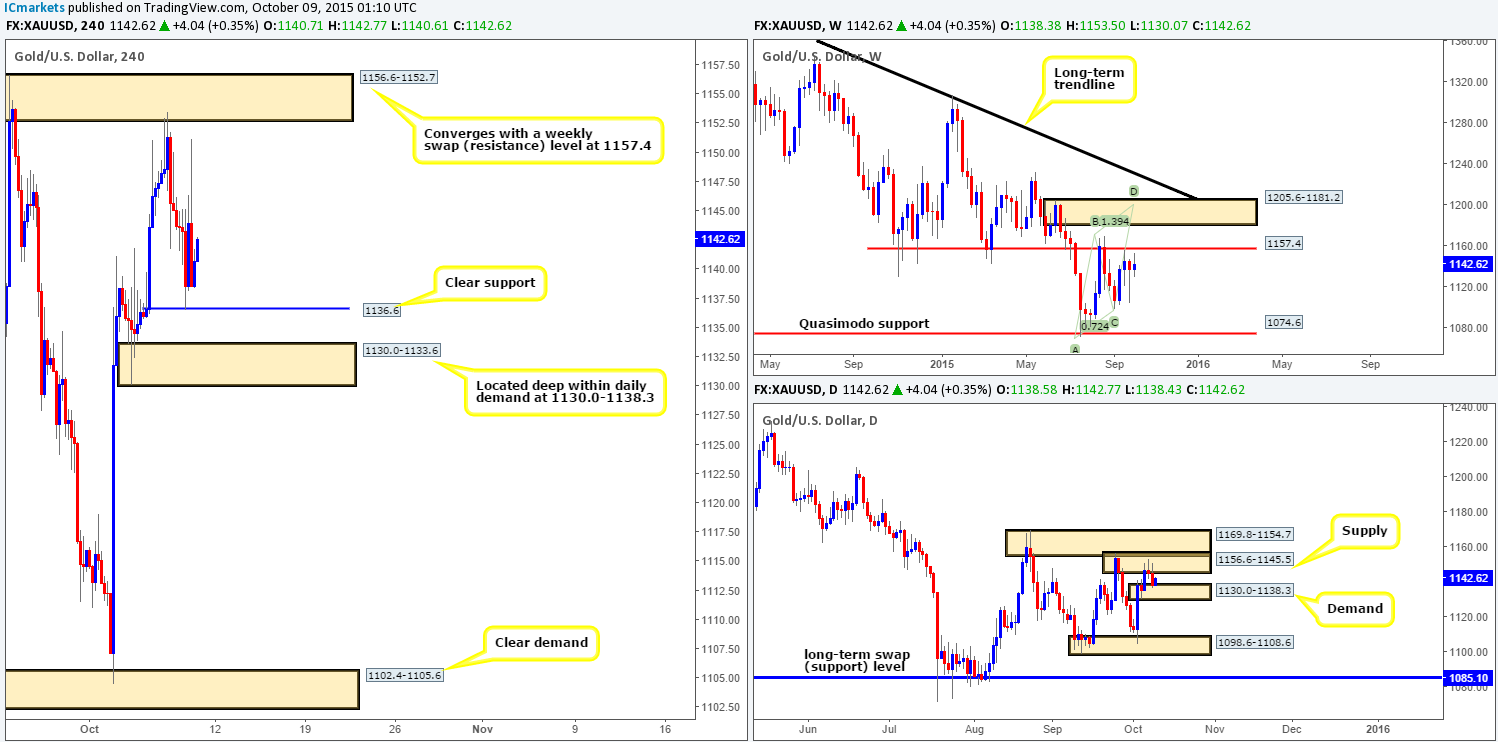
Overall, the weekly timeframe has seen little change over the past three weeks, as price continues to loiter just beneath a swap resistance level at 1157.4. Down on the daily timeframe, nonetheless, we can see that downside pressure from supply at 1156.6-1145.5 has pushed price into the jaws of a small near-term demand at 1130.0-1138.3.
Turning our attention to the 4hr timeframe, it’s clear that yesterday’s trade drew support from 1136.6, which, as you can see, enabled Gold to reach session highs of 1151.1 during the U.S. afternoon session.
Taking the above into account, this is what our team has logged so far:
- We have no interest in trading from 1136.6 today since bids have potentially been weakened here. What we are interested in, however, is the demand lurking below it at 1130.0-1133.6. Not only is it fresh, but it also sits deep within the aforementioned daily demand zone. To be safe, the first take-profit target from here would be set at the underside of current support, 1136.6.
- Above current price, there sits a supply at 1156.6-1152.7, which, as can be seen from the chart, converges with the weekly swap resistance level mentioned above at 1157.4. Seeing as price barely scratched the surface of this 4hr supply zone on Wednesday, we still believe there to be active orders deeper within this zone.
Levels to watch/ live orders:
- Buys: 1130.0-1133.6 [Tentative – confirmation required] (Stop loss: dependent on where one confirms this area).
- Sells: 1156.6-1152.7 [Tentative – confirmation required] (Stop loss: dependent on where one confirms this area).