A note on lower timeframe confirming price action…
Waiting for lower timeframe confirmation is our main tool to confirm strength within higher timeframe zones, and has really been the key to our trading success. It takes a little time to understand the subtle nuances, however, as each trade is never the same, but once you master the rhythm so to speak, you will be saved from countless unnecessary losing trades. The following is a list of what we look for:
-
A break/retest of supply or demand dependent on which way you’re trading.
-
A trendline break/retest.
-
Buying/selling tails – essentially we look for a cluster of very obvious spikes off of lower timeframe support and resistance levels within the higher timeframe zone.
-
Candlestick patterns. We tend to only stick with pin bars and engulfing bars as these have proven to be the most effective.
EUR/USD:
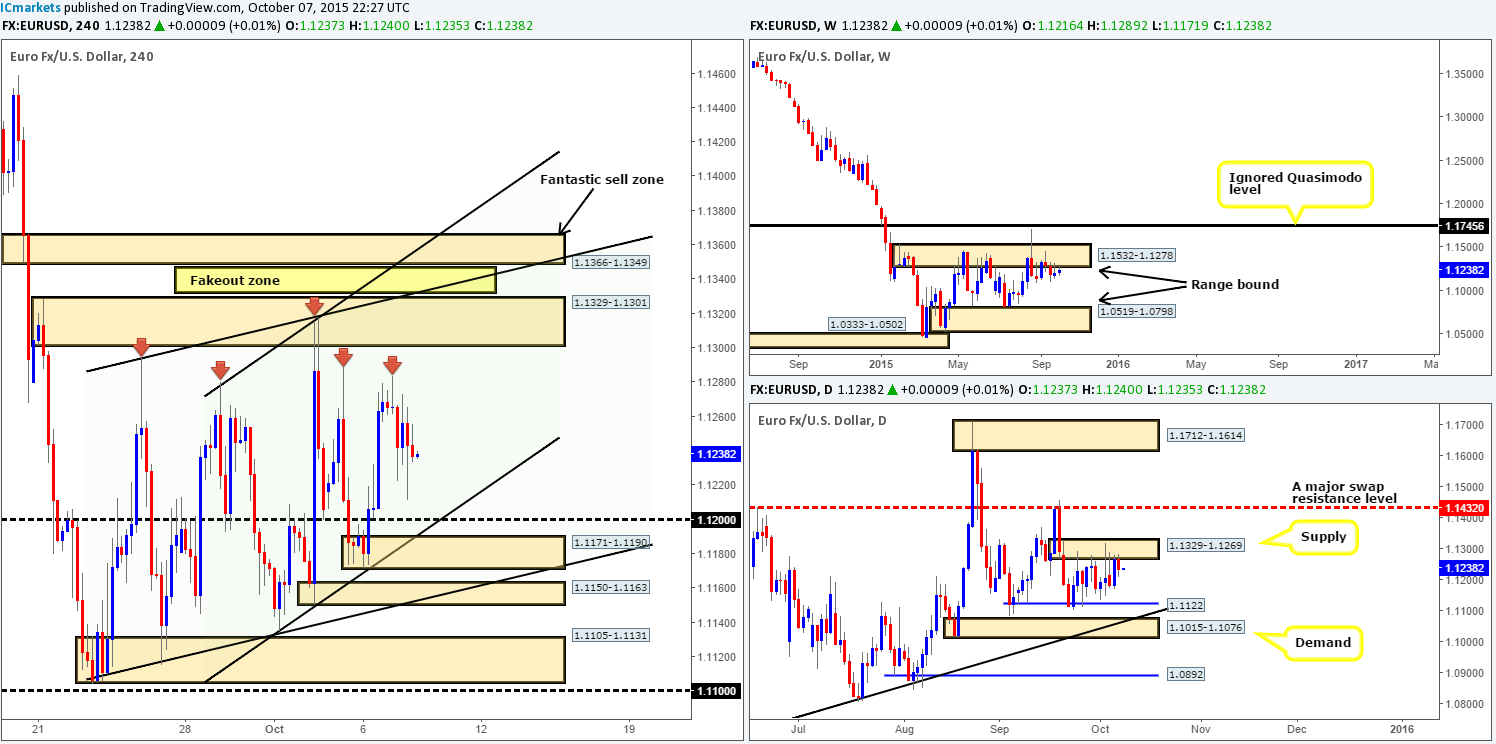
So, technically, there was not much action seen on the EUR pair during trade yesterday. Offers came in around the 1.1280 mark, reaching lows of 1.1211 on the day. As such, with price still lurking around supply on both the weekly and daily timeframes (1.1532-1.1278/1.1329-1.1269) at the moment, what’s likely in store for this market today?
Well, above current price we see a mine field of buy stops (liquidity) just begging to be taken out. The red arrows mark clear resistance points which the big boys, in our opinion, are looking to consume. We still have a pending sell order placed (1.13465) just below the next fresh supply zone above these stops at 1.1366-1.1349. However, before price reaches our sell zone, the EUR effectively needs to rally into the aforementioned higher timeframe supplies! With this, we’re taking a ‘wait and see’ approach today, as even though we’re hoping to see a strong rally, our team has no interest in buying. We’d rather let the market come to us!
Of course, if one cannot wait and wants to risk buying into higher timeframe supply, potential buy zones come in at the following areas:
-
Psychological support 1.1200 (converges with ascending channel support at [1.1134]).
-
Demand just below 1.1200 at 1.1171-1.1190 which may be used to fake 1.1200.
Levels to watch/live orders:
-
Buys: 1.1200 [Tentative – confirmation required] (Stop loss: dependent on where one confirms this level) 1.1171-1.1190 [Tentative – confirmation required] (Stop loss: dependent on where one confirms this area).
-
Sells: 1.13465 (Stop loss: 1.13717).
GBP/USD:
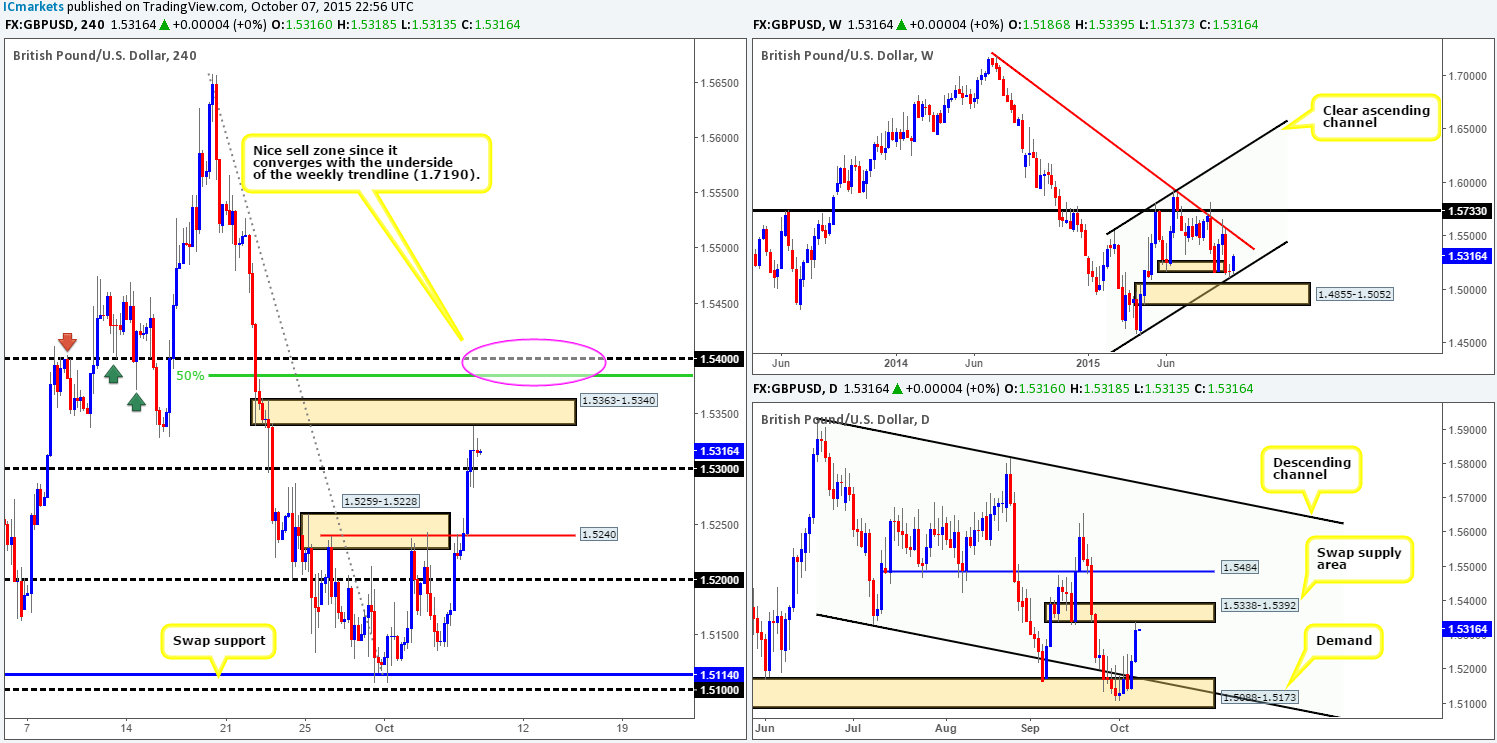
Absolutely beautiful! For anyone who read our previous report on Cable (http://www.icmarkets.com/blog/wednesday-7th-october-daily-technical-outlook-and-review/), you may recall us mentioning to watch for a break and (confirmed) retest of 1.5240 yesterday, which, as you can see, played out perfectly! Following the retest, an aggressive round of bids came into the market, pushing price above psychological resistance 1.5300 and into the underside of supply seen at 1.5363-1.5340. Well done to any of our readers who took advantage of this move!
Consequent to the above, price is also now trading at the underside of a daily swap (supply) area at 1.5338-1.5392. Alongside this, however, we mustn’t forget that the weekly timeframe shows trade has recently rebounded from channel support (1.4564) and, as far as we see, still has room to appreciate up to trendline resistance drawn from the high 1.7190.
Therefore, here is two pips’ worth on what we may see from this market today… Given the weekly timeframe indicating further upside is possible; shorts from the current 4hr supply can still be taken, but only for an intraday bounce back down to 1.5300 just to be safe! Ultimately though, we have our eye on the psychological resistance above at 1.5400 for a heavier sell-off. The reasons for why are as follows:
-
Swap level history at 1.5400.
-
50% Fibonacci level at 1.5385.
-
Converges with the aforementioned weekly trendline.
-
Positioned just a few pips above the daily swap (supply) area mentioned above at 1.5338-1.5392.
Levels to watch/ live orders:
-
Buys: Flat (Stop loss: N/A).
-
Sells: 1.5363-1.5340 [Tentative – confirmation required] (Stop loss: dependent on where one confirms this area) 1.5400 [Tentative – confirmation required] (Stop loss: dependent on where one confirms this level).
AUD/USD:
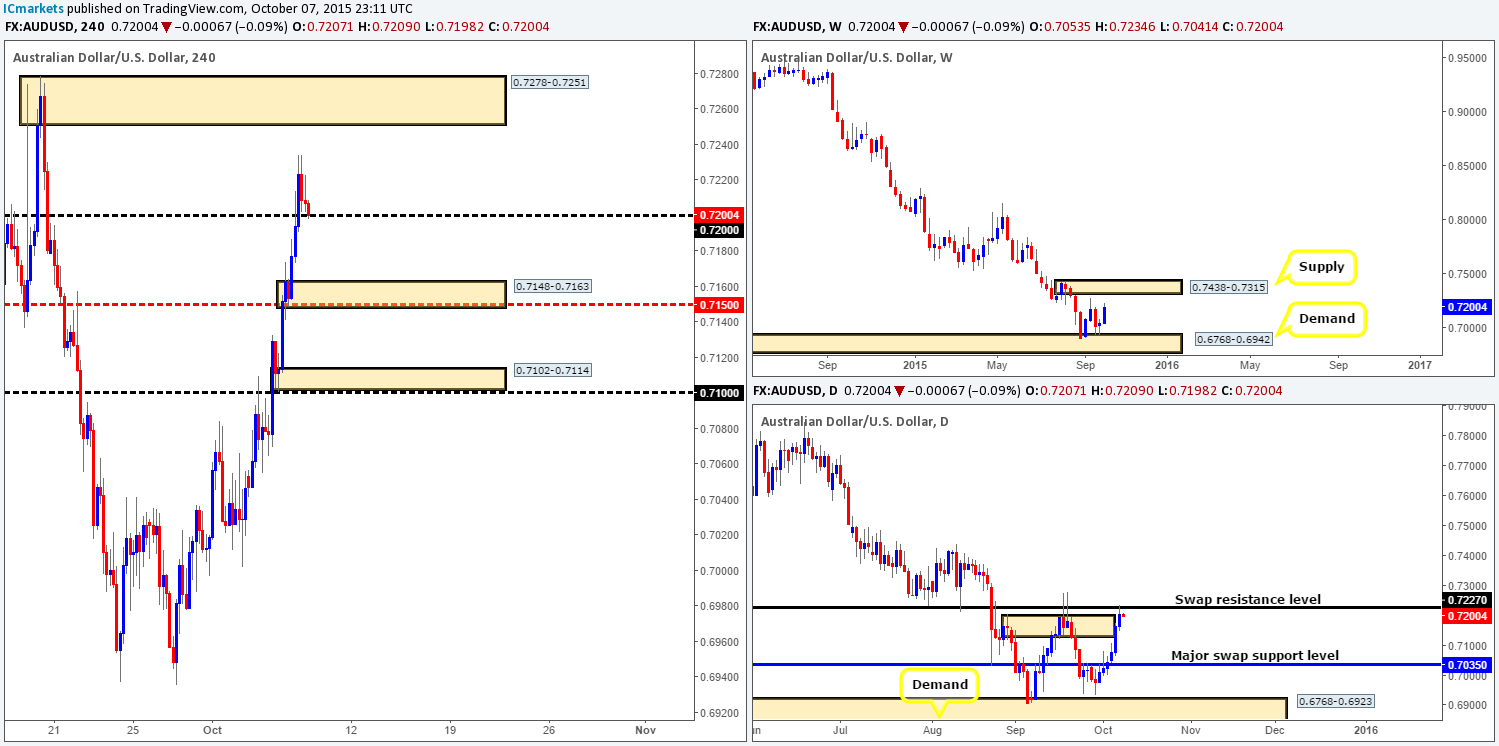
Kicking off our analysis this morning with a look at the weekly timeframe shows that price continues to advance following the recent rebound from demand coming in at 0.6768-0.6942. Realistically, the next upside target from here falls in at 0.7438-0.7315 – a supply zone. Dropping down to the daily timeframe reveals that supply at 0.7204-0.7119 has been pierced once again, resulting in candle action connecting with the swap resistance level seen just above it at 0.7227.
Turning our attention to the 4hr scale, we can see that price recently broke above psychological resistance 0.7200 and is, at the time of writing, now being retested as support. Given where this market is trading on the bigger picture (see above) at the moment, 0.7200 will likely play a key role in our decision-making process today. Here’s why:
-
Should 0.7200 be respected as support today, a long could be possible up to supply at 0.7278-0.7251. Yes, this would entail buying into the aforementioned daily swap (resistance) level, but seeing as there’s space still on the weekly chart to appreciate, we still believe it to be a legit buy. Should this come to fruition, we’d exit all longs at the above said supply and look to short since this area is within shouting distance of the above said weekly supply zone.
-
On the other hand, if 0.7200 is taken out, this would, in our opinion, do two things. One, confirm strength from the daily swap (resistance) level, and two, potentially provide a sell opportunity should price retest 0.7200 as resistance. In the event that this comes to fruition, we’d be eyeing demand at 0.7148-0.7163 as our immediate take-profit area.
Levels to watch/ live orders:
-
Buys: 0.7200 [Tentative – confirmation required] (Stop loss: dependent on where one confirms this level).
-
Sells: Watch for bids at 0.7200 to be consumed and then look to enter on any retest seen at this number (confirmation required) 0.7278-0.7251 [Tentative – confirmation required] (Stop loss: dependent on where one confirms this area).
USD/JPY:
As we reported to watch for in our previous analysis (http://www.icmarkets.com/blog/wednesday-7th-october-daily-technical-outlook-and-review/), the USD/JPY pair broke below both channel resistance-turned support (121.31 –erased form the chart now) and demand seen at 119.85-119.99.
In all honesty, with both the weekly and daily timeframes trading mid-range right now (122.01-121.40/118.22-119.25 – 120.59/118.60-119.26), this pair has become quite a difficult market to read. As such, our team has come to a general consensus that trading only areas which boast higher timeframe confluence is the way to proceed for the time being. To that end, here is what we have our eye on at the moment:
Buys:
-
The 4hr Quasimodo support level at 119.21. This barrier lines up perfectly with not only daily demand at 118.60-119.26 (lower range limit), but also with a weekly support area at 118.22-119.25.
Sells:
-
Recently formed 4hr supply at 120.36-120.20. The reason for choosing this area is simply because of its sturdy-looking base and relatively aggressive sell-off. However, if you do consider this area as a viable trading base, do be prepared for the possibility that a fakeout higher may be seen here as this zone sits over twenty pips below 120.59 – the daily upper range limit.
-
Although 120.50 has already seen action, we’d still consider this a valid level since it ties in beautifully with the upper limit of the daily range, 120.59.
-
120.71. This level is practically a hidden left shoulder. Since these levels usually see a bounce and considering the fact that it sits just above the daily 120.59 level, we think it deserves its place on this list.

Levels to watch/ live orders:
-
Buys: 119.21 [Tentative – confirmation required] (Stop loss: dependent on where one confirms this level).
-
Sells: 120.36-120.20 [Tentative – confirmation required] (Stop loss: dependent on where one confirms this area) 120.50 [Tentative – confirmation required] (Stop loss: dependent on where one confirms this level) 120.71 [Tentative – confirmation required] (Stop loss: dependent on where one confirms this level).
USD/CAD:
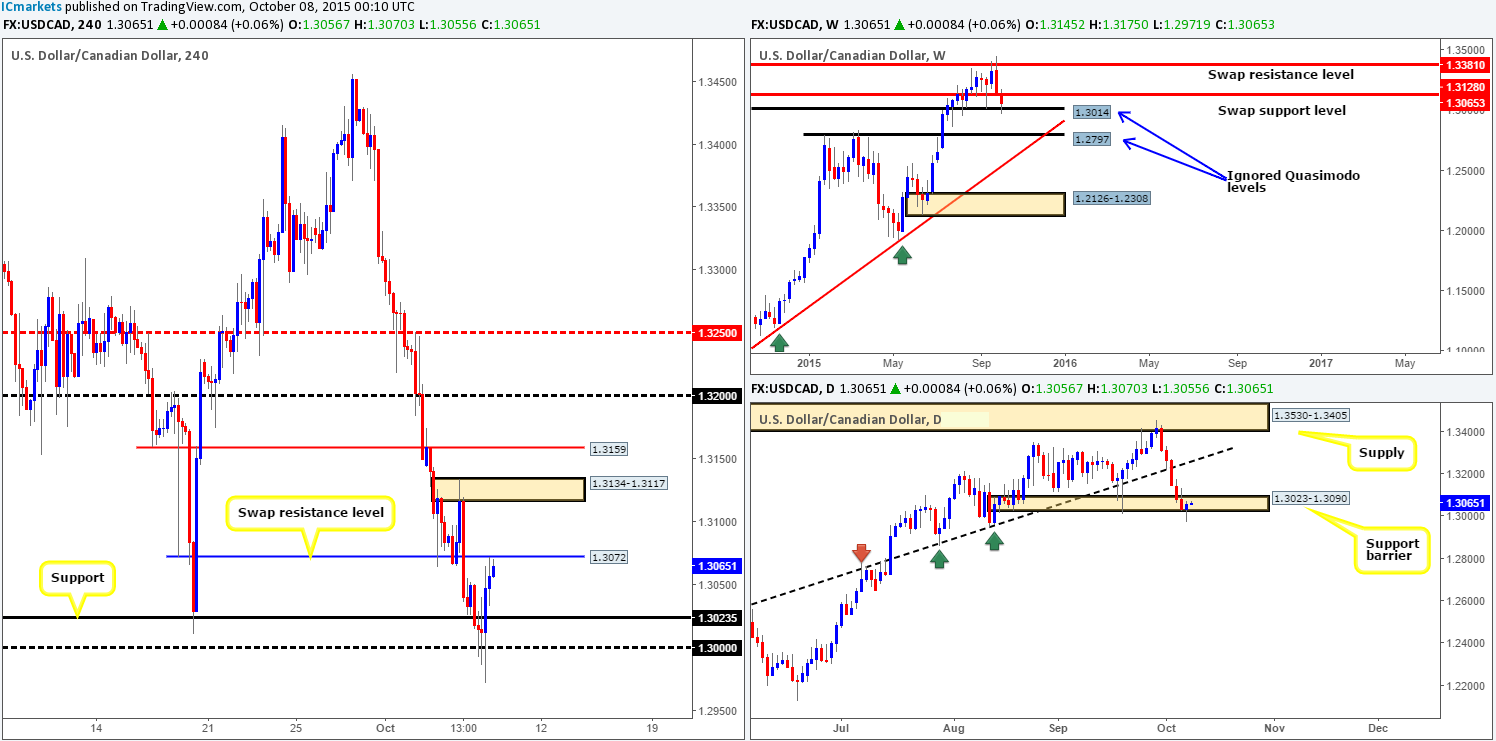
Yesterday’s 4hr action shows that price broke below key support at 1.3023 and connected with the large psychological support 1.3000, before advancing towards 1.3072 – a swap resistance level.
In regard to price trading at a particularly interesting resistance at the moment, where does our team stand on the bigger picture? Over on the weekly, we can see that the ignored Quasimodo support barrier has so far held nicely, whilst down on the daily chart, price stabbed below a support area at 1.3023-1.3090 and closed positively for the day at 1.3056.
On account of the above, our team has little interest in shorting the aforementioned 4hr swap (resistance) level today. Rather, we’re going to be looking for a close above and retest of this hurdle as support. Should this come to fruition and lower timeframe buyers are seen coming into the market, we’d have little hesitation in taking a long here, targeting 1.3134-1.3117. In the event price blows through this area, we’ll then be eyeing the ignored Quasimodo level sitting at 1.3159 to liquidate our full position.
Levels to watch/ live orders:
-
Buys: Watch for offers at 1.3072 to be consumed and then look to enter on any retest seen at this number (confirmation required).
-
Sells: Flat (Stop loss: N/A).
USD/CHF:
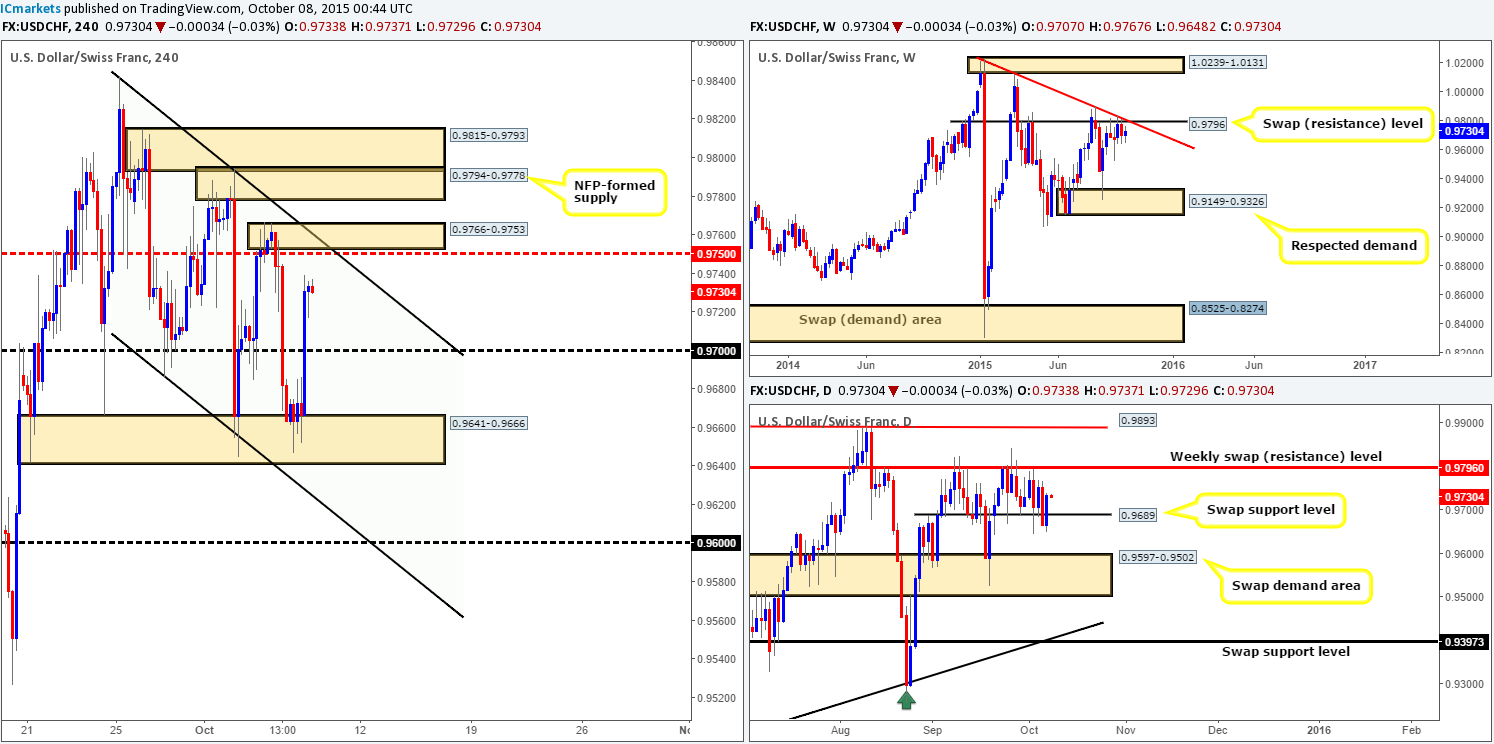
Using a top-down approach this morning, the weekly timeframe shows price loitering at the underside of a swap resistance level coming in at 0.9796. Meanwhile, down on the daily timeframe, we can see price bounced back above 0.9689 yesterday indicating Tuesday’s close lower was simply the beginnings of a fakeout. Looking at the 4hr timeframe, however, reveals that price rebounded nicely from demand drawn from 0.9641-0.9666 during trade yesterday, breaking above psychological resistance 0.9700 and reaching highs of 0.9739 on the day.
Given the location of current price on the 4hr timeframe at the moment, we really like the look of the supply area seen just above it at 0.9766-0.9753. It not only has mid-level resistance convergence at 0.9750, but also coincides nicely with channel resistance (0.9842). Unfortunately, we feel this area of supply may only be good for a small intraday bounce since the bigger players likely have their eye on the NFP-formed supply at 0.9794-0.9778, which ties in with the aforementioned weekly swap (resistance) level.
Both of the above said areas will, at least for us, require lower timeframe confirmation before risking capital on a trade to avoid any fakeouts that may take place.
Levels to watch/ live orders:
-
Buys: Flat (Stop loss: N/A).
-
Sells: 0.9766-0.9753 [Tentative – confirmation required] (Stop loss: dependent on where one confirms this area) 0.9794-0.9778 [Tentative – confirmation required] (Stop loss: dependent on where one confirms this area).
DOW 30:
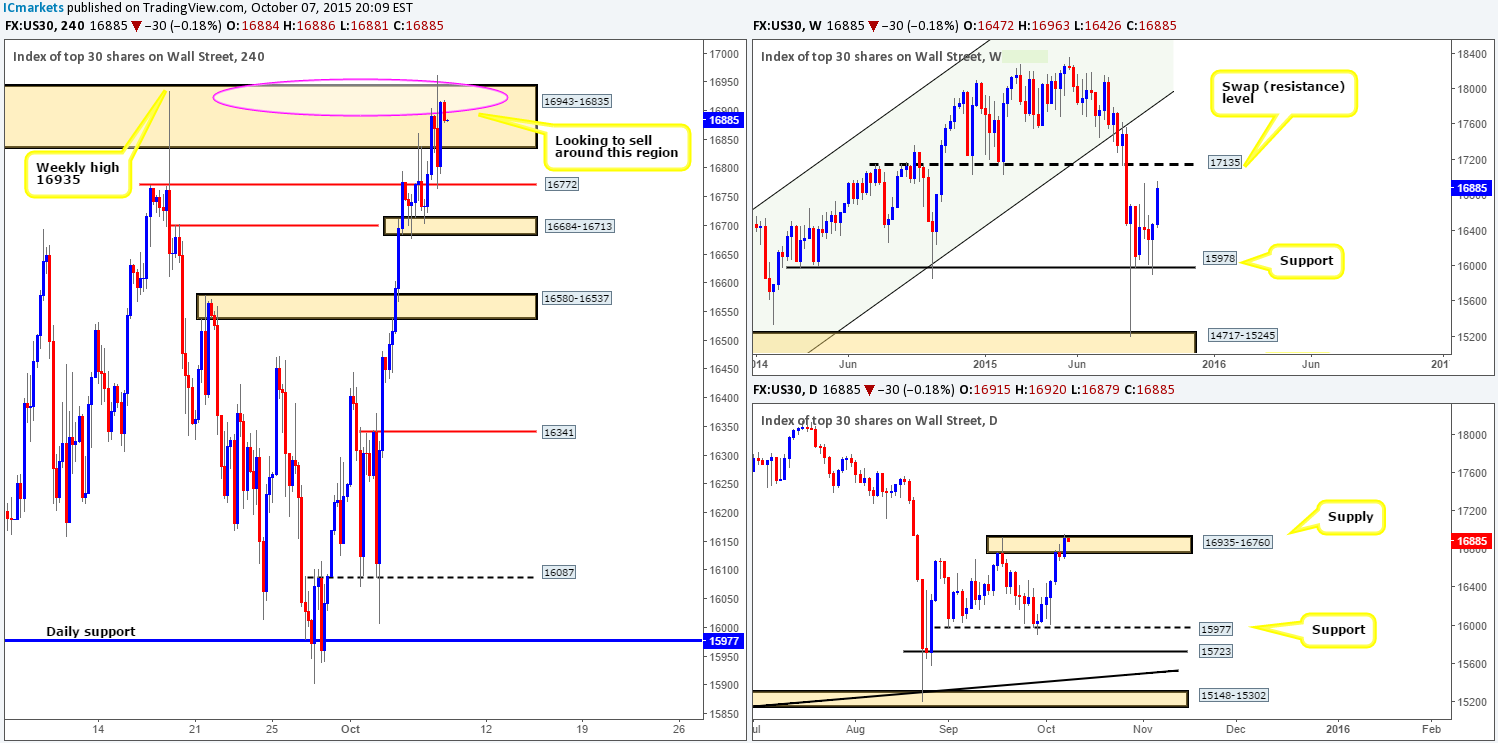
Early on in yesterday’s sessions price extended north, bringing the DOW not only higher into supply at 16943-16835, but also connecting with the weekly high at 16935, which combined still remains our chosen area to sell this market from. A drop from this zone has already been seen, but was, as shown on the chart, quickly counteracted by support at 16772.
Nevertheless, at the time of writing, we can see price once again testing the limits of our sell zone. Should lower timeframe selling confirmation be seen here this time, we’ll have no hesitation in shorting this market down to 16772, followed closely by demand at 16684-16713.
The reason for requiring confirmation here is as follows:
-
Daily supply at 16935-16760 was slightly breached during trade yesterday.
-
Other than the weekly high mentioned above at 16935, there is little stopping weekly buyers from pushing this market up to the swap resistance level at 17135.
Levels to watch/ live orders:
-
Buys: Flat (Stop loss: N/A).
-
Sells: 16943-16835, preferably near the weekly high16935 [Tentative – confirmation required] (Stop loss: dependent on where one confirms this area).
XAU/USD: (Gold)
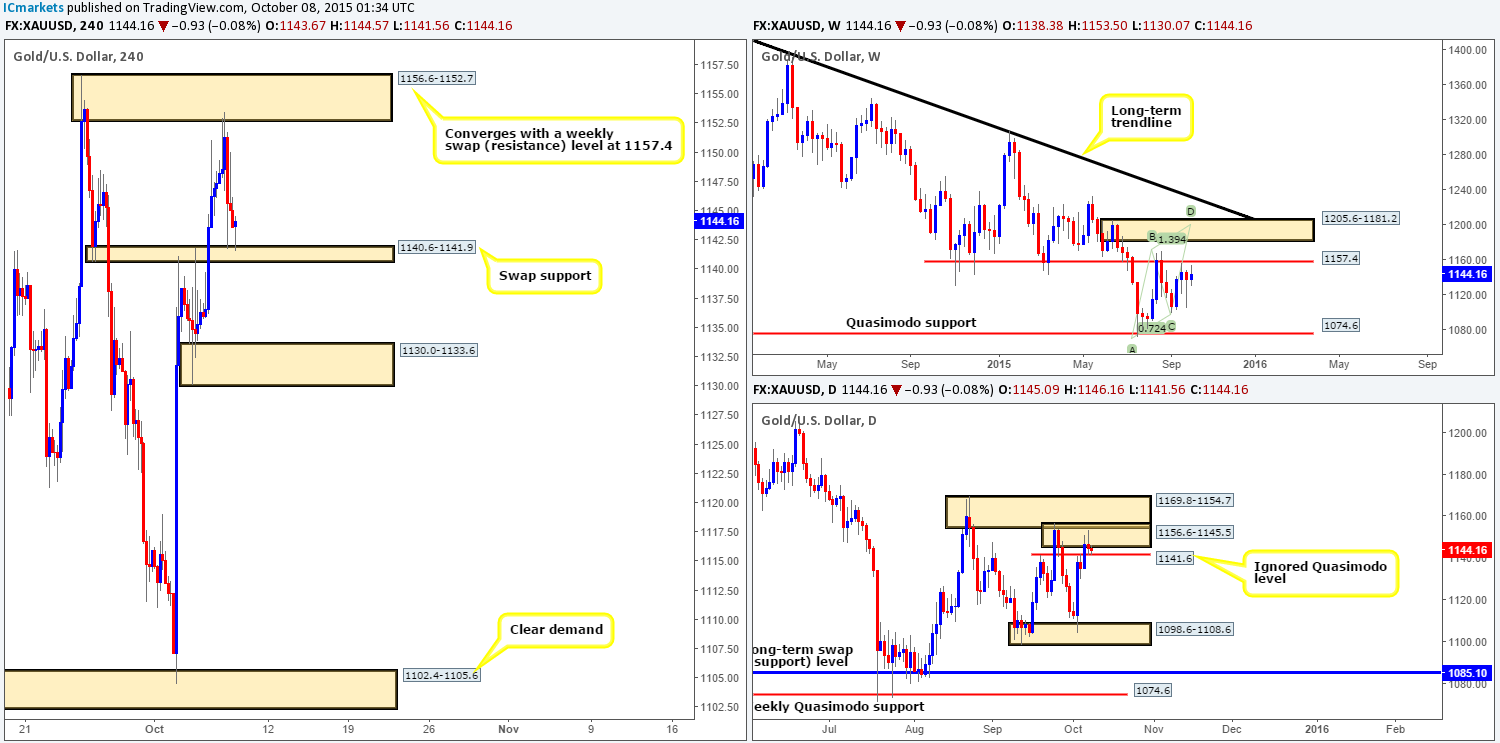
As can be seen from the 4hr chart, price reacted perfectly to supply drawn from 1156.6-1152.7, which, as you can probably see, converges with not only the weekly swap (resistance) level at 1157.4, but also daily supply at 1156.6-1145.5. We have to admit, we did not even see this 4hr supply zone as we were too focused on the high1156.6! Too bad! Price was sent tumbling lower from here down to a swap support area at 1140.6-1141.9. Should Gold re-visit this supply zone today, nonetheless, and produce a lower timeframe sell signal, we’d confidently take a short in this market!
However, seeing as price is now trading at a support area on the 4hr timeframe, and holding firm around an ignored daily Quasimodo level at 1141.6, an intraday buy from 4hr support is also a possibility today if lower timeframe confirmation (30/60 min) is seen. The reason for requiring confirmation and only expecting an intraday bounce from here is due to the following:
-
Seeing Gold loitering below a weekly swap resistance level mentioned above at 1157.4.
-
Selling pressure from daily supply at 1156.6-1145.5.
Levels to watch/ live orders:
-
Buys: 1140.6-1141.9 [Tentative – confirmation required] (Stop loss: dependent on where one confirms this area).
-
Sells: 1156.6-1152.7 [Tentative – confirmation required] (Stop loss: dependent on where one confirms this area).