
Key risk events today:
RBA Monetary Policy Statement; ECB President Lagarde Speaks; Canada Employment Change and Unemployment Rate; US Average Hourly Earnings m/m, Non-Farm Employment Change and Unemployment Rate.
(Previous analysis as well as outside sources – italics).
EUR/USD:
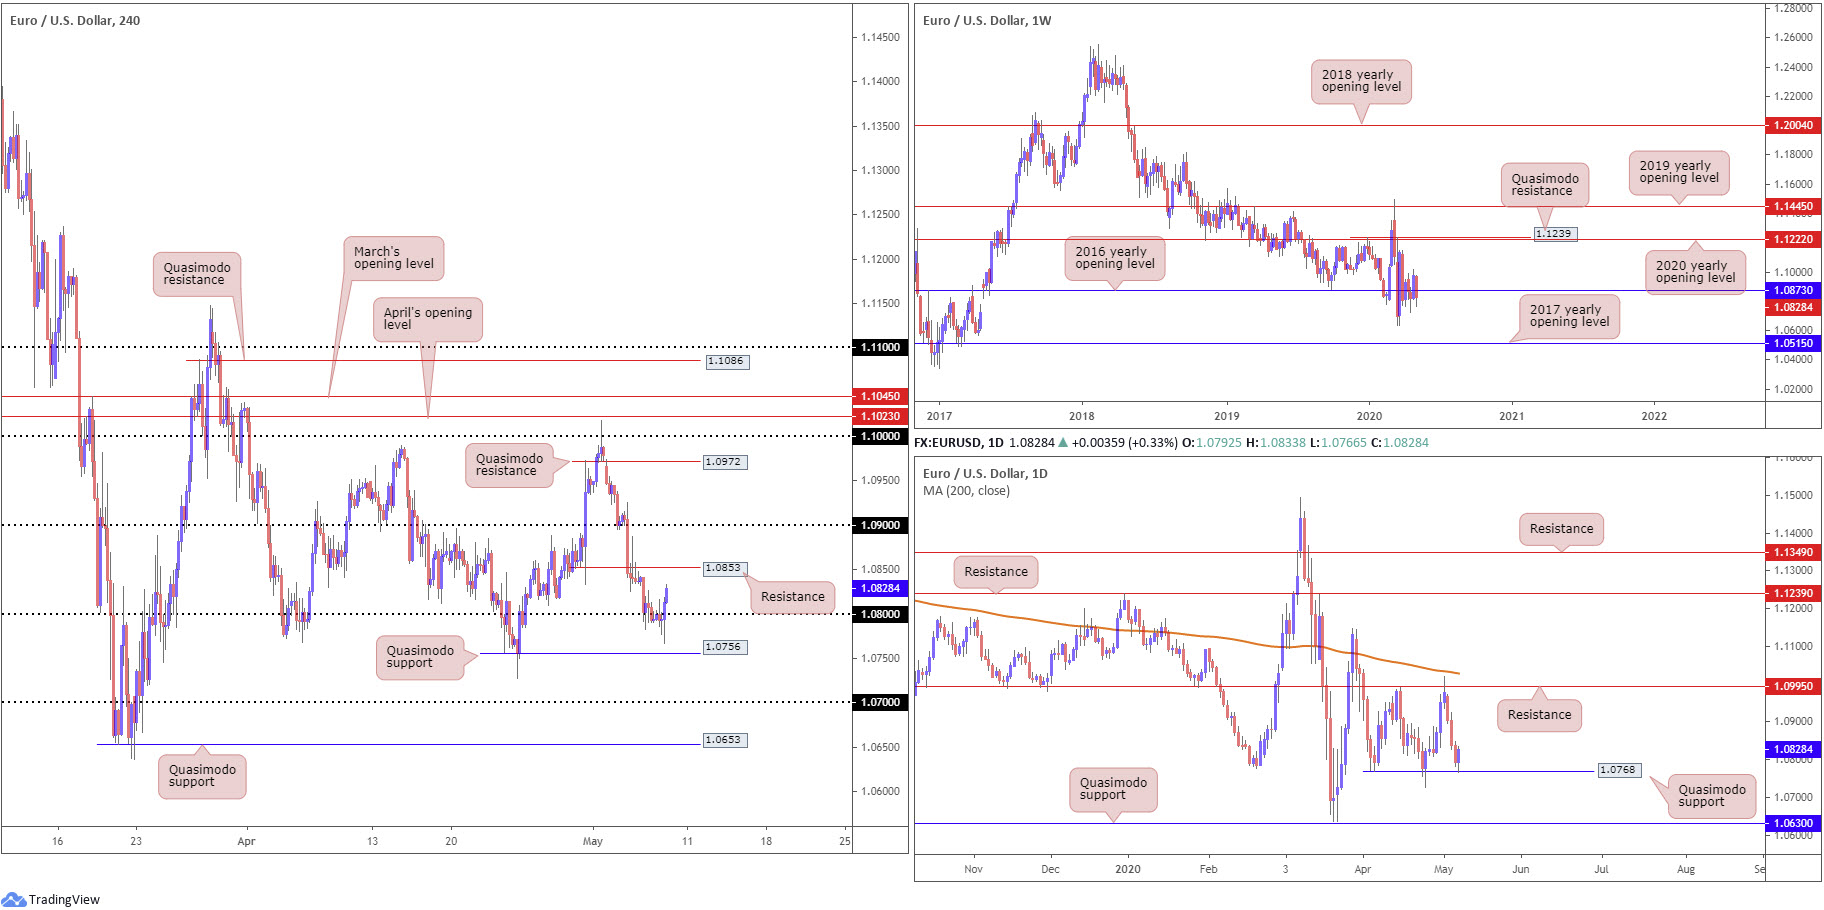
Sell-stops south of 1.08 were tripped in recent trading, with H4 action regaining a strong footing north of the said round number. What’s also interesting from a technical perspective is daily price connected with a Quasimodo formation at 1.0768.
Buying from 1.0768 was not only fuelled by interested parties off the said base, but also due to sell-stop liquidity under 1.08.
Analysis on the weekly timeframe has price trading around its 2016 yearly opening level at 1.0873. This has been a level of interest on the weekly chart since April. A nudge lower could see multi-year lows enter sight at 1.0635, while firming may eventually witness the 2020 yearly opening level at 1.1222 elbow its way into the limelight.
Areas of consideration:
Those who entered long off daily Quasimodo support at 1.0768 will likely view H4 resistance at 1.0853 as a breakeven trigger. A break of 1.0853 may target 1.09, serving as an ideal take-profit target.
GBP/USD:
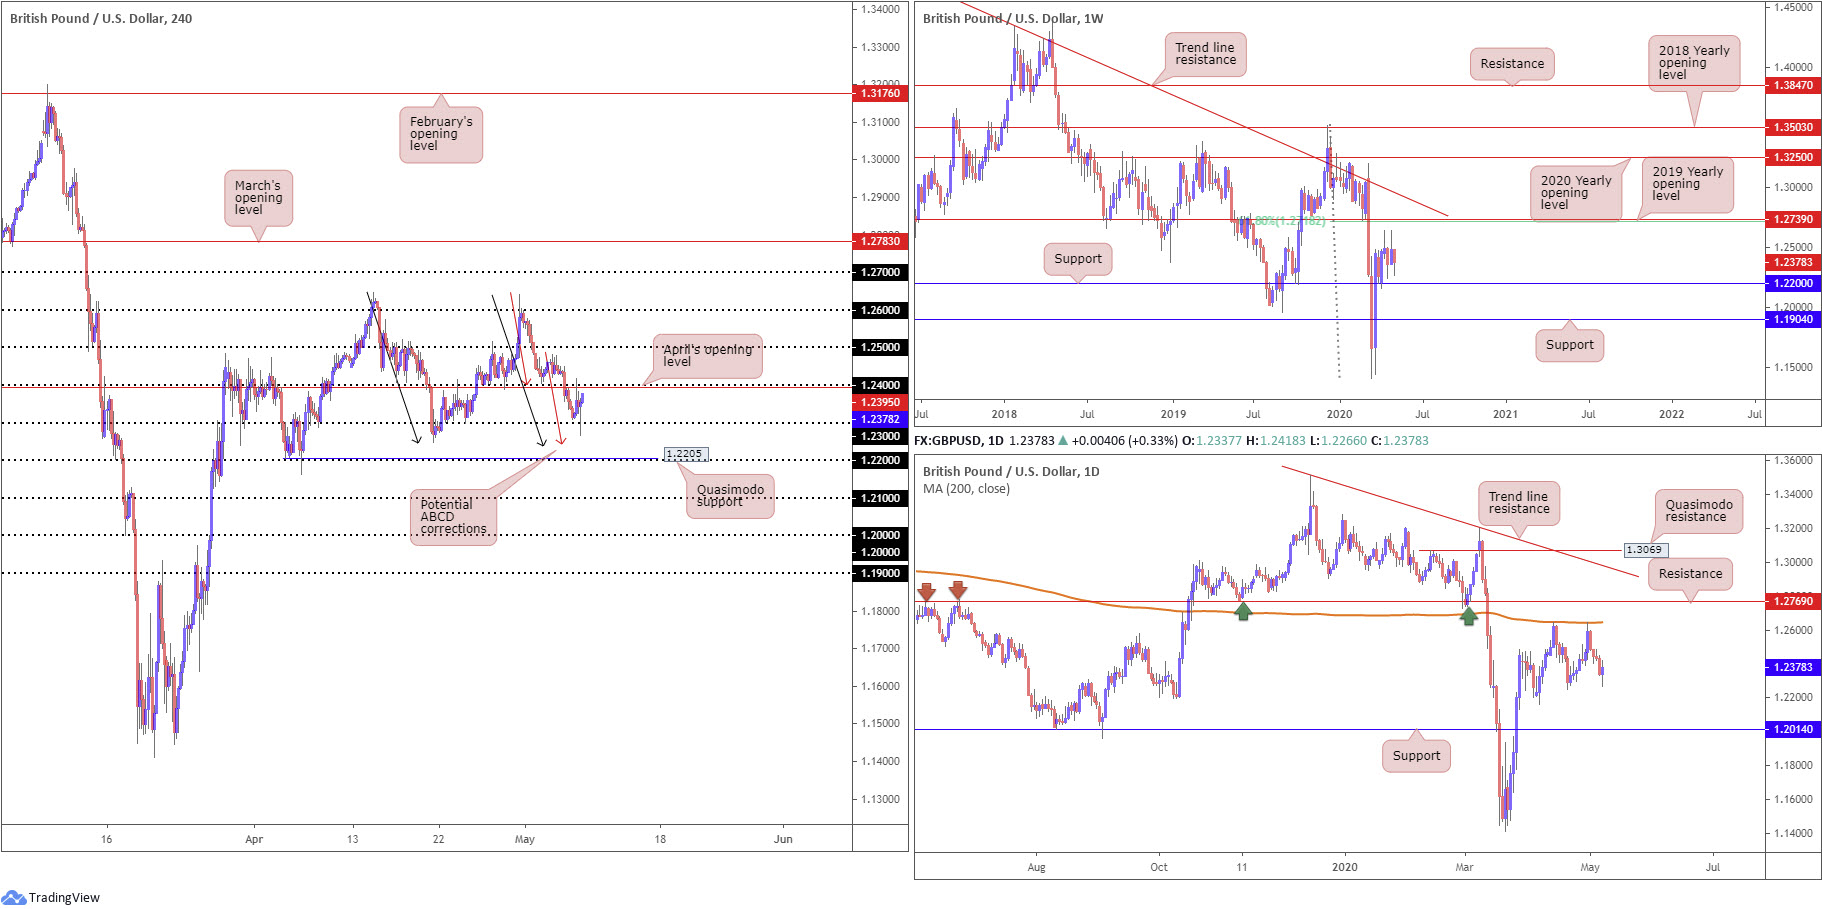
Sterling witnessed a temporary relief rally on Thursday following the Bank of England standing pat on rates and opting against any increase in QE. Early moves saw H4 price run through orders at the 1.24 handle and April’s opening level at 1.2395, before sinking to 1.23. Despite ranging between the said psychological levels, the pair eked out only modest gains into the close.
Beneath 1.23, as aired in Thursday’s technical briefing, we can see a potential ABCD correction (red arrows) point at 1.2240, a Quasimodo support at 1.2205 and the 1.22 handle. In addition, traders may also note another (larger) potential ABCD correction point (black arrows) also at 1.2240.
From the weekly timeframe, support at 1.2200 remains a pivotal base, holding price action higher since the beginning of April. Scope to explore higher ground is also visible until reaching the 2019 yearly opening level at 1.2739, which aligns closely with a 61.8% Fibonacci retracement ratio at 1.2718. A break of the aforementioned levels reveals a long-standing trend line resistance, taken from the high 1.5930. Additionally, we see the pair pulling back from historic lows at 1.1409, therefore sellers could eventually make a run for fresh lows. Note the primary trend remains facing south in this market.
The 200-day SMA (orange – 1.2646) remains a dominant fixture on the daily timeframe, providing resistance on two occasions in April. Support is expected to form off the 1.2247 April 21 low. A break of this level, though, could confirm a possible double-top pattern from peaks around 1.2639.
Areas of consideration:
Higher-timeframe price movement suggests we could see 1.23 cede ground. While 1.2247 may offer possible support, 1.22 is likely to act as a downside target for any sellers, having seen it converge not only with a number of H4 structures, but also weekly support as well.
Breakout selling sub 1.23 is, therefore, an option. Hitting 1.22ish will likely entice an unwinding of short positions, followed by a recovery.
AUD/USD:
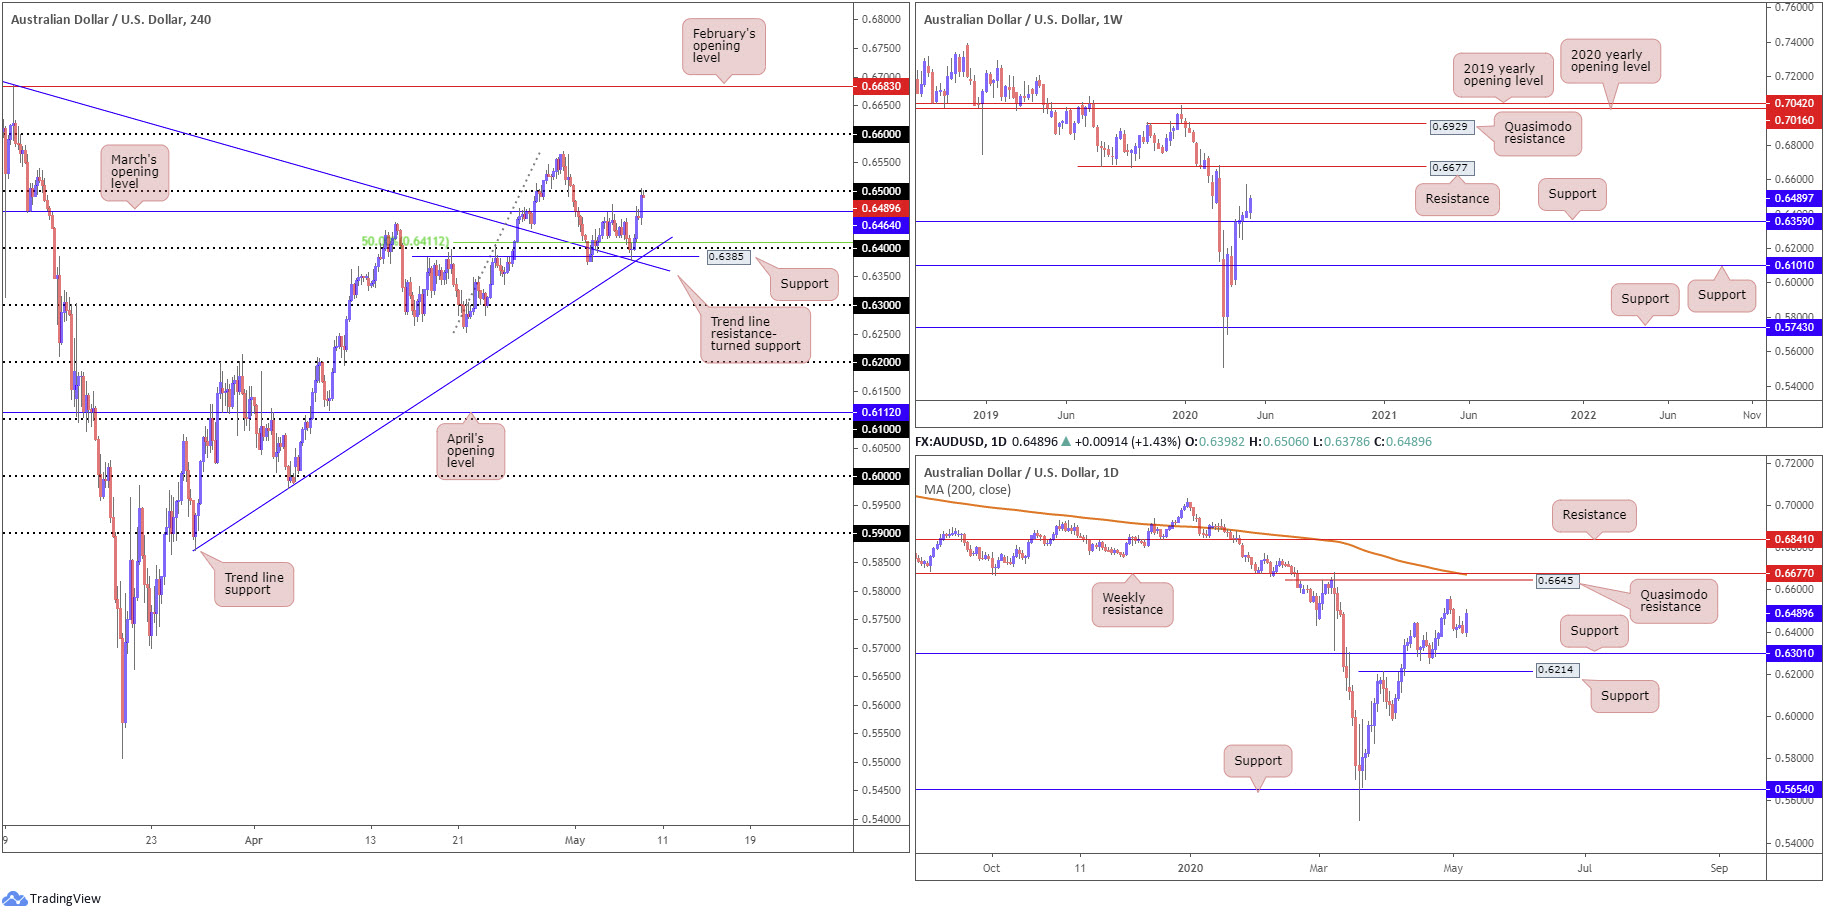
The Australian dollar outperformed against the buck Thursday, latching onto a strong bid off 0.64.
For traders who read Thursday’s technical briefing you may recall the following (italics):
0.64 comes together with a notable trend line resistance-turned support, taken from the high 0.7031, a Quasimodo resistance-turned support at 0.6385, a 50.0% retracement value at 0.6411 and another trend line support (etched from the low 0.5870).
Today’s technical spotlight is focused on 0.64 as potential support, having noted the H4 confluence surrounding the psychological level. Traders are also urged to pencil in the possibility of a fakeout through 0.64 to bring in the noted H4 trend line supports before turning higher. Upside targets from 0.64, nonetheless, remain at 0.6464, closely shadowed by 0.65.
As can be seen from the H4 chart, we did indeed fake through 0.64 to draw in the said H4 structures before turning higher. Price toppled 0.6464 and crossed swords with 0.65 in recent hours. Well done to any readers who managed to catch this move.
Going forward, the technical story on the weekly timeframe has price making headway above support at 0.6359, despite last week’s shooting star candlestick configuration. Although last week’s candlestick signal is a mark of seller intent, price is finding difficulty attracting sellers due to noted support. With that being the case, pencilling in resistance at 0.6677 may be an idea.
From the daily timeframe, 0.6301 rests as support. With respect to resistance, aside from the April 30 high at 0.6569, a Quasimodo formation at 0.6645 is in sight, parked just ahead of the weekly resistance level mentioned above at 0.6677 and the 200-day SMA (orange – 0.6673).
Areas of consideration:
Owing to the market’s position on the bigger picture, traders are likely betting on further growth above 0.65 today. This would fuel breakout buying towards at least 0.6569, with a violation likely drawing price towards 0.66.
USD/JPY:
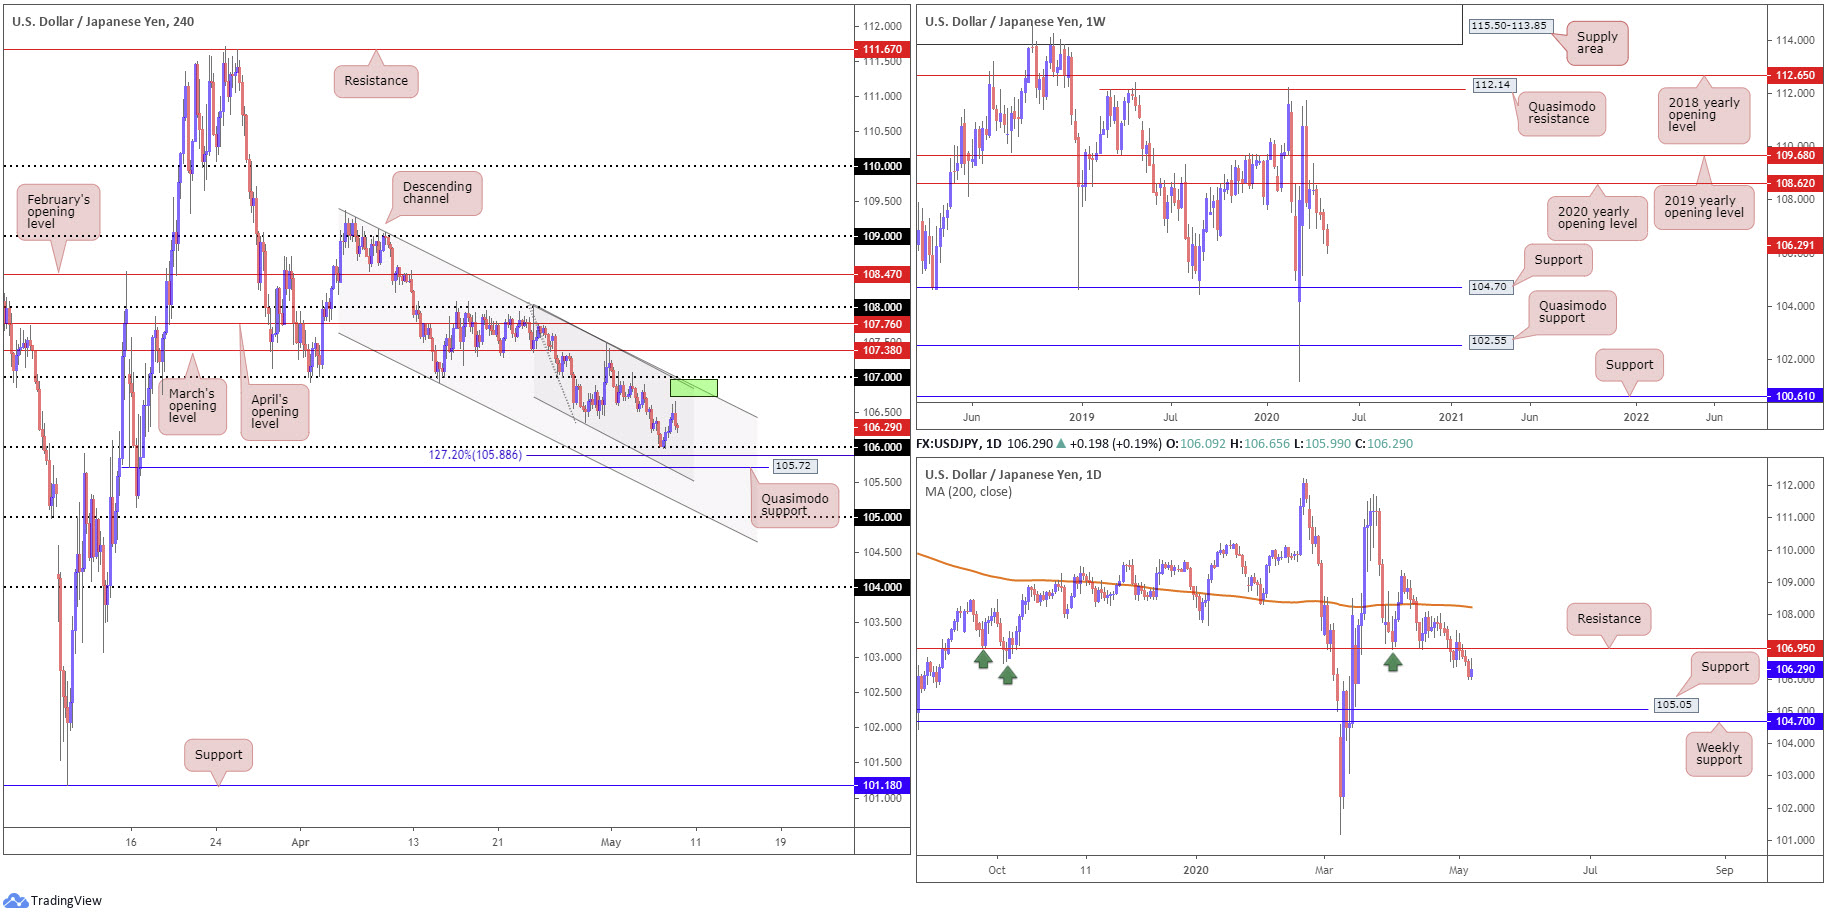
After knocking on 106’s door, USD/JPY entered an offensive phase, rallying strongly throughout Asia and partway through London on Thursday. Broad USD selling, nevertheless, closed the lid on further gains heading into US hours, consequently retreating to lows at 106.21. This has thrown 106 back into the picture and the levels sited just south of the base: a 127.2% Fibonacci extension at 105.88, local channel support from the low at 106.35 and Quasimodo support at 105.72. To the upside, nevertheless, two channel resistance levels merge close by (green – 109.38/108.04), followed by 107.
The weekly timeframe continues to emphasise a bearish tone south of the 2020 yearly opening level at 108.62. Last week, as you can see, extended losses to lows of 106.35, with this week seen trading a touch off worst levels around 105.98. Support is not expected to emerge until reaching 104.70.
Resistance at 106.95 maintains a presence on the daily timeframe.106.95 boasts notable history, therefore moves south of the base could see an approach form to support at 105.05. Additional resistance is not seen on this timeframe until reaching the 200-day SMA (orange – 108.22).
Areas of consideration:
The point which the two H4 channel resistance levels unite (green), along with the round number 107, may offer resistance in the event we catch another bid. This area also aligns with higher-timeframe direction.
A fakeout through orders at 106 to Quasimodo support at 105.72 is also a scenario worth underlining. A whipsaw through 106 followed up with a H4 close north of the round number could signal buyers want to take things higher and fill the local descending channel. However, this would unfortunately entail going up against daily and weekly directional flow.
USD/CAD:
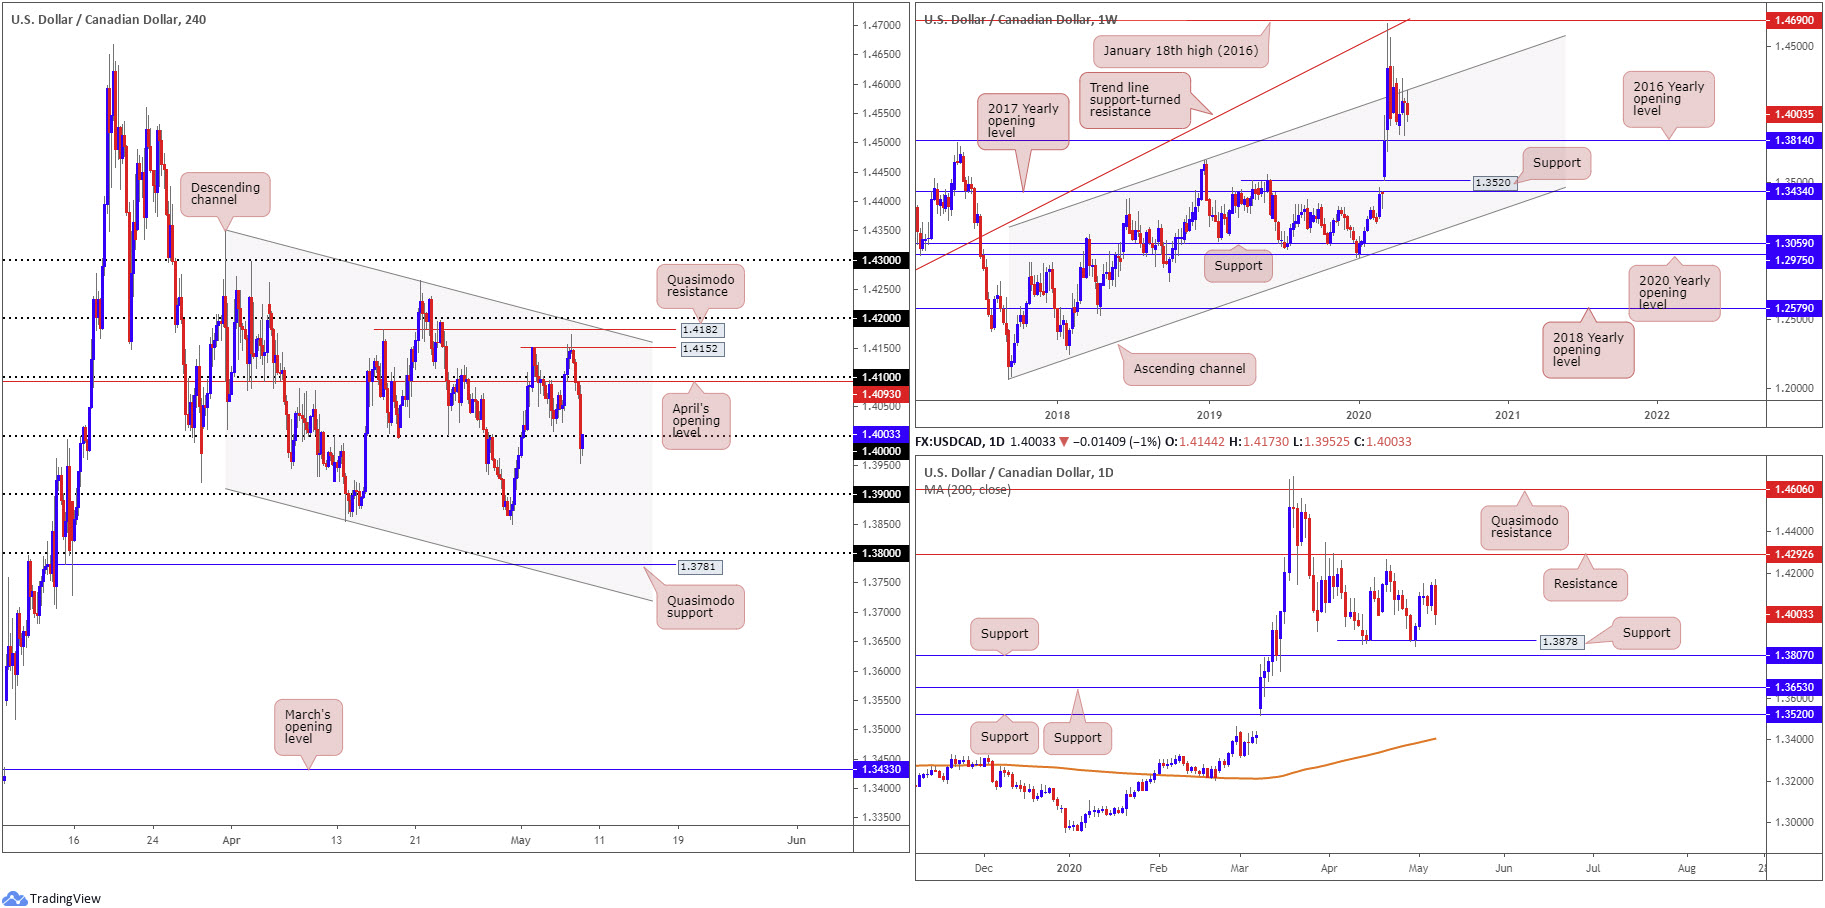
USD/CAD held onto the bulk of its losses Thursday, shedding more than 1.00% and producing a daily bearish outside day formation.
Kicking off Thursday by way of a H4 shooting star signal through 1.4152, the pair nosedived through 1.41, April’s opening level at 1.4093 and the 1.40 handle. The latter, as evident from the chart, is currently being retested as resistance, unlocking the possibility of extending losses to 1.39.
The story on the weekly timeframe has price action fading levels beneath a long-term channel resistance, taken from the high 1.3661. This positions the 2016 yearly opening level at 1.3814 back into the spotlight as possible support. Meanwhile, on the daily timeframe, after yesterday’s bearish outside day formation, familiar support at 1.3878 may be brought to light today should we continue lower, followed by support at 1.3807.
Areas of consideration:
1.40 serving as resistance is a real possibility today, especially as there’s a reasonably clear run seen to 1.39 on the H4 timeframe, and also unrestricted downside on the bigger picture. Not to mention we also formed a bearish candlestick signal on the daily timeframe.
A H4 bearish candlestick off 1.40 today would likely be enough to prompt another wave of selling; this not only helps confirm seller intent, it also provides entry/risk levels to work with, too.
USD/CHF:
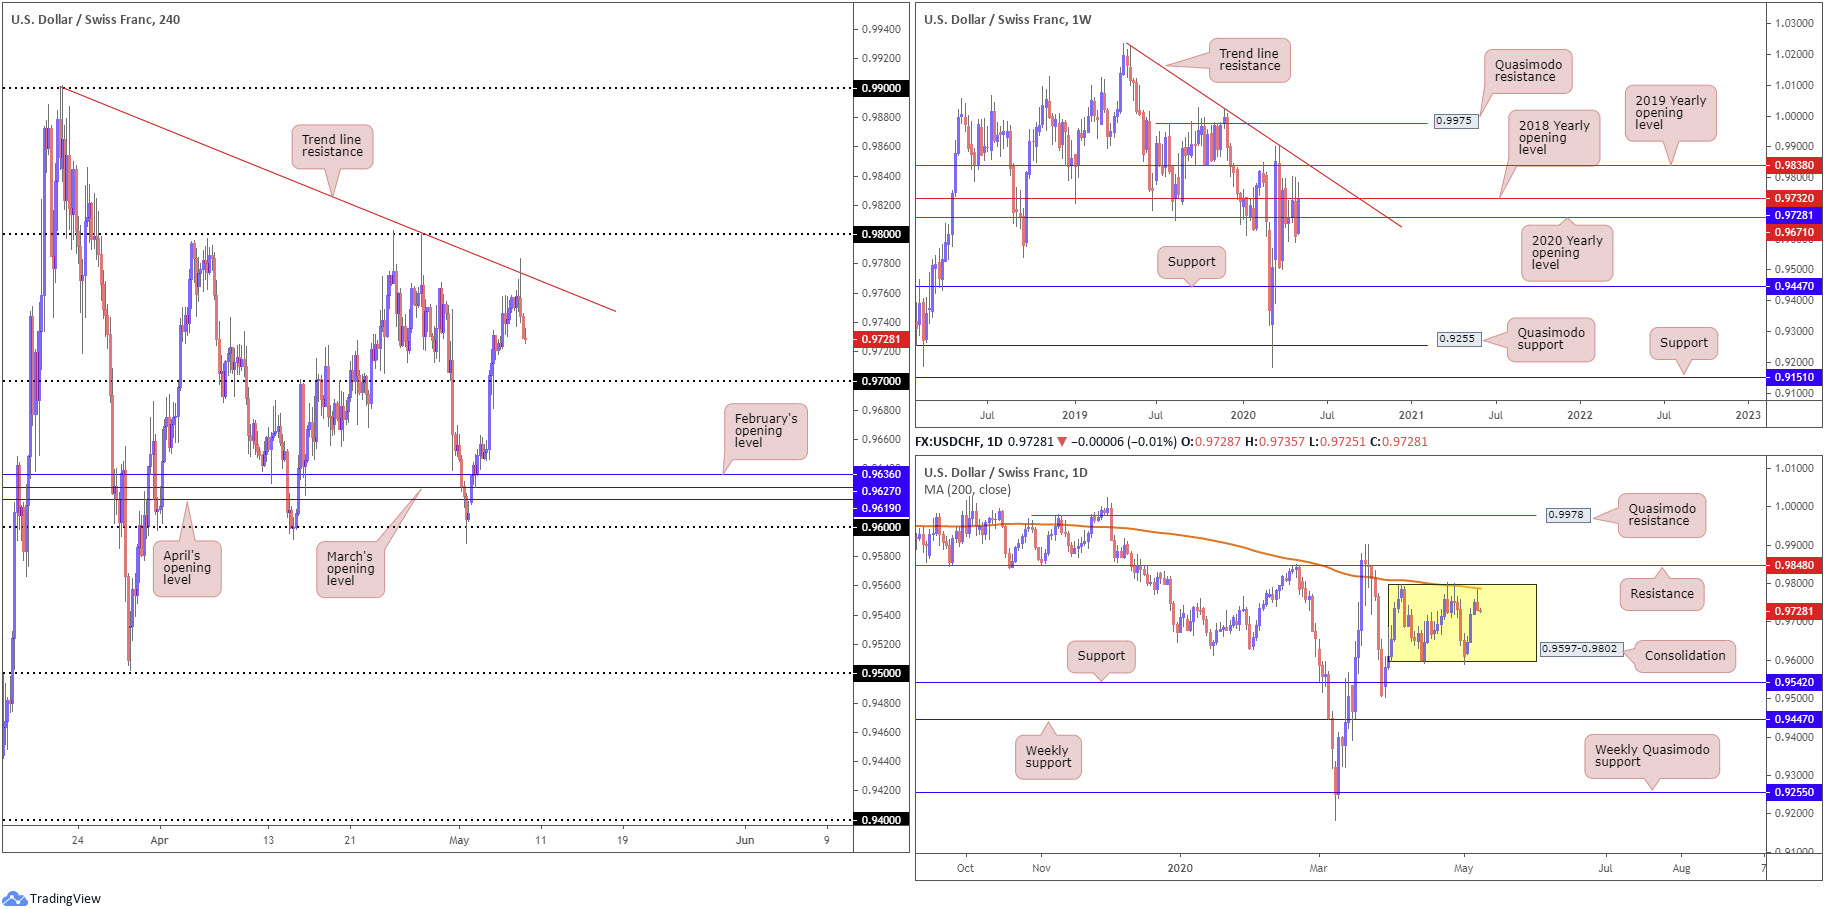
Snapping a three-day bullish phase Thursday, H4 price cut through trend line resistance, extended from the high 0.9900, and rotated lower into the close in the shape of a bearish outside setting, weighed by broad-based USD weakness. 0.97 calls for action as potential support on this timeframe, with a break exposing a relatively clear run back to 0.9619/0.9636, an area made up of April, March and February’s opening levels.
Interestingly, price action based on the daily timeframe shows the unit fading levels just short of the upper boundary of a month-long range between 0.9597-0.9802 (by way of a shooting star candlestick pattern – bearish). Note the 200-day SMA (orange – 0.9787) is also seen clinging to the upper edge of the said range. Outside of the consolidation, we can see resistance forms at 0.9848 while support can be found at 0.9542.
Meanwhile, technical action on the weekly timeframe is struggling to sustain gains above the 2018 yearly opening level at 0.9732. This throws light on a possible decline back to the 2020 yearly opening level at 0.9671. In terms of resistance above 0.9732, nonetheless, we have a trend line formation, extended from the high 1.0226, along with the 2019 yearly opening level at 0.9838.
Areas of consideration:
Those short the current H4 trend line resistance are likely expecting 0.97 to enter the fight, given daily price suggesting a move back into its range and weekly price holding beneath the 2018 yearly opening level at 0.9732.
Breakout selling sub 0.97 is appealing from both the H4 and daily timeframes, though chancy on the weekly chart owing to the 2020 yearly opening level lurking close by at 0.9671. This leaves less than 30 pips of room to play with.
In the event we crack higher today and immerse the current H4 trend line, we can expect 0.98 to seize the spotlight, which aligns with the upper boundary of the daily range at 0.9802 and the 200-day SMA. For that reason, a show from sellers here is possible.
The accuracy, completeness and timeliness of the information contained on this site cannot be guaranteed. IC Markets does not warranty, guarantee or make any representations, or assume any liability regarding financial results based on the use of the information in the site.
News, views, opinions, recommendations and other information obtained from sources outside of www.icmarkets.com.au, used in this site are believed to be reliable, but we cannot guarantee their accuracy or completeness. All such information is subject to change at any time without notice. IC Markets assumes no responsibility for the content of any linked site.
The fact that such links may exist does not indicate approval or endorsement of any material contained on any linked site. IC Markets is not liable for any harm caused by the transmission, through accessing the services or information on this site, of a computer virus, or other computer code or programming device that might be used to access, delete, damage, disable, disrupt or otherwise impede in any manner, the operation of the site or of any user’s software, hardware, data or property.


