
Key risk events today:
China Trade Balance; China USD-Denominated Trade Balance; Canada Employment Change and Unemployment Rate; US Average Hourly Earnings m/m; US Non-Farm Employment Change; US Unemployment Rate.
(Previous analysis as well as outside sources – italics).
EUR/USD:
The euro ceded further ground to the US dollar Thursday, shedding more than 115 points, or 1.00%, on the week. The US dollar index, or more commonly referred to as the ‘DXY’, continued to flex its financial muscle, extending north of 98.00 to highs of 98.57. On the data front, upbeat ISM manufacturing/non-manufacturing and US ADP non-farm employment have largely fuelled dollar gains.
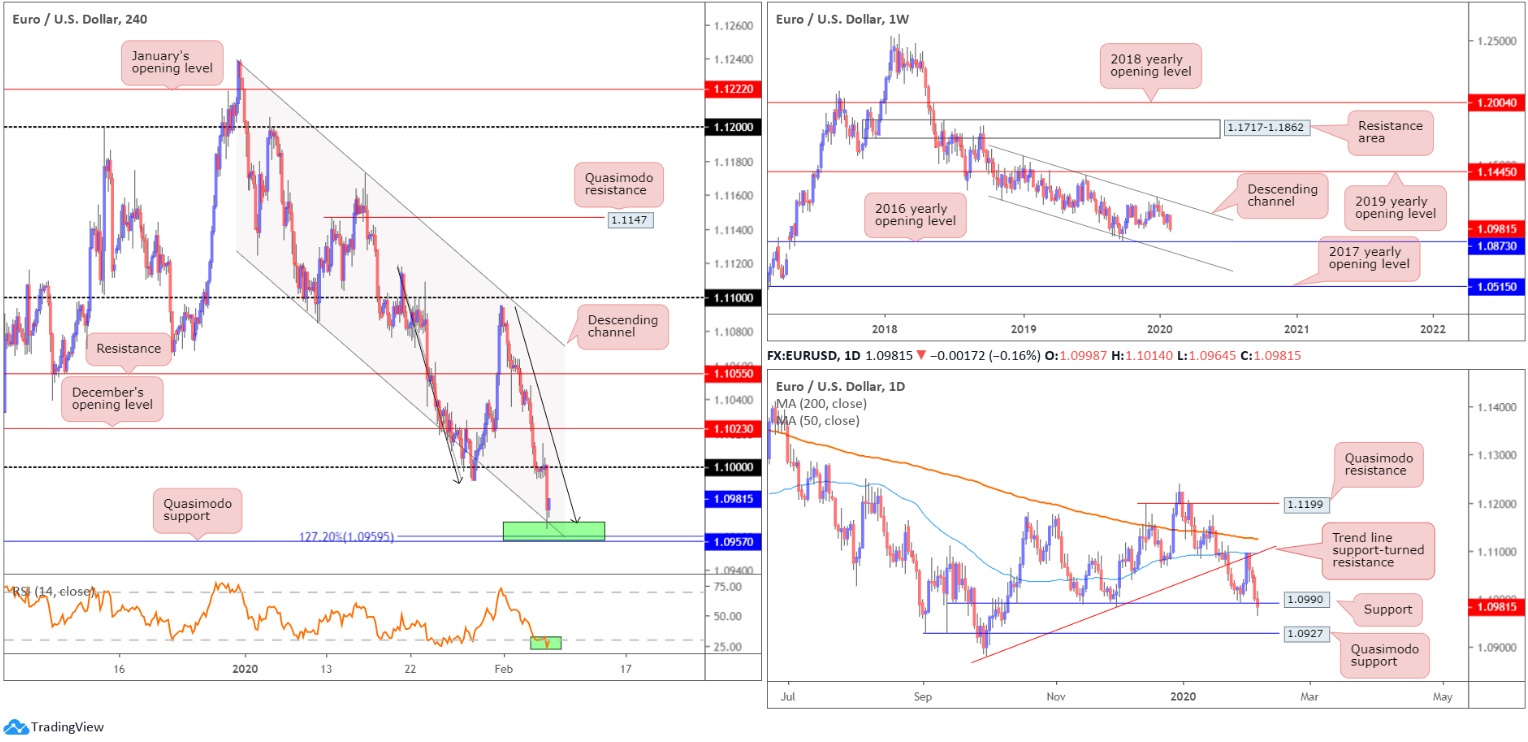
Despite an earnest attempt to reclaim 1.10+ status in early London, intraday sellers strengthened their grip amid US hours and headed for lower ground. As evident from the H4 timeframe, the pair shook hands with channel support, etched from the low 1.1085, as well as an ABCD bullish correction (black arrows) at 1.0968. Note also we have Quasimodo support fixed a few points lower at 1.0957, along with a 127.2% Fibonacci extension at 1.0959 (forms part of the overall ABCD pattern). Indicator-based traders may also note the relative strength index (RSI) trades within oversold territory.
Further afield, daily flow jumped through support at 1.0990, clocking a session low of 1.0964. Assuming sellers remain in the driving seat, Quasimodo support falls in close by at 1.0927.
Structurally, the weekly timeframe remains unchanged. Price is seen languishing beneath long-standing channel resistance, drawn from the high 1.1569. Downside targets rest at the 2016 yearly opening level from 1.0873 followed by channel support, taken from the low 1.1109. Further supporting sellers is the primary trend, down since topping in early 2018, at 1.2555.
Areas of consideration:
The combination of H4 Quasimodo support at 1.0957, the H4 ABCD formation and related Fibonacci extension, as well as H4 channel support (green – 1.0957-1.0968), appears to be holding price action higher. Alone, this area is worthy of attention, and a run to 1.10 not out of the question. H4 price closing as is, therefore, could be a potential entry trigger, with protective stop-loss orders plotted south of 1.0957.
A move beneath 1.0957, as the higher-timeframes suggest, however, could re-open the door for bearish scenarios to the daily Quasimodo support mentioned above at 1.0927, followed by the 1.09 handle on the H4 (not visible on the screen).
GBP/USD:
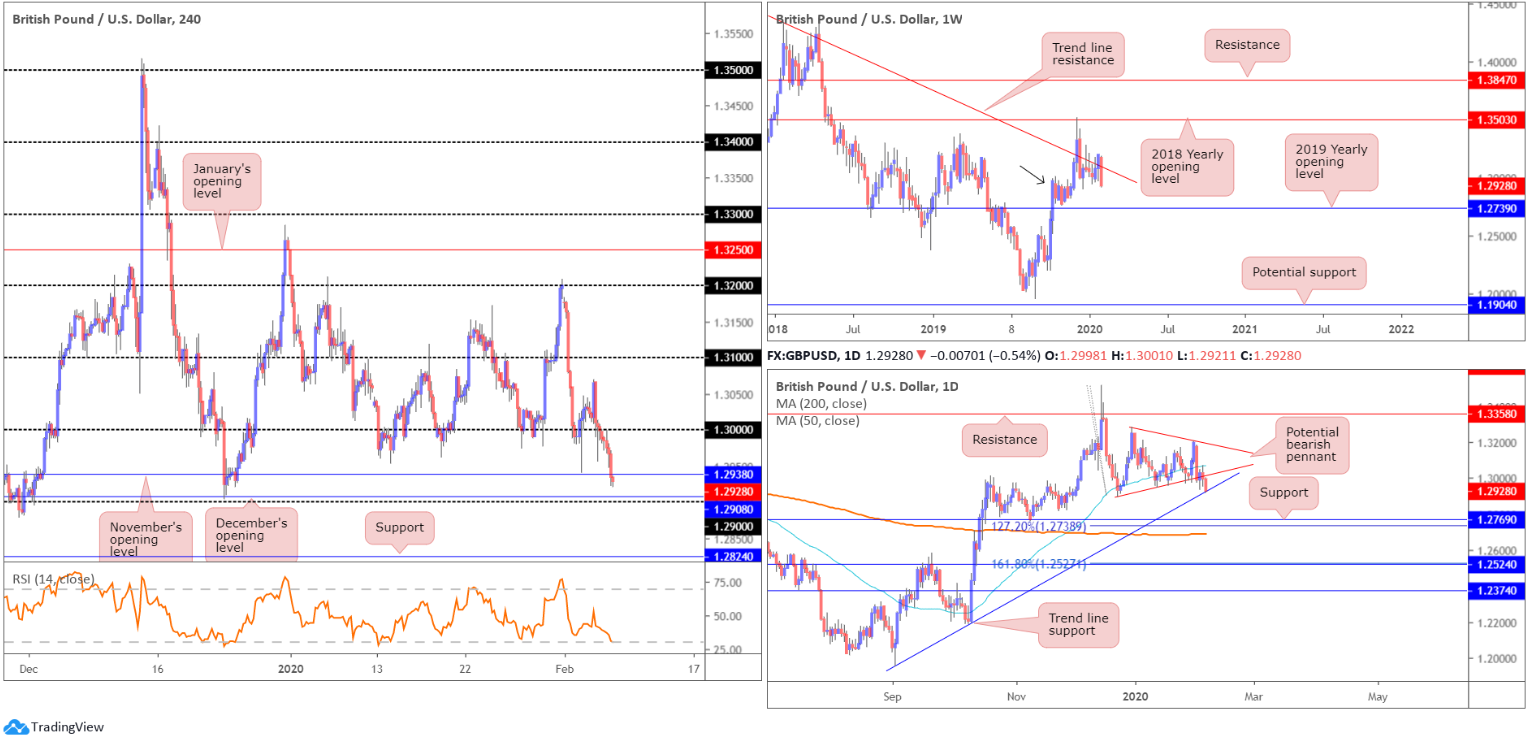
GBP/USD continued its retracement from post-BoE peaks Thursday, extending weekly losses to more than 270 points, or 2.00%. With no specific or single bearish catalyst, price explored ground south of the key figure 1.30 and crossed November’s opening level 1.2938 at the tail end of the session. Prior to running lower, traders witnessed a retest form at the underside of 1.30, offered as resistance. The relative strength index (RSI), based on the H4, also reveals oversold conditions.
Chart studies on the H4 timeframe displays support plotted nearby at December’s opening level from 1.2908, followed by 1.29, with November’s opening level at 1.2938 perhaps offering resistance today. Meanwhile, on the daily timeframe, the current candle is connecting with trend line support, taken from the low 1.1958. Prior to this, though, after fading the underside of the 50-day SMA (blue – 1.3070), price overthrew the lower edge of a bearish pennant pattern, extended from a high of 1.3284 and a low of 1.2904. A violation of the said trend line support potentially sets the stage for a run to support fixed at 1.2769 and a 127.2% Fibonacci extension at 1.2738.
Price action on the weekly timeframe trades beneath long-standing trend line resistance, pencilled in from the high 1.5930, though demand around the 1.2939 region is also in motion (black arrow).
Areas of consideration:
Sellers, according to above, appear to be gaining the upper hand at the moment. Still, waiting for a break of the 1.29 handle on the H4 timeframe, as well as a daily close south of the current daily trend line, is recommended before shorting.
A H4 close south of 1.29 will likely entice aggressive breakout sellers, targeting H4 support at 1.2824 as the initial port of call. Conservative traders, nonetheless, may opt to wait and see if a retest occurs before committing.
AUD/USD:
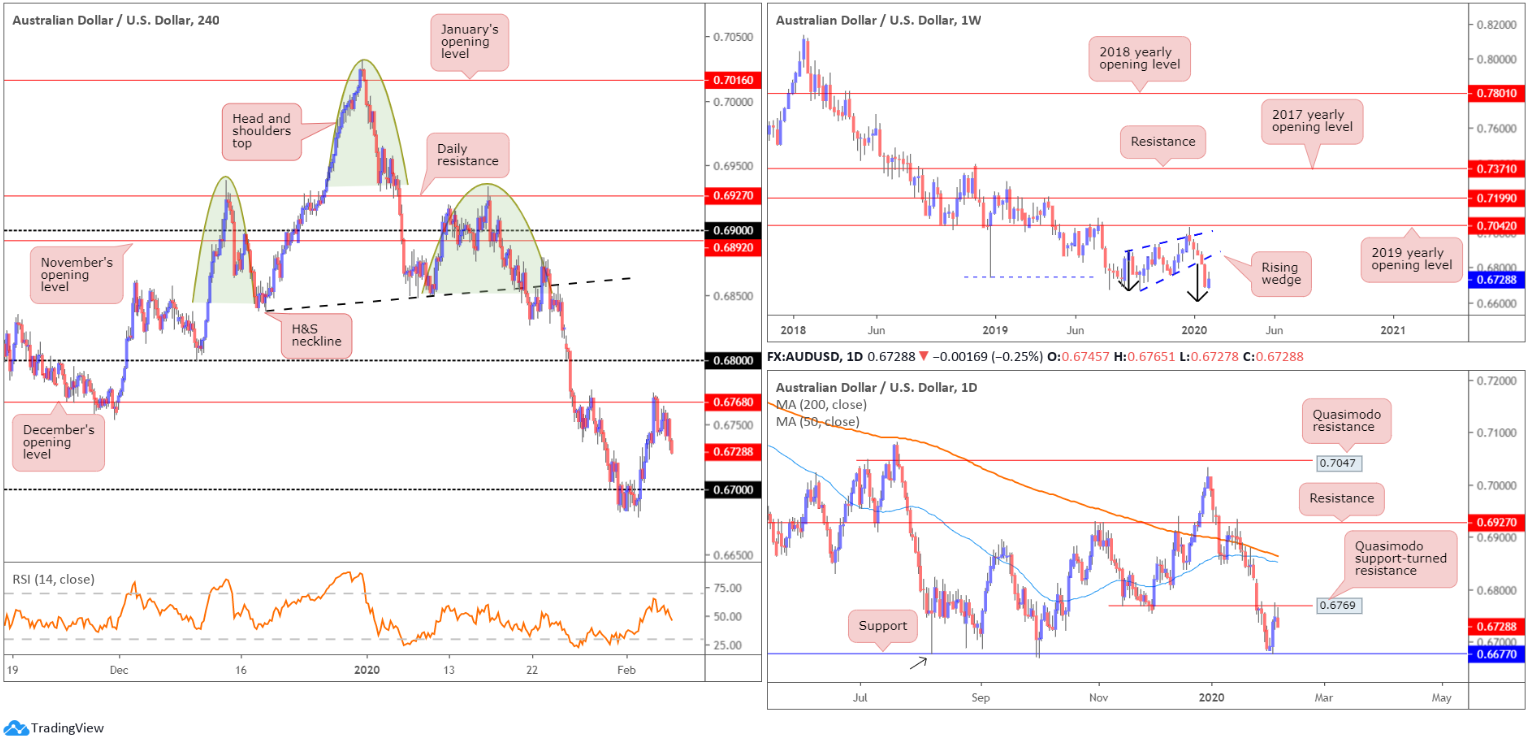
Despite posting a modest advance during the first half of the week, AUD/USD struggled to sustain gains above December’s opening level at 0.6768, based on the H4 timeframe. Technical selling from 0.6768 and daily Quasimodo support-turned resistance at 0.6769, along with lower-than-expected Australian data and a strong USD, the pair snapped a three-day winning phase and erased more than 0.20%.
According to the Australian Bureau of Statistics, Australian retail turnover fell 0.5 per cent in December 2019, seasonally adjusted, according to the latest Australian Bureau of Statistics (ABS) Retail Trade figures. This follows a rise of 1.0 per cent in November 2019. In addition, in seasonally adjusted terms, the balance on goods and services was a surplus of $5,223m in December 2019, a decrease of $295m on the surplus in November 2019.
The next downside target on the H4 rests at the 0.67 handle, while daily structure suggests a move to 0.6677 may be in store. Note the daily level also represents a Quasimodo support (black arrow).
The weekly timeframe’s overall structure remains unchanged (italics):
Since registering a bottom in late September at 0.6670 (2019), price carved out a rising wedge formation, typically considered a continuation pattern within a trending environment.
The past five weeks witnessed price decline back into the rising wedge and, thanks to recent selling, break and extend beyond the lower edge. With the primary downtrend having been in full force since topping at 0.8135, in early 2018, further downside is possible.
Assuming a break of the 0.6670 September 30th low, the rising wedge take-profit (black arrows – calculated by taking the height of the base and adding it the breakout point) is seen at 0.6614, followed by support at 0.6359 (not visible on the screen).
Areas of consideration:
Well done to any readers who managed to hold shorts off December’s opening level at 0.6768/daily Quasimodo resistance at 0.6769. This was a noted resistance combination to be aware of in previous analysis. This was a particularly favourable resistance, due to the weekly timeframe portending further downside (see above italics).
Shorts from 0.6768/9 are likely to begin reducing risk to breakeven, ahead of today’s US non-farm payrolls release. Ultimately, though, a move to 0.67 is still on the cards, with a break exposing daily support at 0.6677.
USD/CAD:
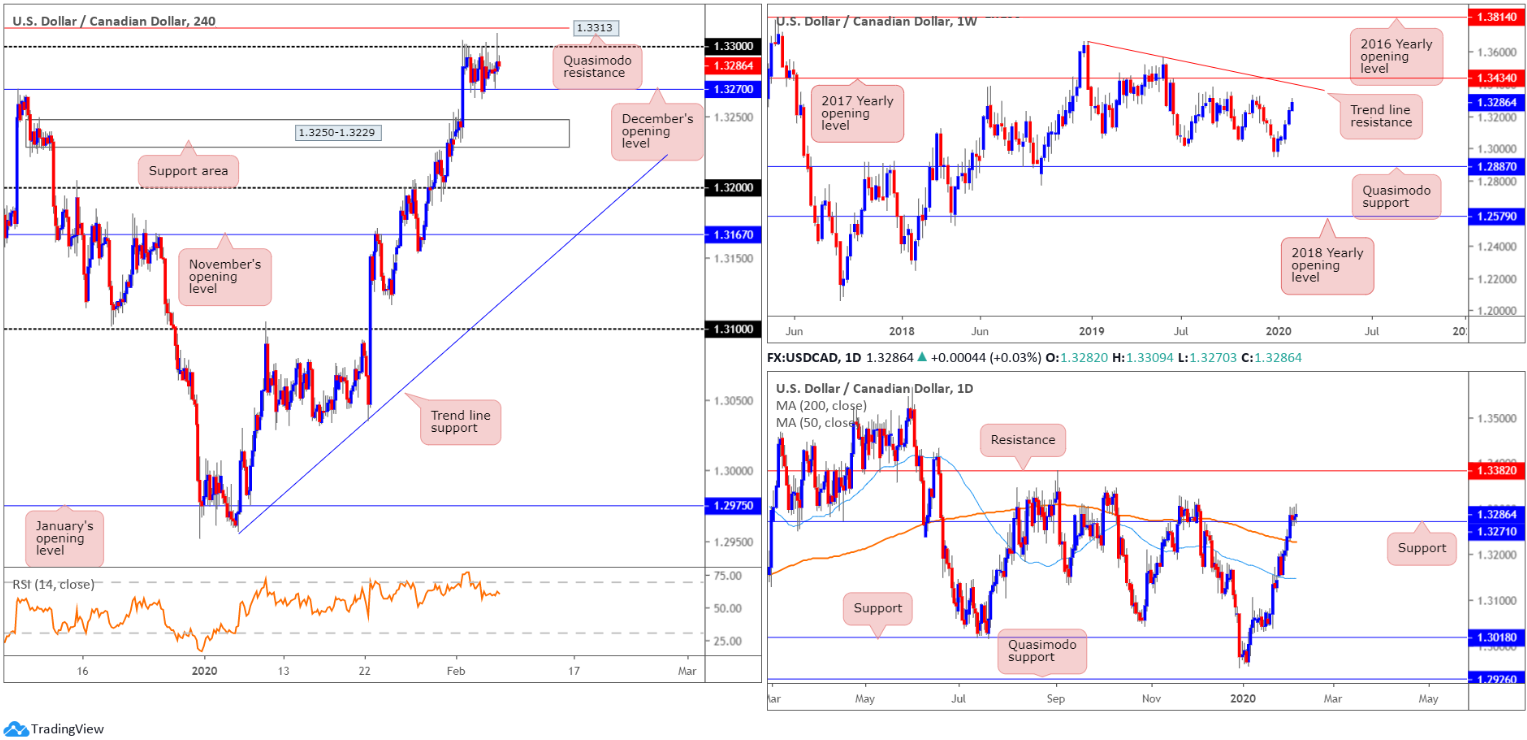
Since the beginning of the week, buyers and sellers have been squaring off within a narrow range between December’s opening level drawn from 1.3270 and the 1.33 handle, based on the H4 timeframe. Although still confined within the walls of the said range, intraday movement gathered traction amid US trade Thursday and scored highs of 1.3309, levels not seen since early December.
Beyond 1.33, Quasimodo resistance resides close by at 1.3313. It may also interest some traders to note the relative strength index (RSI) remains languishing beneath its overbought value after reaching highs of around 79.00 earlier in the week.
Elsewhere, resistance-turned support at 1.3271 on the daily timeframe currently offers a ‘floor’ in this market (essentially the same level as December’s opening level on the H4 timeframe). To the upside, the research team sees little in the way of active supply until reaching resistance at 1.3382. Further adding to the bullish bias, weekly price shows room to advance as far north as tops around 1.3317, closely followed by trend line resistance (1.3661) and the 2017 yearly opening level at 1.3434.
Areas of consideration:
Although H4 price recently faded the 1.33 handle, December’s opening level at 1.3270 is seen holding firm on H4, as is daily support at 1.3271. This, as well as weekly price exhibiting scope to press higher, may encourage additional buying, with a break of 1.33 and possibly H4 Quasimodo resistance at 1.3313 in the pipeline.
Conservative traders may seek additional confirmation off 1.3270/1, likely in the form of a bullish candlestick signal, before pulling the trigger. This is perhaps due to the threat of a possible fakeout to nearby H4 support area at 1.3250-1.3229 and the RSI signalling a move lower.
Intraday, however, could observe a whipsaw through 1.33, tripping additional buy stops and filling sellers off H4 Quasimodo resistance at 1.3313. This may only be good for a move to 1.3270, so positioning protective stop loss orders above the apex of the Quasimodo pattern (1.3321) could be an option, ensuring reasonable risk/reward, should the trade work in favour.
USD/CHF:
A relatively tame session for USD/CHF Thursday, though price did manage to extend weekly gains, currently up more than 100 points, or 1.20%.
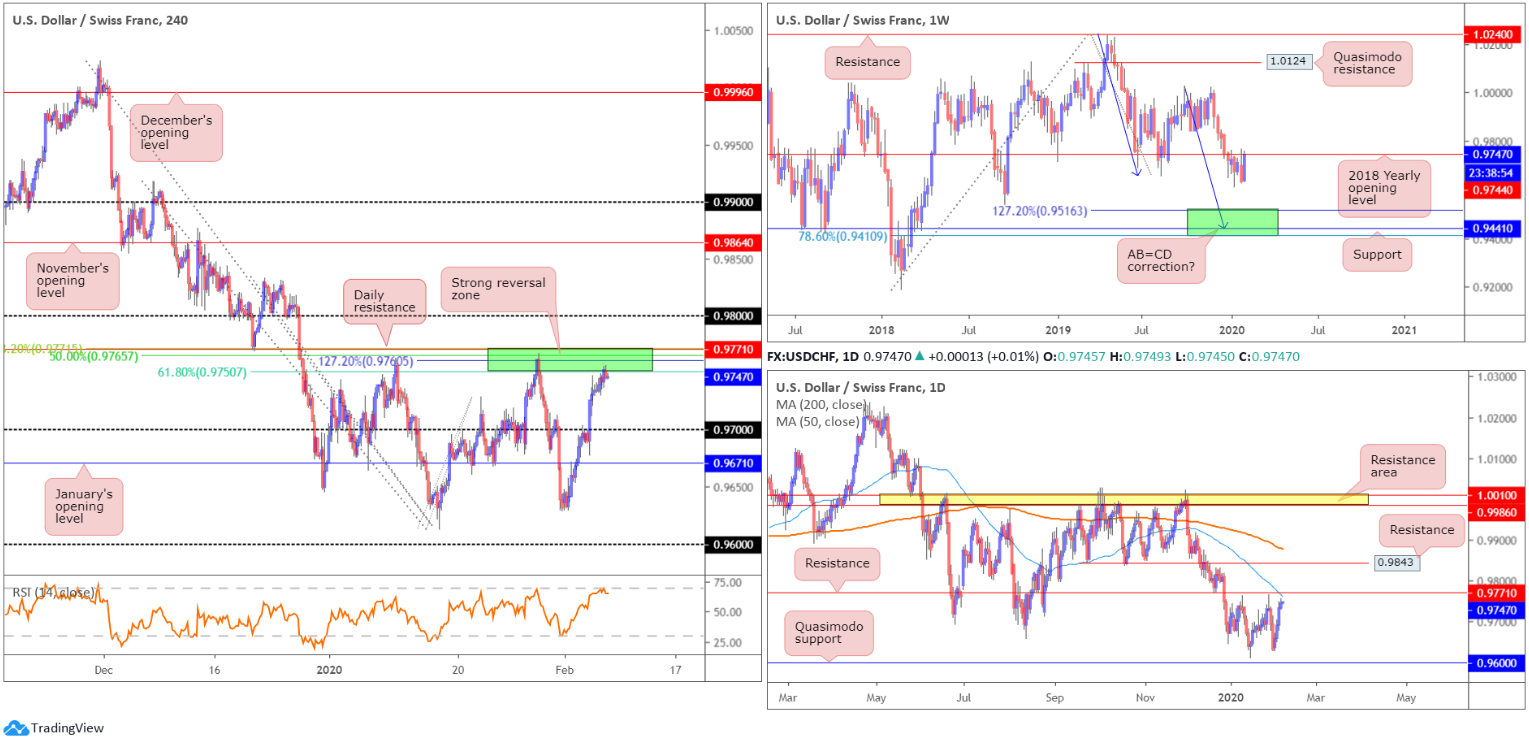
An update from the H4 timeframe shows the candles testing a particularly interesting resistance area between 0.9771/0.9750, comprised of Fibonacci confluence and nearby daily resistance at 0.9771 (green). Also noteworthy is the relative strength index (RSI) seen fading its overbought value.
In terms of the weekly timeframe, price action is tackling the underside of the 2018 yearly opening level at 0.9744, a hurdle that supported price on three occasions since January 2019. Despite the recent recovery over the last few days, the next downside target on the weekly sits within 0.9410/0.9516, comprised of a 78.6% Fibonacci retracement at 0.9410, support at 0.9441 and a 127.2% AB=CD bullish correction (black arrows]) at 0.9516 – green.
Meanwhile, on the daily timeframe price action is poised to lock horns with resistance priced in at 0.9771, which aligns closely with the 50-day SMA (blue – 0.9761).
Areas of consideration:
0.9771/0.9750 remains in focus. All three timeframes suggest a reaction out of this zone, perhaps reconnecting with the 0.97 handle. Conservative traders will likely watch for signs of selling to emerge out of the said zone before committing, due to the threat of a fakeout emerging through the current H4 resistance area to the 0.98 handle. This could be something as simple as a H4 bearish candlestick pattern, though is ultimately trader dependent.
Dow Jones Industrial Average:
Major US benchmarks firmed Thursday, following China’s announcement it will halve tariffs on several US products. Strong corporate earnings results and solid economic data also gave the indexes a boost (CNBC). The Dow Jones Industrial Average added 88.92 points, or 0.30%; the S&P 500 advanced 11.09 points, or 0.33% and the tech-heavy Nasdaq 100 ended higher by 78.44 points, or 0.84%.
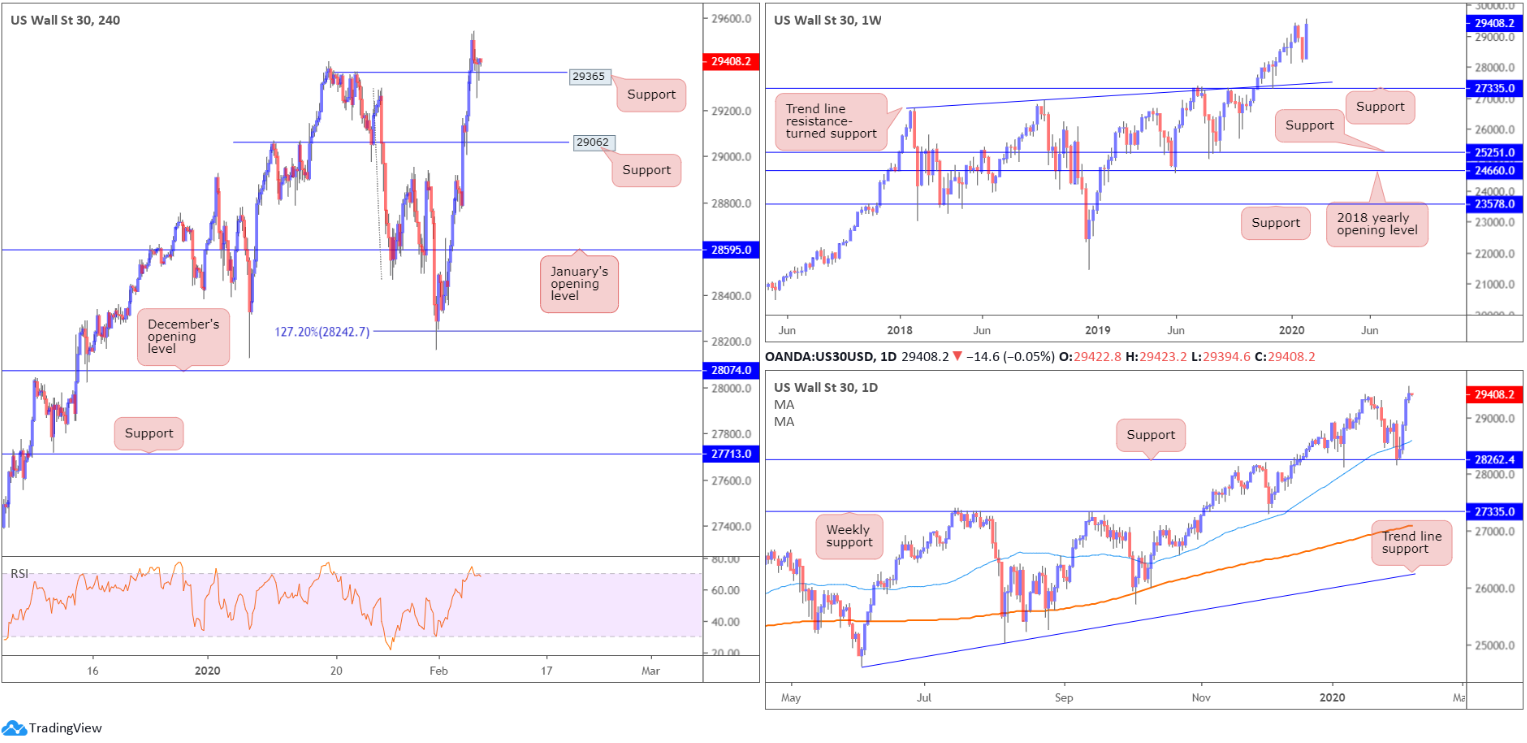
The Dow clocked fresh record peaks at 29541 yesterday, though pared a portion of the day’s gains amid US hours and reconnected with H4 support priced in at 29365. H4 price also recently chalked up a H4 hammer candlestick formation off the said support (considered a bullish signal at troughs).
Areas of consideration:
The retest at H4 support drawn from 29365, along with the H4 bullish candlestick signal, will likely encourage buying today, potentially refreshing all-time highs.
Therefore, keeping things simple this morning, an entry long at current price is an idea, with a protective stop-loss order plotted beneath 29256, yesterday’s session low. As for take-profit targets, 29541 is a logical starting block, with a break suggesting a trailing stop might then be worth considering.
XAU/USD (GOLD):
The price of gold, in % terms, rallied Thursday, adding more than $10, or 0.69%. Advancing US Treasury yields, a rising USD and risk-on trade, which typically undermines demand for safe-haven assets, had limited effect yesterday.
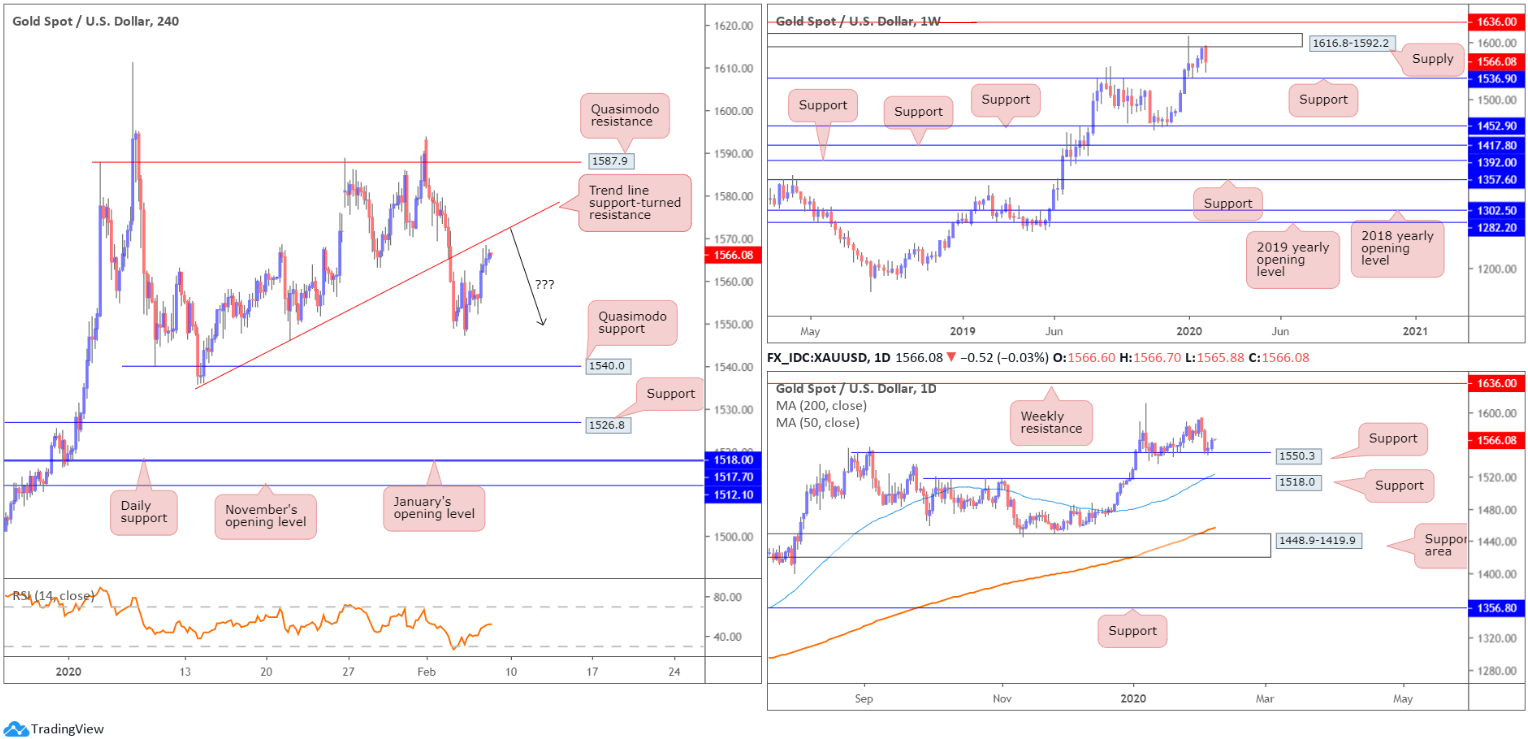
Developments on the technical front has H4 stationed south of trend line support-turned resistance, taken from the low 1536.2. Continued bidding from here invites an approach towards Quasimodo resistance coming in at 1587.9, whereas a rejection, aside from Wednesday’s low at 1547.6, has Quasimodo support at 1540.0 to target.
Further out, the weekly timeframe shows price fading the underside of supply drawn from 1616.8-1592.2, with the next point of support seen at 1536.9. A closer reading of price action on the daily timeframe has the unit rebounding from support at 1550.3, fixed north of another layer of support at 1518.0, which happens to merge closely with the 50-day SMA (blue – 1524.1). As you can see, weekly and daily structure have diverging views right now.
Areas of consideration:
Although a recovery off daily support at 1550.3 may develop, the threat of further selling on the weekly timeframe to support at 1536.9 is certainly there. With higher timeframes usually taking precedence over lower timeframes, a retest at the current H4 trend line resistance is a line worth watching today for possible bearish scenarios.
With trend lines prone to whipsaws, however, traders are urged to consider waiting for (at least) additional candlestick confirmation to form before pulling the trigger. Not only will this help identify seller intent, it’ll provide entry and risk levels to work with.
The accuracy, completeness and timeliness of the information contained on this site cannot be guaranteed. IC Markets does not warranty, guarantee or make any representations, or assume any liability regarding financial results based on the use of the information in the site.
News, views, opinions, recommendations and other information obtained from sources outside of www.icmarkets.com.au, used in this site are believed to be reliable, but we cannot guarantee their accuracy or completeness. All such information is subject to change at any time without notice. IC Markets assumes no responsibility for the content of any linked site.
The fact that such links may exist does not indicate approval or endorsement of any material contained on any linked site. IC Markets is not liable for any harm caused by the transmission, through accessing the services or information on this site, of a computer virus, or other computer code or programming device that might be used to access, delete, damage, disable, disrupt or otherwise impede in any manner, the operation of the site or of any user’s software, hardware, data or property.


