
EUR/USD:
Swarmed by an almost clean sweep of sub-forecast US employment data, the EUR/USD concluded Thursday in positive territory, up 0.28%.
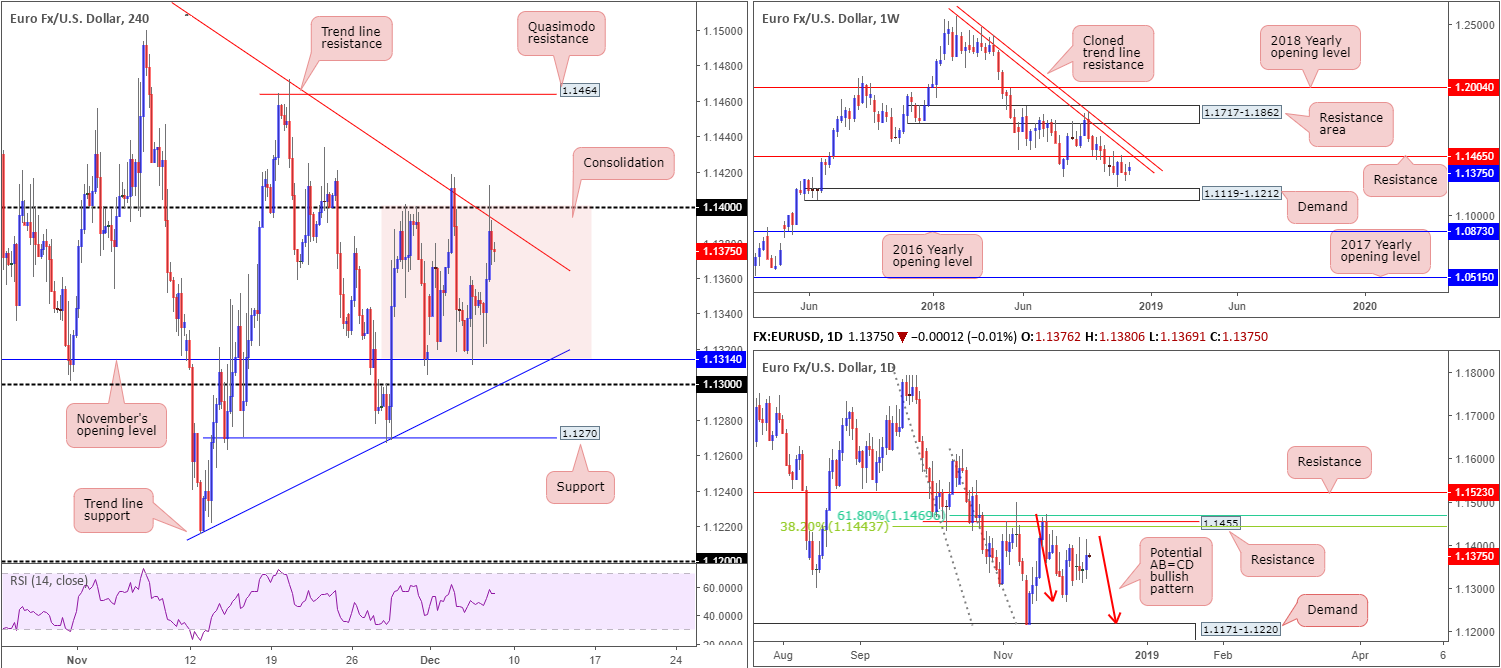
Leaving November’s opening level on the H4 at 1.1314 unchallenged, the pair approached its 1.14 space, which happens to merge closely with a trend line resistance (etched from the high 1.1621). Price action topped just north of 1.14 before mildly paring gains, consequently pulling the unit sub 1.14 into the close. Note since Thursday last week, the unit has been carving out a consolidation between November’s opening level and 1.14. Areas outside of this area fall in at a Quasimodo resistance drawn from 1.1464 and the round number 1.13.
When it comes to the higher timeframes, structure remains unchanged. Weekly movement continues to meander between resistance priced in at 1.1465 (brings with it a nearby cloned trend line resistance [extended from the high 1.2413]), and demand coming in at 1.1119-1.1212. However, it is worth pointing out the current weekly candle now emphasizes more of a bullish tone.
Closer reading of daily structure adds the possibility of an AB=CD bullish pattern (red arrows) developing in the near future, terminating around the top edge of a demand drawn from 1.1171-1.1220 (glued to the top edge of the aforementioned weekly demand). If it follows the pair turns northbound prior to completing the harmonic formation, however, traders are urged to pencil in resistance at 1.1455 that merges closely with two Fibonacci resistances: a 61.8% and a 38.2% at 1.1469 and 1.1443, respectively.
Areas of consideration:
Due to the lack of higher-timeframe confluence, traders are left with the current H4 consolidation between 1.14/1.1314. Technically speaking, the H4 candles should explore lower ground from current price and fill the range. We do have a bearish inside candle recently printed, which may be enough to draw in sellers as we head into Europe today. Safe stop-loss orders are best positioned above yesterday’s session high: 1.1412, with an ultimate target objective set at 1.1314.
Today’s data points: US Non-Farm Employment Change, Average Hourly Earnings m/m and Unemployment Rate; US Prelim UoM Consumer Sentiment; FOMC Member Brainard Speaks.
GBP/USD:
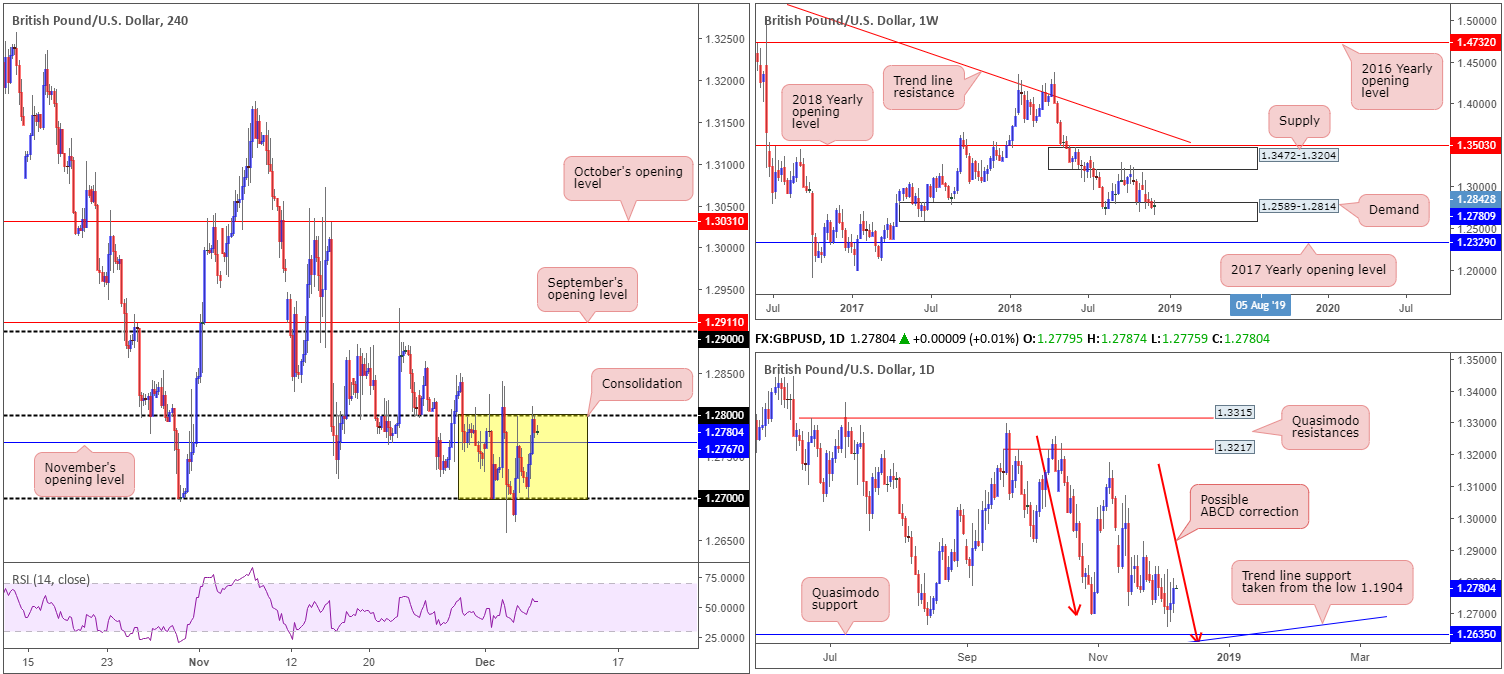
Since the beginning of the week, the GBP/USD has been busy carving out a consolidation between 1.28/1.27.
Thursday’s action witnessed the British pound advance against its US counterpart, up 0.37% on the day. The move was largely on the back of broad USD weakness and chatter out of the UK regarding the possibility of a second referendum, or a softer Brexit if PM May’s plan fails to pass through Parliament.
A breakout north from the aforesaid range could lead to price action swiftly exploring ground as far north as 1.29. This is due to the lack of active supply between 1.28/1.29. Beneath 1.27, on the other hand, traders likely have their crosshairs fixed on a daily Quasimodo support at 1.2635.
Higher-timeframe structure reveals the pair remains within the confines of weekly demand coming in at 1.2589-1.2814, though as of yet price has failed to produce anything meaningful to the upside from here. Daily price, nevertheless, is seen finding support ahead of a Quasimodo formation located at 1.2635 that unites with trend line support (taken from the low 1.1904), and an ABCD bullish pattern (red arrows) terminating just south at 1.2614.
Areas of consideration:
A H4 close above 1.28 – coupled with a retest as support in the shape of a bullish candlestick formation (entry/stop parameters can be defined according to this pattern) – is likely enough evidence to condone a long towards 1.29.
As price is testing the top edge of its current H4 range 1.28, there will undoubtedly be traders looking to fade this area in the hope price tests its opposite edge: 1.27. Waiting for price to cross beneath November’s opening level at 1.2767 before committing to a position is recommended, as this will firmly display seller intent is present in the market.
Today’s data points: US Non-Farm Employment Change, Average Hourly Earnings m/m and Unemployment Rate; US Prelim UoM Consumer Sentiment; FOMC Member Brainard Speaks.
AUD/USD:
Demand for the Australian dollar continued to diminish Thursday, as the commodity currency registered its fourth consecutive losing day vs. the US dollar. Persistent weakness observed in US equity markets, as well as soft Aussie macroeconomic data, has positioned the AUD/USD 2.00% in the red so far this week.
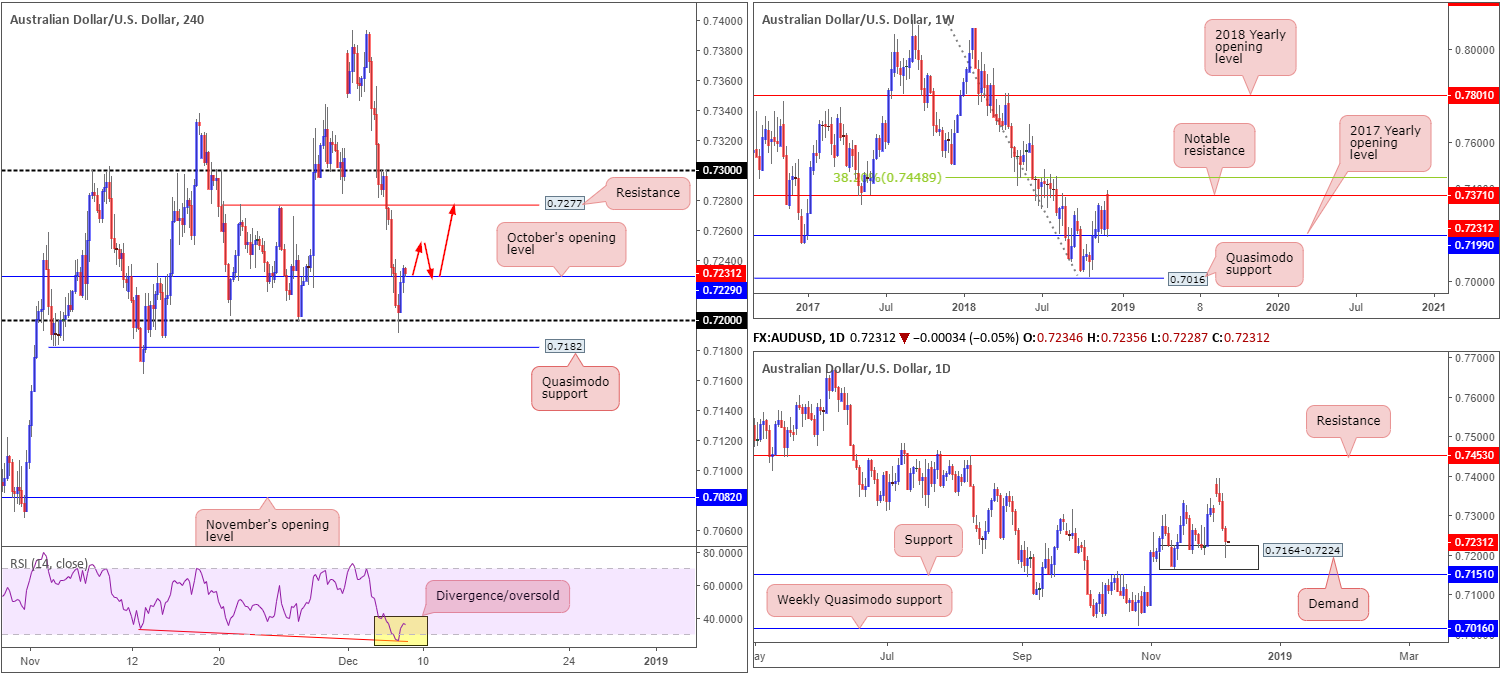
Despite the above, there may be a light at the end of the tunnel. From a technical perspective, weekly flow shook hands with its 2017 yearly opening level at 0.7199 and has mildly responded. In conjunction with this, we can also see daily activity recently connected with demand at 0.7164-0.7224. Couple this with H4 price finding support off its 0.72 handle and marginally closing Thursday out above October’s opening level at 0.7229, as well as the RSI indicator currently displaying a divergence/oversold reading, there’s a strong chance the market could witness further buying take shape today/early next week.
Areas of consideration:
All three timeframes, according to our technical studies, suggest the buyers have the upper hand at the moment.
Should traders observe H4 price retest October’s opening level mentioned above at 0.7229 as support, this is a strong cue for a move towards at least resistance at 0.7277.
In an ideal world, however, we would like to see price print more of a decisive H4 close above 0.7229 and then follow up with a retest (red arrows) by way of a bullish candlestick formation (entry/stop parameters can be defined according to this pattern). This helps avoid falling victim to a fakeout play.
Today’s data points: US Non-Farm Employment Change, Average Hourly Earnings m/m and Unemployment Rate; US Prelim UoM Consumer Sentiment; FOMC Member Brainard Speaks.
USD/JPY:
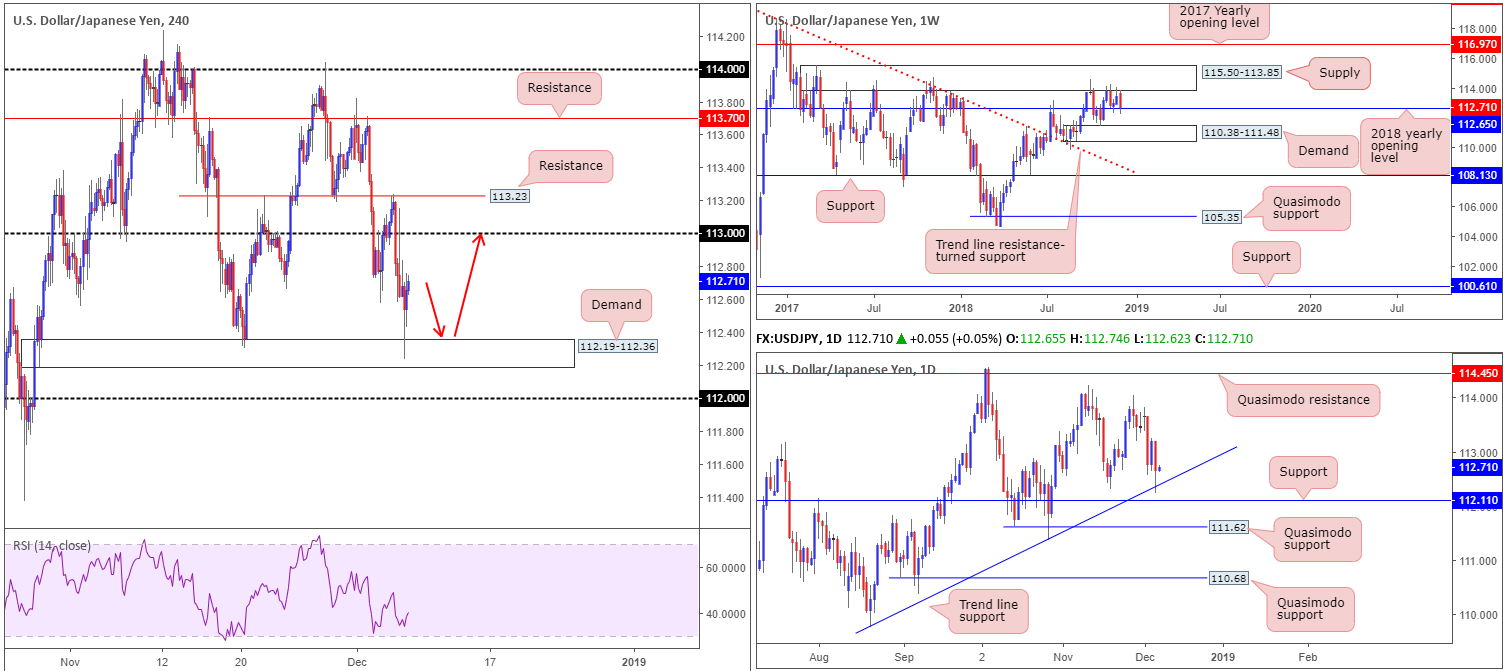
Risk aversion boosted demand for the Japanese yen amid European hours Thursday, dropping the USD/JPY to lows of 112.23. As US traders entered the market, price recovered from this point in reasonably strong fashion, trailing US equity markets.
H4 demand at 112.19-112.36 aided yesterday’s recovery, as did notable structure on the higher timeframes. Weekly price, as you can see, ended the day crossing swords with the 2018 yearly opening level at 112.65, and daily movement recently checked in with a trend line support (extended from the low 109.77). The question going forward is whether or not this will be enough to pull H4 price towards 113/H4 resistance at 113.23.
Areas of consideration:
Although all three timeframes show scope for a push higher today, defining an entry point is proving troublesome at current price. With that being the case, the research team will only consider this a buyers’ market should the unit retest the H4 demand area mentioned above at 112.19-112.36 (red arrows). This will likely stop out traders already long that have protective stops located at breakeven.
Instead of simply entering long from 112.19-112.36 and hoping for the best, conservative traders may opt to enter based on bullish candlestick confirmation and position entry and stop-loss levels as per the selected structure.
Today’s data points: US Non-Farm Employment Change, Average Hourly Earnings m/m and Unemployment Rate; US Prelim UoM Consumer Sentiment; FOMC Member Brainard Speaks.
USD/CAD:
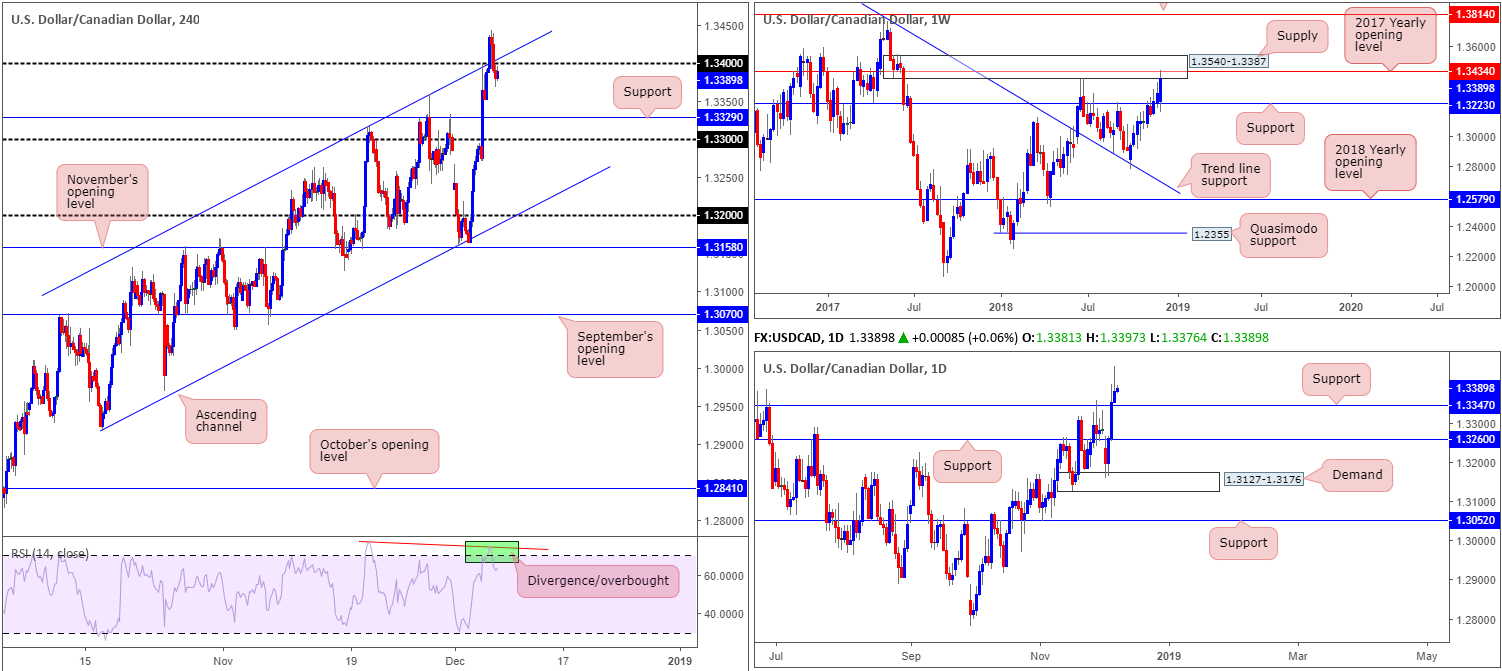
Underpinned amid deteriorating crude oil prices, the USD/CAD market advanced to a fresh 2018 yearly high of 1.3444 Thursday. With the buck falling sharply amid early US hours, however, the pair retreated from said highs and reclaimed 1.34 and a H4 channel resistance (extended from the high 1.3317) to the downside into the closing bell, though still recorded a 0.21% gain on the day.
In terms of where we’re positioned on the H4 timeframe this morning, the candles may make a run for support coming in at 1.3229, followed closely by the 1.33 handle. It might also be worth noting the RSI indicator is trading from overbought territory and printing a divergence pattern at the moment.
According to weekly structure, further downside is a strong possibility. Price action recently crossed paths with its 2017 yearly opening level at 1.3434, which happens to be encased within a supply zone at 1.3540-1.3387. The only drawback we see here is daily price revealing room to press as far north as resistance drawn from 1.3533 (not seen on the screen), after taking out resistance at 1.3347 (now acting support) Wednesday.
Areas of consideration:
Given the market is trading from notable weekly supply and a yearly opening level, along with room to explore lower ground on the H4 timeframe, the research team feels a move lower could be on the cards today, targeting daily support at 1.3347, followed closely by H4 support at 1.3329.
To take advantage of this potential move lower, a retest to the underside of 1.34 as resistance in the shape of a bearish candlestick configuration (entry/stop parameters can be defined according to this pattern) would be considered a high-probability shorting opportunity.
Today’s data points: US Non-Farm Employment Change, Average Hourly Earnings m/m and Unemployment Rate; US Prelim UoM Consumer Sentiment; FOMC Member Brainard Speaks; Canadian Employment Change and Unemployment Rate.
USD/CHF:
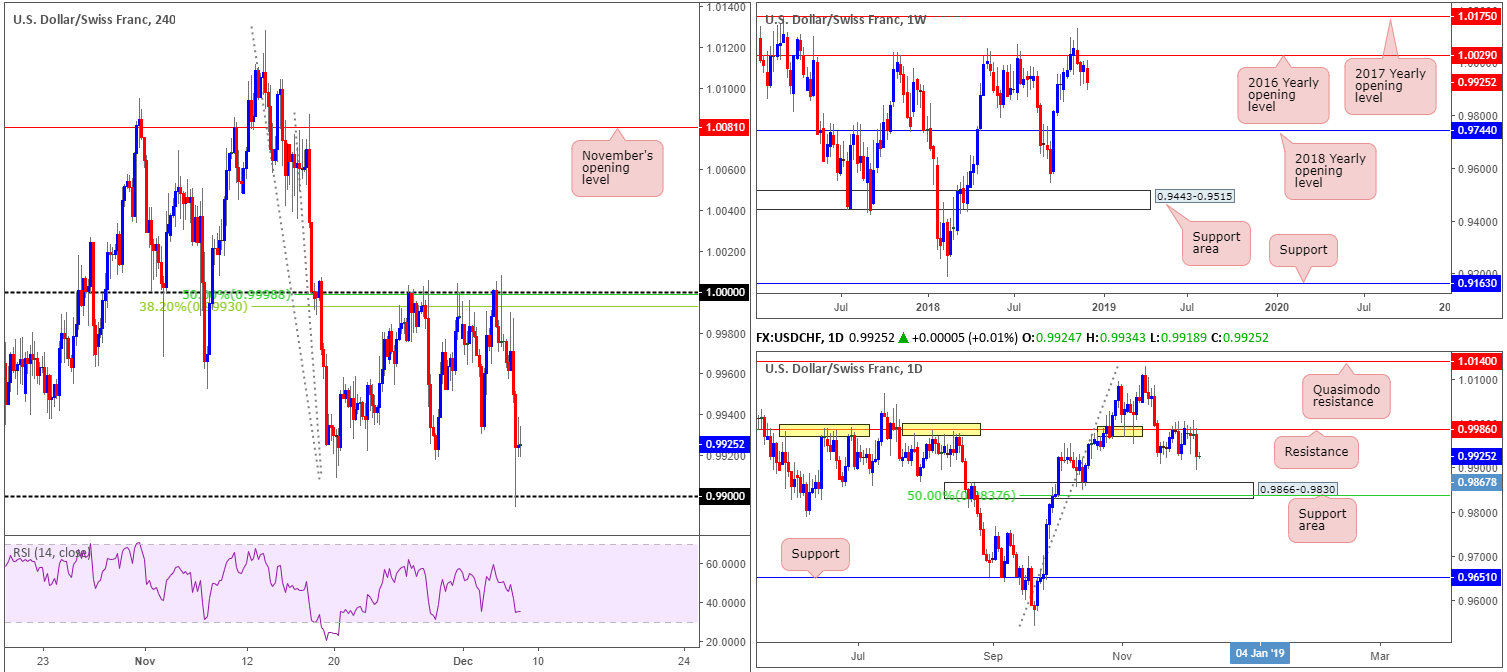
For those who’ve been following our morning briefings this week you may recall the research team expressed interest in 1.0000 as a potential sell zone.
Although a key figure by and of itself, it is worth noting 1.0000 was surrounded by a 38.2% H4 Fibonacci resistance value at 0.9993, along with a 50.0% H4 resistance value at 0.9999. What also really attracted us to 1.0000 was the fact daily resistance was in play at 0.9986. The level, as you can see (yellow), boasts incredibly strong historical significance, and, therefore, had a strong chance of holding ground.
As you can see from the H4 chart this morning, the candles made a run for its 0.99 handle Thursday, which was reported as a logical downside target from 1.0000 due to the lack of active demand. Well done to any of our readers who managed to hold their short positions here.
Although 0.99 is seen holding firm, further downside is a possibility. Daily price shows room to continue pressing lower until reaching a support area coming in at 0.9866-0.9830, while weekly price portends a move beyond this area towards the 2018 yearly opening level at 0.9744.
Areas of consideration:
With the higher timeframes signifying further selling, a break of 0.99 is something to keep an eyeball on going forward. In the event the market observes a decisive H4 close under 0.99 that’s followed up with a retest this, according to the overall technical picture, is likely sufficient enough to justify a sell (stop-loss orders can be positioned above the rejecting candle), targeting the top edge of the daily support area mentioned above at 0.9866 as an initial take-profit zone.
Today’s data points: US Non-Farm Employment Change, Average Hourly Earnings m/m and Unemployment Rate; US Prelim UoM Consumer Sentiment; FOMC Member Brainard Speaks.
Dow Jones Industrial Average:
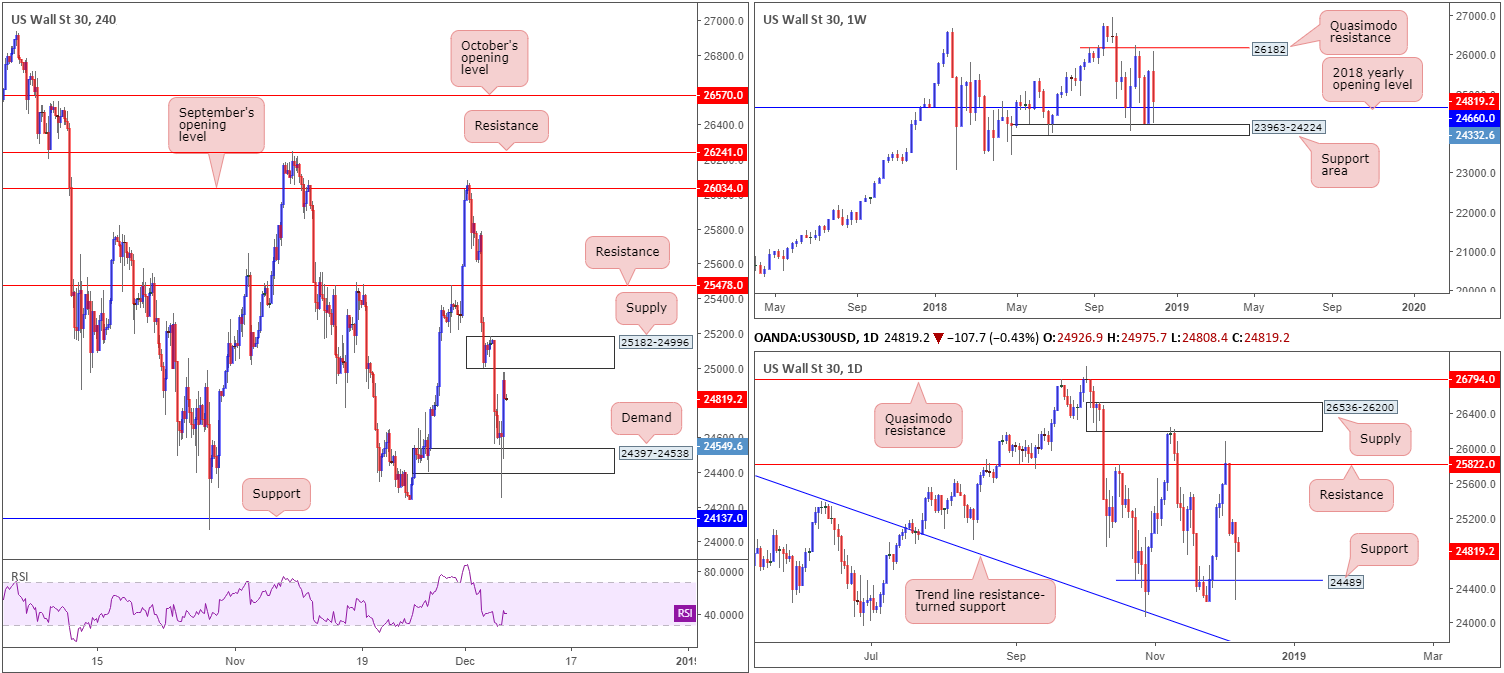
Picking things up from the top this morning, the research team notes weekly price is defending its 2018 yearly opening level at 24660 after coming within striking distance of a support area priced in at 23963-24224. Further upside from this point has the Quasimodo resistance at 26182 to target.
Closer analysis brings in daily support at 24489. This is a support due to it being an ignored Quasimodo support and, therefore, likely holding unfilled buy orders. In the event buyers maintain an upside presence from here, resistance plotted at 25822 is the next hurdle in view.
Wall Street chalked up an impressive U-turn following a stab to lows of 24252, which witnessed a rather aggressive whipsaw take shape through H4 demand at 24397-24538. Despite a marked improvement in risk sentiment, the Dow still concluded Thursday’s segment in negative territory, down 0.92%.
Areas of consideration:
In view of our technical reading, the higher-timeframe picture shows buying could be the way forward. However, with H4 supply at 25182-24996 positioned nearby, along with stop-loss orders likely ripped from underneath H4 demand at 24397-24538 yesterday, a medium-term selloff could also be in the offing.
Given the conflicting signals evident in this market at the moment, the research team has labelled the index as flat – neither a long nor short position appears attractive at the moment.
Today’s data points: US Non-Farm Employment Change, Average Hourly Earnings m/m and Unemployment Rate; US Prelim UoM Consumer Sentiment; FOMC Member Brainard Speaks.
XAU/USD (Gold):
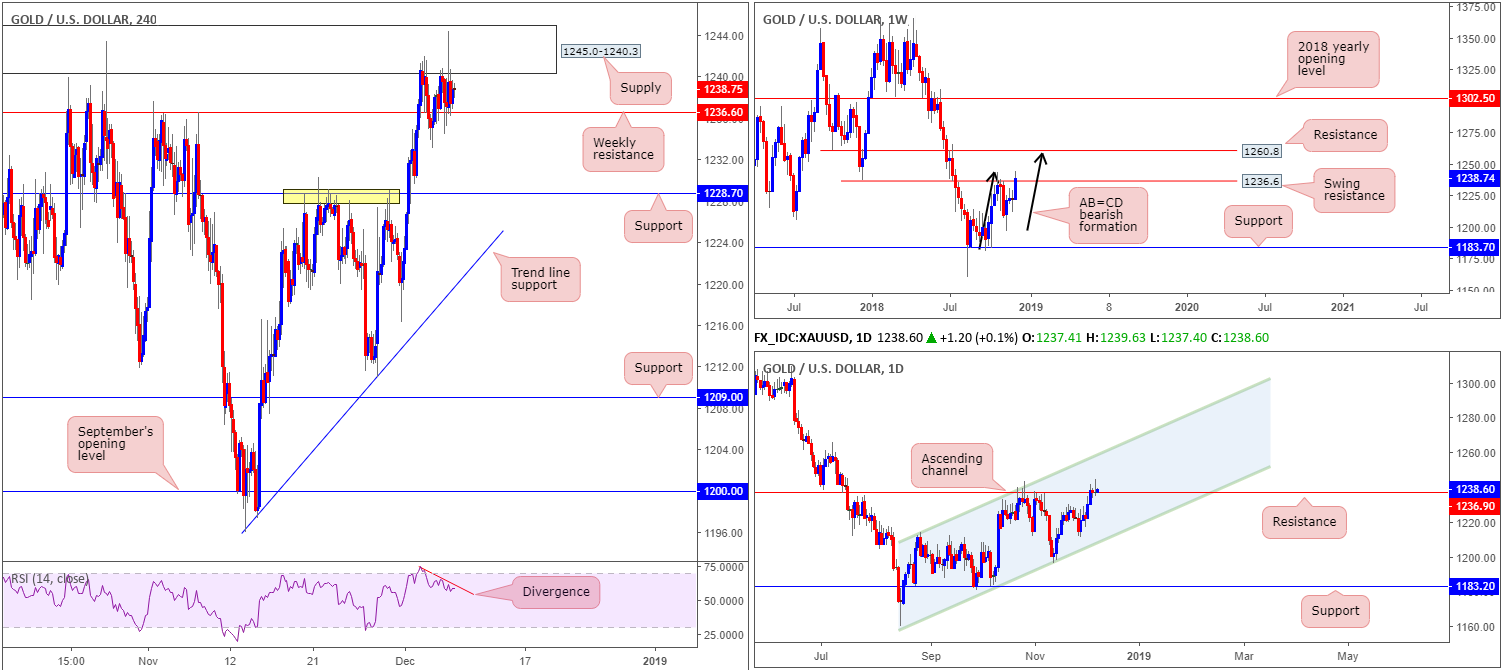
Gold prices are effectively unmoved this morning, registering only a 0.03% change Thursday. Given this lackluster performance, much of the following briefing will echo thoughts put forward in yesterday’s report…
The higher-timeframe technical picture shows weekly price attempting to cross above its swing resistance plotted at 1236.6. Should price continue to emphasize a bullish presence from here, resistance seen at 1260.8 is likely the next hurdle in view. What’s also interesting about this level from a technical perspective is it converges closely with an AB=CD bearish completion point (black arrows).
Along the same vein, daily movement is trying to overthrow resistance at 1236.9. In the event further buying is observed on this scale, channel resistance (etched from the high 1214.3) is seen overhead. Note this ascending level also fuses reasonably closely with the weekly resistance mentioned above at 1260.8.
A closer read of price action on the H4 timeframe shows the candles responding from supply at 1245.0-1240.3, though struggling to overcome weekly resistance at 1236.6, which is now acting support on this timeframe. In the event a decisive H4 close takes shape beneath 1236.6, further selling towards H4 support at 1228.7 is likely to be tested. Another key point worth noting is the RSI indicator is currently displaying a divergence reading.
Areas of consideration:
With sellers showing limited activity around higher-timeframe resistance at the moment, this is a challenging market to sell. If H4 price closes beneath 1236.6, however, and retests the level firmly as resistance, a sell on the back of this formation could be an option (stop-loss orders can be positioned above the rejecting candle).
The use of the site is agreement that the site is for informational and educational purposes only and does not constitute advice in any form in the furtherance of any trade or trading decisions.
The accuracy, completeness and timeliness of the information contained on this site cannot be guaranteed. IC Markets does not warranty, guarantee or make any representations, or assume any liability with regard to financial results based on the use of the information in the site.
News, views, opinions, recommendations and other information obtained from sources outside of www.icmarkets.com.au, used in this site are believed to be reliable, but we cannot guarantee their accuracy or completeness. All such information is subject to change at any time without notice. IC Markets assumes no responsibility for the content of any linked site. The fact that such links may exist does not indicate approval or endorsement of any material contained on any linked site.
IC Markets is not liable for any harm caused by the transmission, through accessing the services or information on this site, of a computer virus, or other computer code or programming device that might be used to access, delete, damage, disable, disrupt or otherwise impede in any manner, the operation of the site or of any user’s software, hardware, data or property


