
Key risk events today:
RBA Monetary Policy Statement; New Zealand Inflation Expectations q/q; Canada Employment Change and Unemployment Rate; US Non-Farm Payrolls Release.
(Previous analysis as well as outside sources – italics).
EUR/USD:
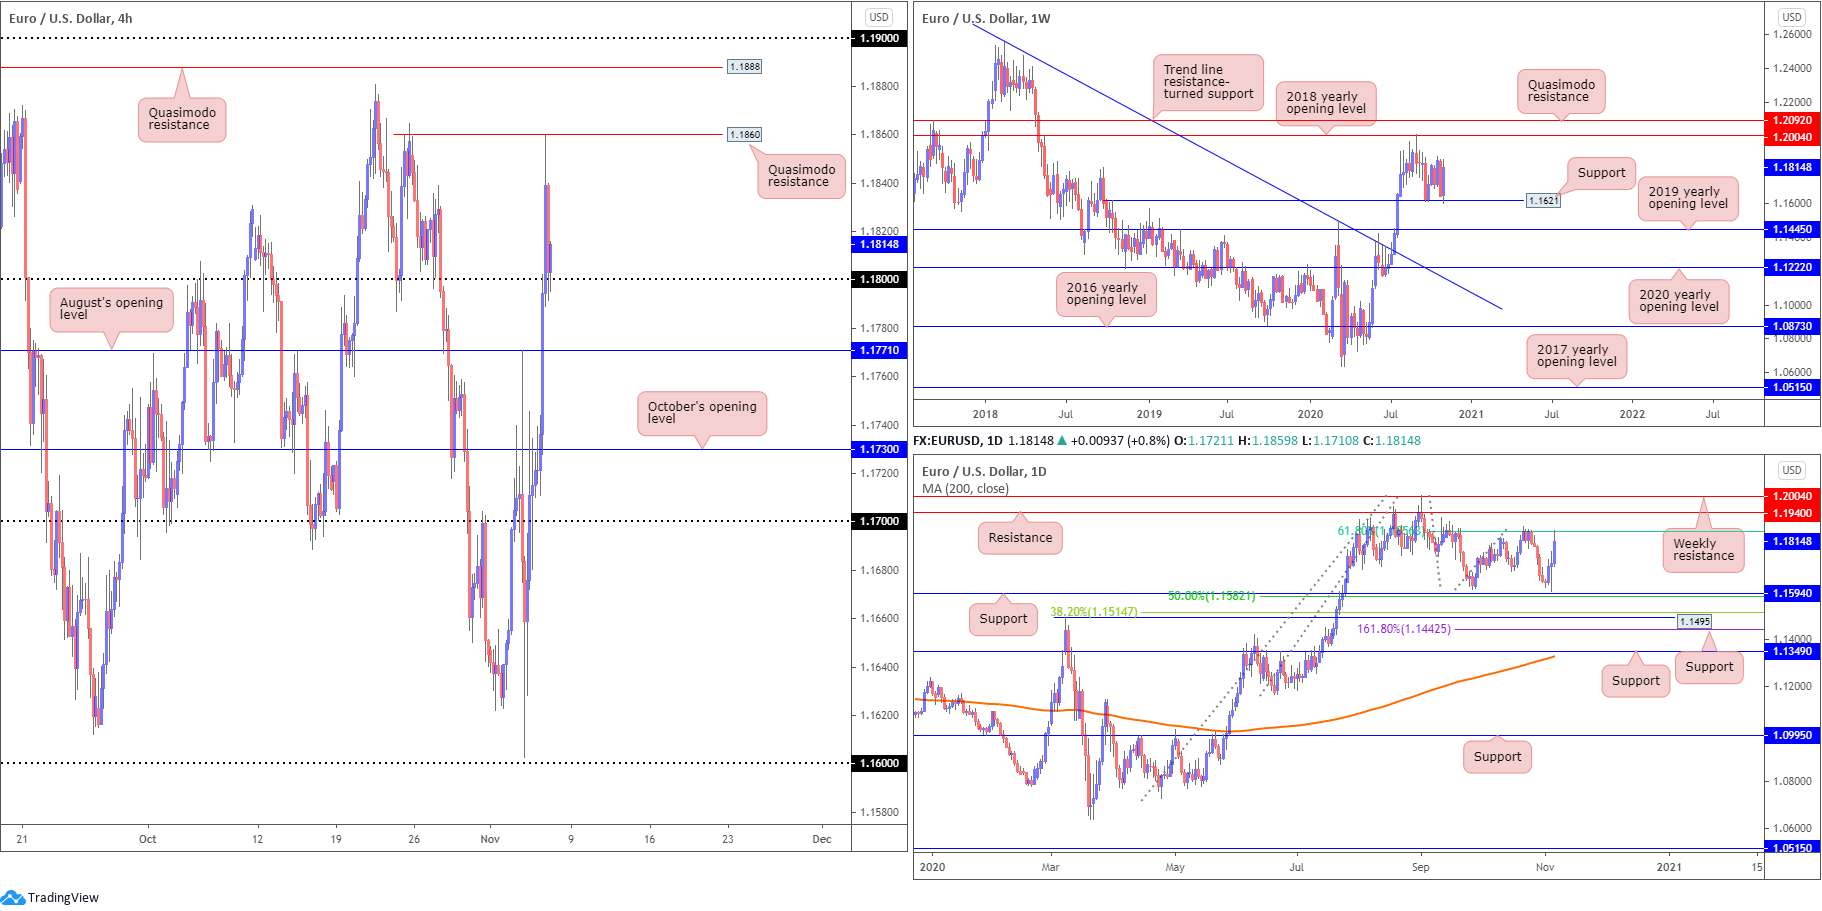
EUR/USD rotated lower a touch south of two-week tops Thursday, following another wave of upside, bolstered by USD depreciation amidst healthy risk appetite.
Technical selling surfaced off Quasimodo resistance on the H4 timeframe at 1.1860, motivating a correction back to the 1.18 neighbourhood, which, as you can see, holds as support for the time being. Should buyers strengthen their grip and overthrow 1.1860 today, Quasimodo resistance at 1.1888 is in view, followed closely by the 1.19 handle. Failure to hold 1.18, however, moves August’s opening value at 1.1771 into the playing field.
From the weekly timeframe, price continues to feed off support at 1.1621. Continuous buying from here targets the 2018 yearly opening value at 1.2004, while dipping a toe in lower territory shines the spotlight on the 2019 yearly opening value at 1.1445.
The daily timeframe recently engaged with a 61.8% Fibonacci retracement ratio at 1.1856, two days after rebounding just north of support at 1.1594 and nearby 50.0% retracement ratio at 1.1582.
Areas of consideration:
- The 1.18 rebound on the H4 faces resistance from the daily timeframe (8% Fibonacci retracement ratio at 1.1856), though at the same time weekly price recently rotated from support at 1.1621. Recognising the EUR/USD has displayed an uptrend since March, a H4 bullish candlestick pattern formed off 1.18 might be enough to impress conservative buyers.
- Should attempts to hold 1.18 fail, August’s opening value at 1.1771 is likely to be viewed as the next level of consideration on the H4.
GBP/USD:
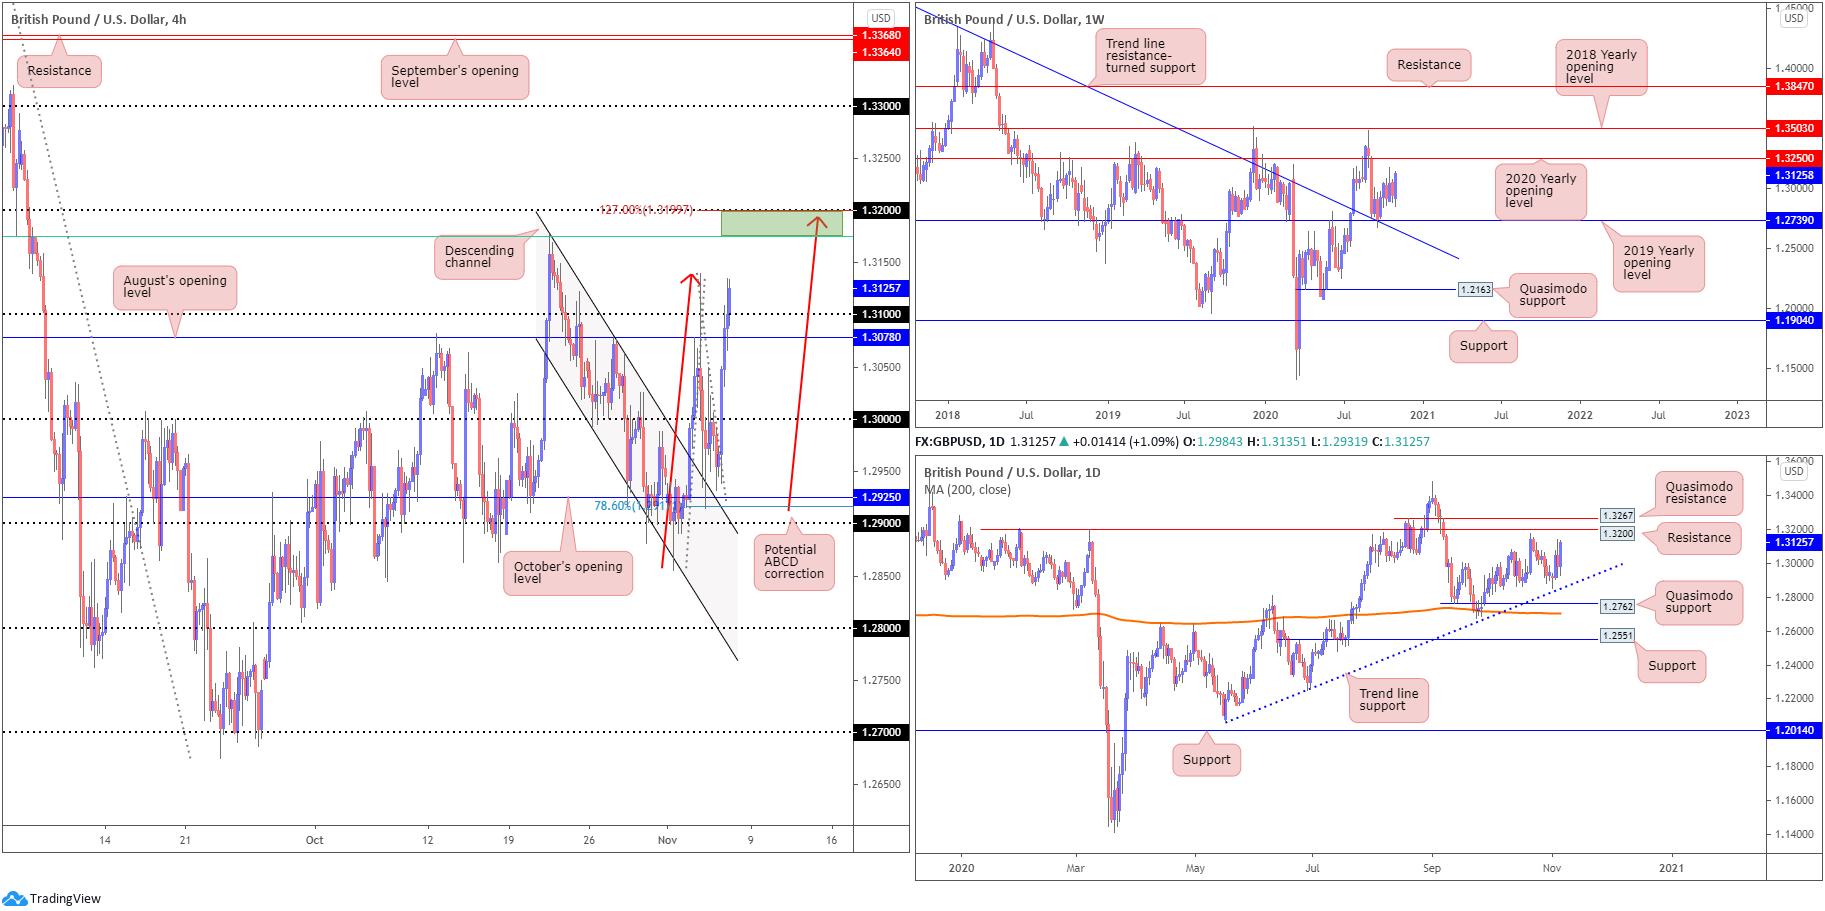
Strengthened on the back of the US dollar index crunching below 93.00 Thursday, cable finished the European session on the front foot. Chart studies indicate H4 is attempting to oust the 1.31 handle, perhaps targeting the 1.32 area, joined by a potential ABCD pullback (red arrows) at 1.3192 (and a 1.27 BC projection point at 1.3199 along with a 61.8% Fibonacci retracement ratio at 1.3174 [green line]).
Weekly price, in the shape of a bullish reversal candle, is on track to reach the 2020 yearly opening value from 1.3250. In conjunction with the weekly timeframe, daily price demonstrates scope to approach resistance at 1.3200.
Areas of consideration:
- Weekly and daily timeframes display room to move higher.
- With higher timeframes voicing an absence of resistance, a H4 close above 1.31 could spark breakout buying today, targeting the 1.32 region (represents daily resistance and is also surrounded by H4 ABCD resistance).
- 32, despite weekly showing room to move towards 1.3250, could also offer a bearish platform.
AUD/USD:
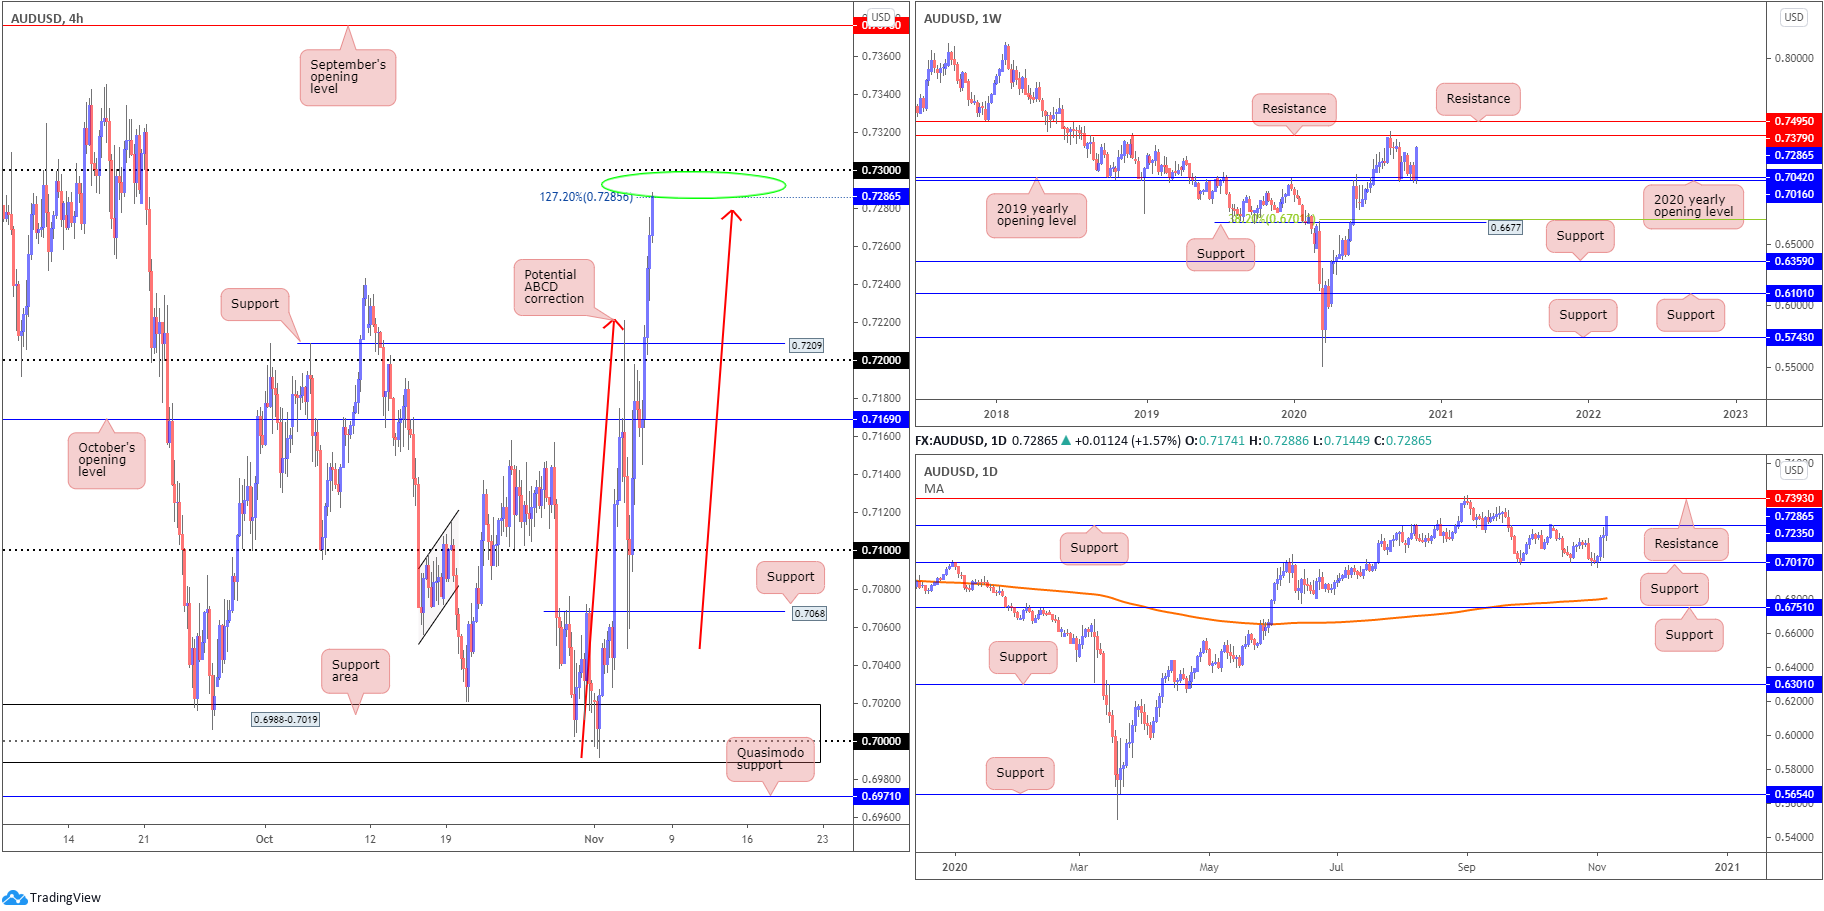
An outperformer on the day, the Australian dollar rallied nearly 1.4 percent against a waning US dollar on Thursday, boosted amid healthy risk appetite.
Price action continues to extend its position north of the 2020 (0.7016) and 2019 (0.7042) yearly opening values on the weekly timeframe, with current price smothering the prior week’s losses and pointing to a possible test of resistance at 0.7379. Based on the daily timeframe, yesterday pushed through resistance from 0.7235 (now a serving support), turning the spotlight towards resistance at 0.7393 (sited just above weekly resistance at 0.7379).
H4, thanks to Thursday’s upbeat tone, is now touching gloves with an interesting area of resistance, composed of the 0.73 handle and an ABCD resistance (red arrows) at 0.7279 (along with a 127.2% Fib projection point at 0.7285).
Areas of consideration:
- Despite ABCD resistance merging closely with 0.73, sellers appear to have their work cut out for them – both weekly and daily charts reveal room to move beyond 0.73 to at least 0.7379 (weekly resistance).
- Should sellers make an appearance off 0.73, however, a correction to H4 support at 0.7209/0.72 handle could be seen.
USD/JPY:
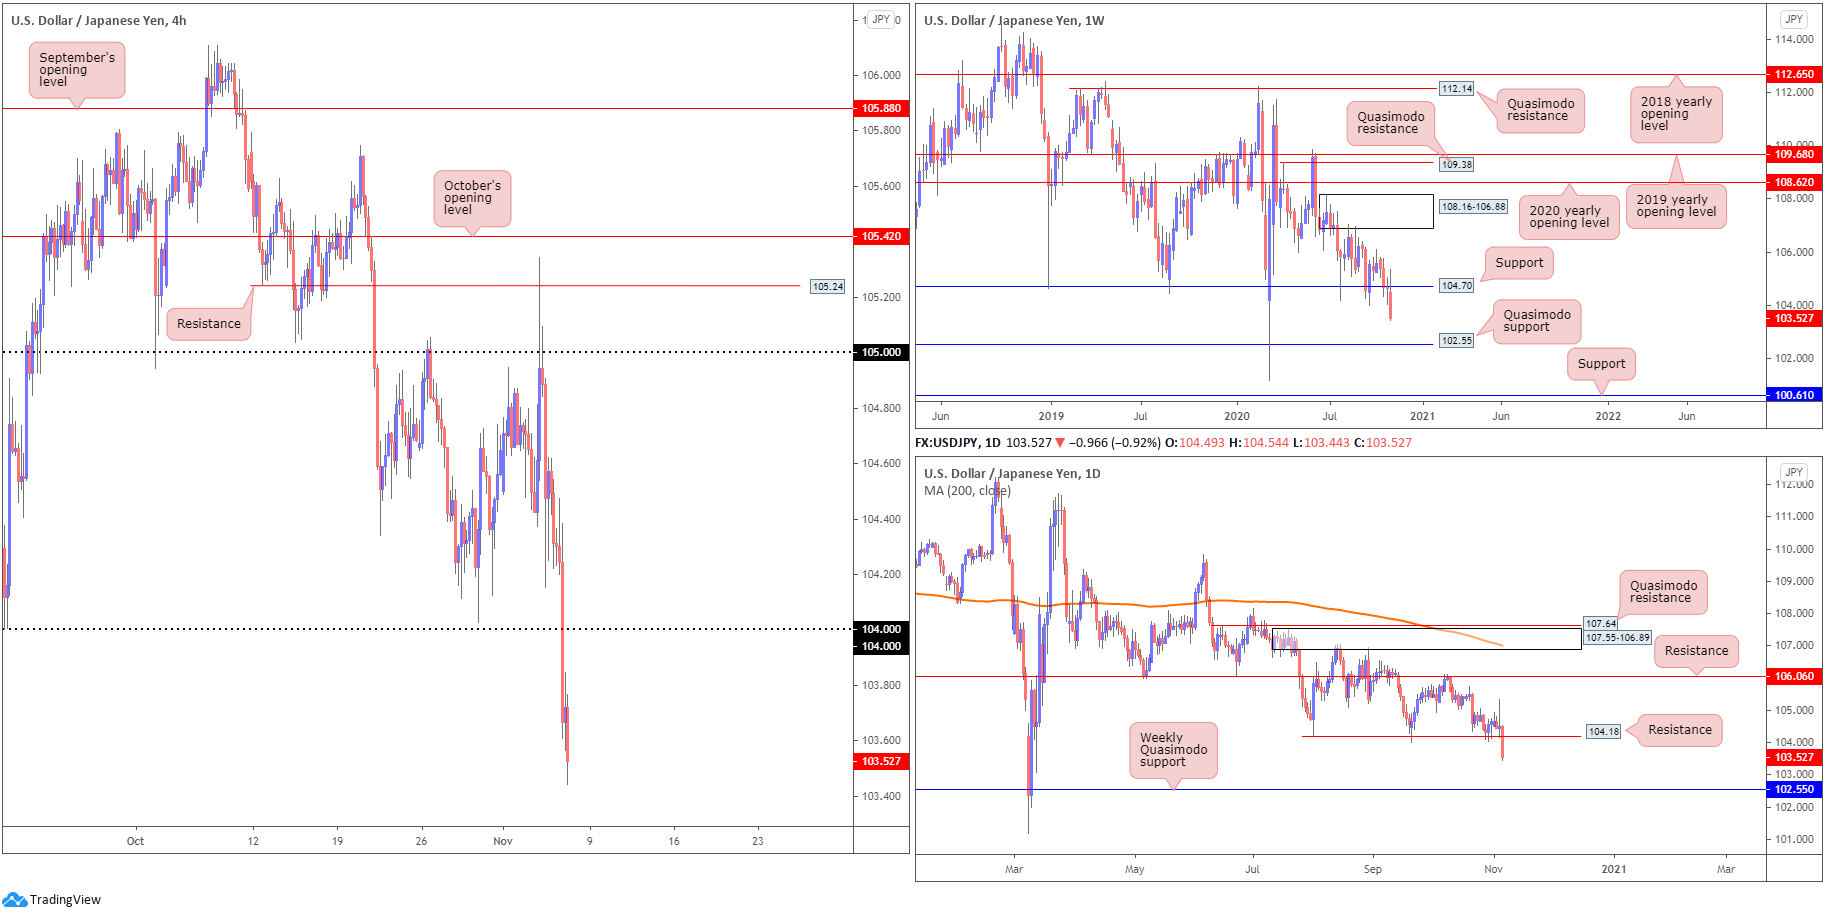
Following Wednesday’s aggressive reaction from H4 resistance at 105.24, Thursday intensified losses and plummeted to multi-month lows amid broad USD weakness across the board.
After penetrating 104 to the downside on the H4, sell-stops triggered further selling and has (albeit not seen on the screen) shined the spotlight on Quasimodo support at 103.21, followed by the 103 handle.
Long-term support at 104.70 on the weekly timeframe appears to have been submerged. Quasimodo support at 102.55 offers a feasible target beyond current support. Movement on the daily timeframe also crushed support at 104.18 (now acting resistance), potentially setting the stage for an approach to the weekly Quasimodo support mentioned above at 102.55.
Areas of consideration:
- Sentiment currently favours sellers.
- With limited resistance seen on the H4 scale right now, traders may have to consider drilling down to the lower timeframes in order to secure a bearish position. Irrespective of the entry technique employed, H4 Quasimodo support at 103.21 offers a reasonably logical target.
USD/CAD:
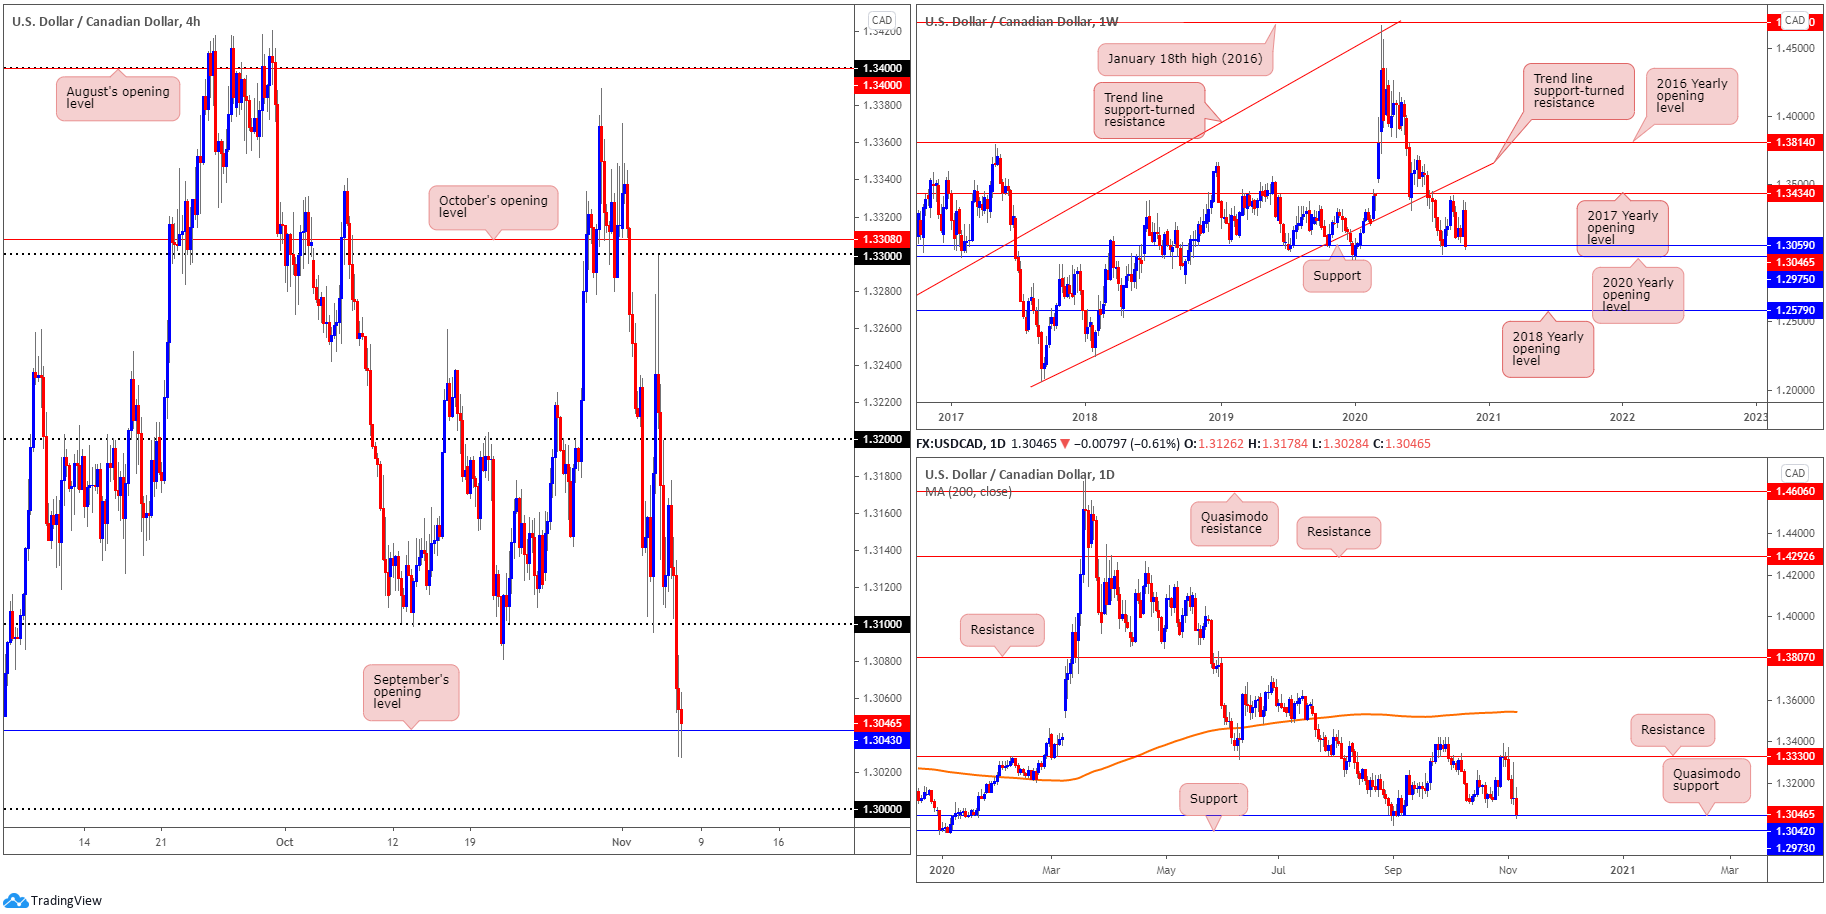
Aggressive selling overtook the US dollar on Thursday, dragging USD/CAD lower along with it. Recent hours witnessed H4 overthrow 1.31 to the downside and shake hands with September’s opening value from 1.3043. A rally to retest 1.31, therefore, could be on the cards. Lack of buying off 1.3043, however, shifts the key figure 1.30 into sight.
The technical landscape on the weekly timeframe shows price recently collided with support priced in at 1.3059 (plotted north of the 2020 yearly opening value at 1.2975), after failing to reach the 2017 yearly opening value at 1.3434. The story on the daily timeframe, after decisively navigating south of resistance at 1.3330, reveals Quasimodo support at 1.3042 entered the fray yesterday.
Areas of consideration:
- September’s opening value at 1.3043 is interesting support on the H4, having seen the level join closely with both weekly support from 1.3059 and daily Quasimodo support at 1.3042.
- 30 is also a key level to watch. This barrier, in addition to daily support at 1.2973, which essentially marks the same base as weekly support at 1.2975 (2020 yearly opening value), potentially offers a strong floor.
USD/CHF:
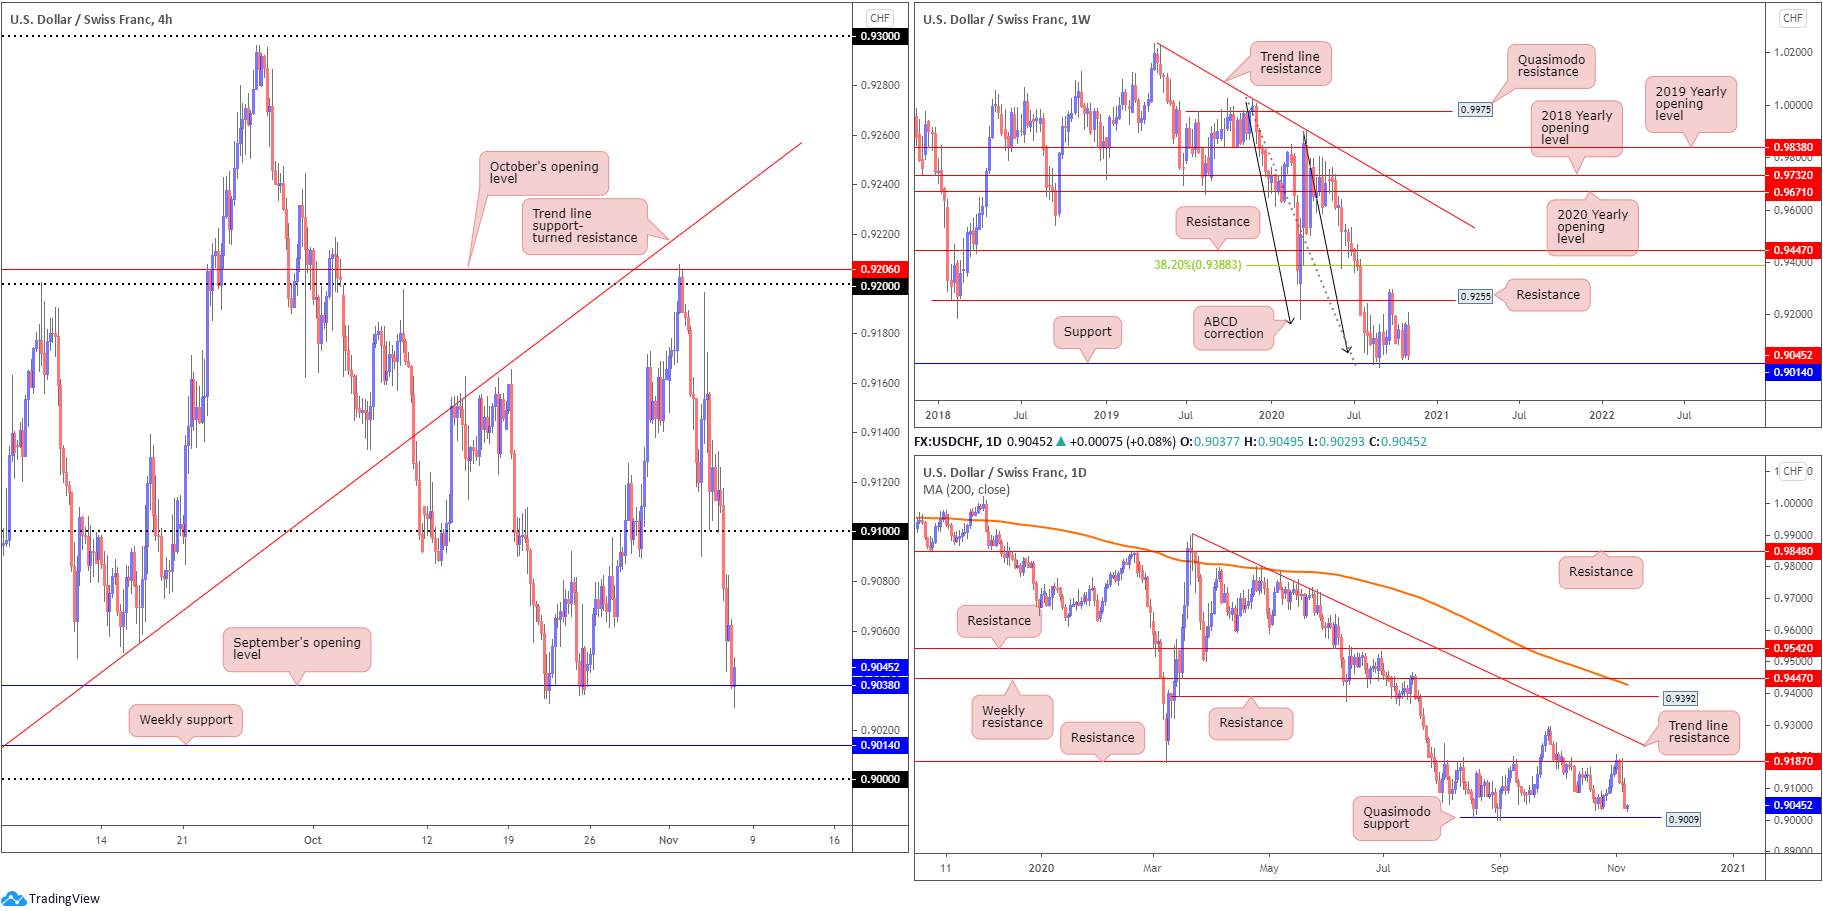
In the shape of three consecutive bearish days, weekly price is within striking distance of support at 0.9014, a level dovetailing closely with ABCD support at 0.9051. In similar fashion, daily flow is also seen nearing a Quasimodo support from 0.9009.
Therefore, from the higher timeframes we have support between 0.9009/0.9014 to focus on.
Lower on the curve, H4 reveals September’s opening value at 0.9038 offering support at the moment, following Thursday’s 0.8% decline. A break lower here, as can be seen on the chart, throws weekly support at 0.9014 in the mix, followed by the key figure 0.90.
Areas of consideration:
- While September’s opening value at 0.9038 has performed well as support in the past, it may be time for higher timeframe flow to take out this level and test 0.9009/0.9014 (daily/weekly support). With this, traders are also urged to take into consideration the 0.90 handle on the H4.
- Traders considering long positions out of 0.90/0.9014 may also want to note the trend in this market has been lower since April 2019 (see weekly timeframe).
Dow Jones Industrial Average:
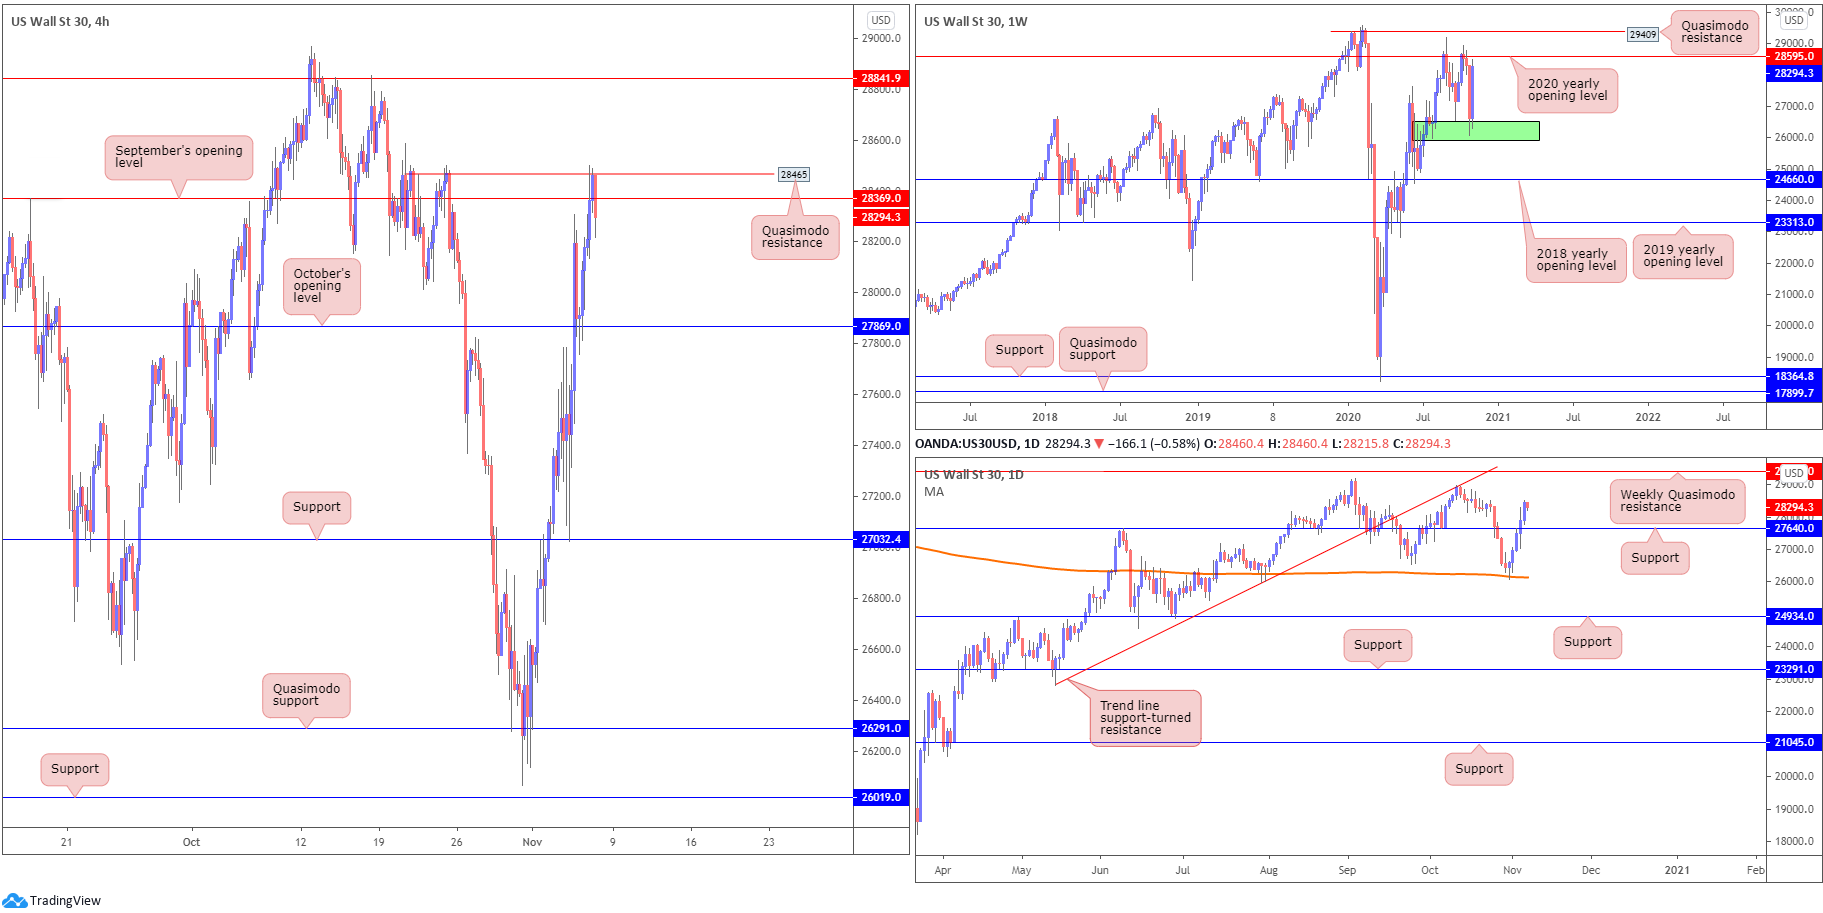
US equities extended on recent gains, with all major indices concluding on the front foot. The Dow Jones Industrial Average advanced 542.52 points, or 1.95%, the S&P 500 climbed 67.01 points, or 1.95% and the Nasdaq traded higher by 300.15 points, or 2.59%.
The rebound from weekly demand at 25916-26523 (green) has been quite something, so far reclaiming all of the prior week’s losses and drawing the unit towards the 2020 yearly opening value at 28595.
Together with the robust buying out of weekly demand, daily unseated resistance at 27640 (now acting support) in recent trading, which technically, could see buyers shoot for weekly Quasimodo resistance at 29409 (sited above weekly resistance at 28595).
H4, following a support retest at 27032, conquered October’s opening value at 27869 and retested the level as support on Thursday. The latter consequently opened up space to reach for September’s opening value at 28369 and Quasimodo resistance at 28465.
Areas of consideration:
- H4 shows resistance may develop off the Quasimodo formation at 28465 and September’s opening value at 28369. Though before serious sellers make an appearance, a pop higher to draw in weekly resistance at 28595 may occur (the 2020 yearly opening value).
- Although the daily timeframe suggests further upside is a possibility, the fact we now have H4 resistance and nearby weekly resistance to contend with might deter additional long positions into the week’s end.
XAU/USD (GOLD):
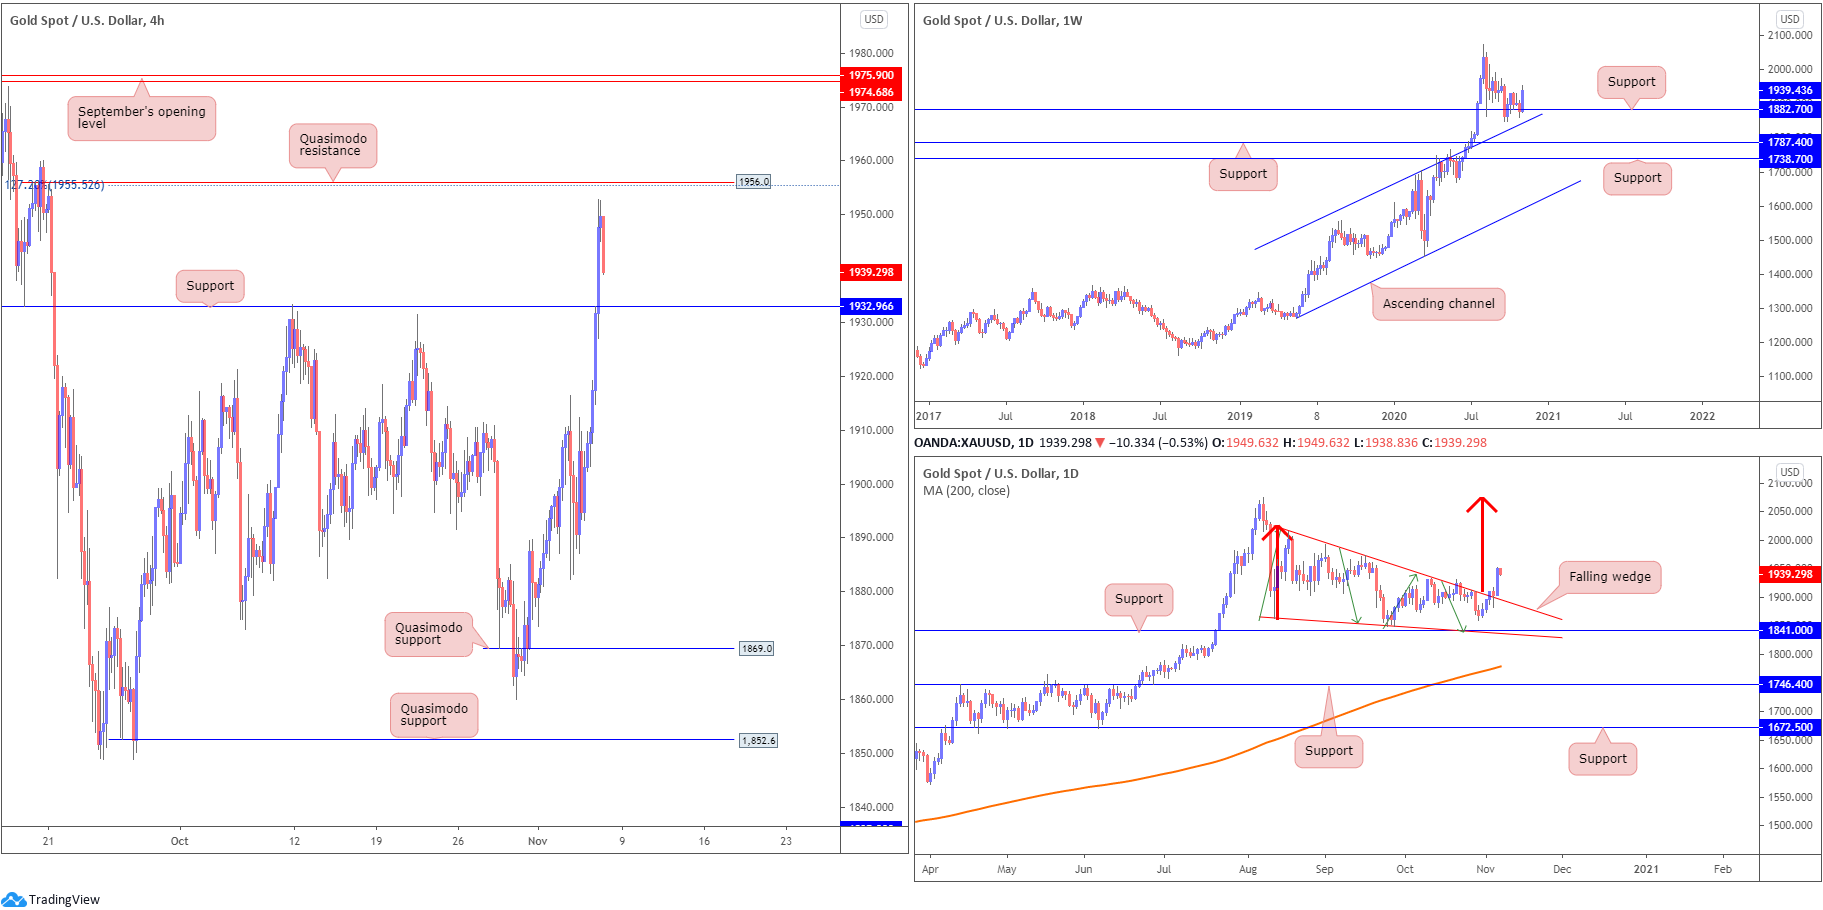
Working our way from the top this morning, buyers are clearly making progress off support at $1,882 on the weekly timeframe, recognised just north of channel resistance-turned support, taken from the high $1,703. Should a wave of buying emerge, long-term traders’ crosshairs are perhaps focussed on the all-time peak $2,075.
The daily timeframe has been in the process of creating a falling wedge pattern between $2,015 and $1,862 since mid-August (the lower boundary also lines up closely with support at $1,841). Thursday’s 2.5% advance saw the precious metal firmly take out the upper edge of the falling wedge, with pattern traders eyeballing the falling wedge take-profit target (red arrows) at around all-time highs from $2,075. This, together with gold trending decisively higher since 2016 (although price has been trending higher much longer than this overall), may encourage further buying today and next week.
Across the page on the H4 chart, Thursday ran through resistance at $1,932 and realised highs just south of Quasimodo resistance at $1,956 and a 127.2% Fibonacci projection point at $1,955. As evident from the chart, however, a correction is in the process of forming, highlighting a possible $1,932 retest.
Areas of consideration:
- Long term, the breakout above the daily falling wedge could spark sizeable bullish moves off weekly support ($1,882). This may have candles reach for the daily falling wedge take-profit target around $2,075.
- Assuming longer-term bulls make an appearance, a H4 retest at $1,932 could be movement that interests buyers, particularly if the retest forms in the shape of a bullish candlestick pattern.
The accuracy, completeness and timeliness of the information contained on this site cannot be guaranteed. IC Markets does not warranty, guarantee or make any representations, or assume any liability regarding financial results based on the use of the information in the site.
News, views, opinions, recommendations and other information obtained from sources outside of www.icmarkets.com.au, used in this site are believed to be reliable, but we cannot guarantee their accuracy or completeness. All such information is subject to change at any time without notice. IC Markets assumes no responsibility for the content of any linked site.
The fact that such links may exist does not indicate approval or endorsement of any material contained on any linked site. IC Markets is not liable for any harm caused by the transmission, through accessing the services or information on this site, of a computer virus, or other computer code or programming device that might be used to access, delete, damage, disable, disrupt or otherwise impede in any manner, the operation of the site or of any user’s software, hardware, data or property


