
Key risk events today:
Canada Employment Change and Trade Balance; US Unemployment Rate, US Average Hourly Earnings m/m, US Non-Farm Employment Change, US Unemployment Rate.
(Previous analysis as well as outside sources – italics).
EUR/USD:
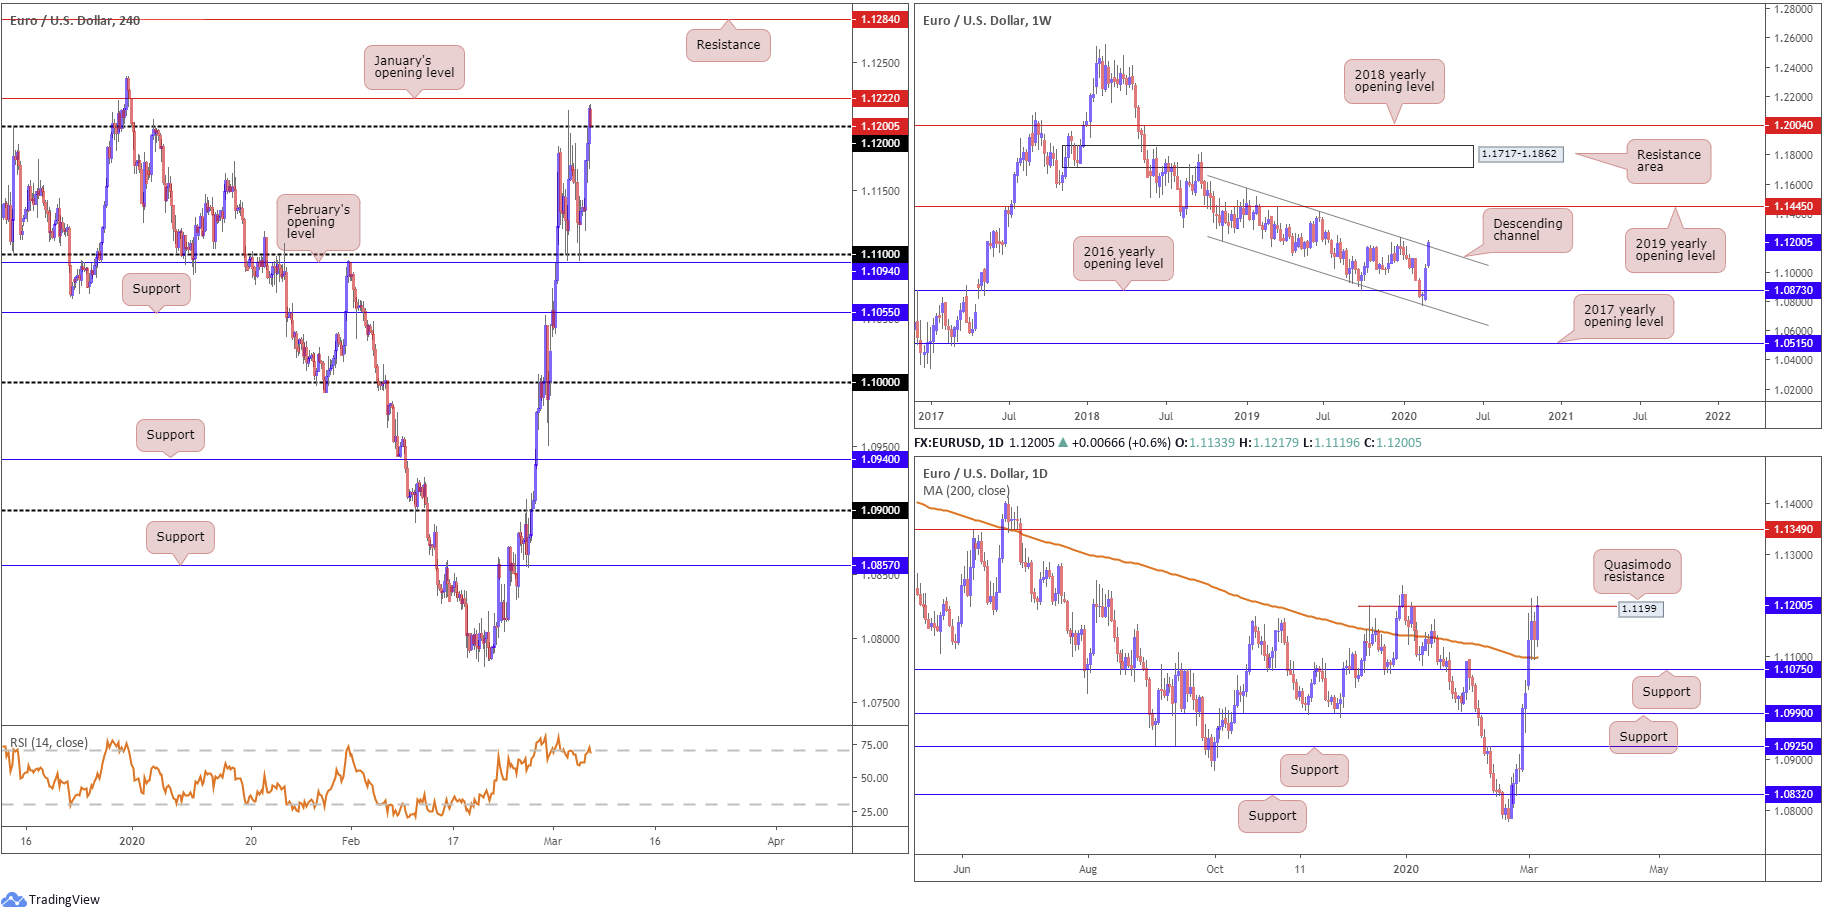
Regaining the 1.12 handle in recent trade, H4 price, leaving January’s opening level at 1.1222 unopposed, is now seen retesting the latter as support. The buck, despite a fleeting recovery Wednesday, was heavily offered Thursday, weighed on the back of waning US Treasury yields challenging all-time lows. Beyond 1.1222, traders face potential resistance around 1.1284.
EUR/USD weekly price recently touched, and somewhat bettered, channel resistance, extended from the high 1.1569. Sustained upside from here could ultimately land the unit at the 2019 yearly opening level from 1.1445. Recent movement follows a stronger-than-expected rotation off channel support, taken from the low 1.1109, and continued upside north of the 2016 yearly opening level at 1.0873.
Daily flow remains capped by Quasimodo resistance at 1.1199, after having shown resilience off the 200-day SMA (orange – 1.1098) on Wednesday. Limited supply is evident to the left of price north of 1.1199 until crossing swords with Quasimodo resistance at 1.1349.
Areas of consideration:
The breach of 1.12 to the upside is likely viewed as a bullish indicator. With January’s opening level at 1.1222 sited as possible resistance, as well as daily Quasimodo resistance at 1.1199 also perhaps hindering upside and weekly sellers likely still in play off channel resistance, buyers north of 1.12 contend with rocky ground.
A more conservative route for buyers above 1.12 may be to wait for a decisive H4 close above January’s opening level. That way, upside may be clear to at least H4 resistance mentioned above at 1.1284.
In the event sellers strengthen their grip and close back beneath 1.12 on the H4, however, bearish scenarios back to 1.11 could be in the offing.
GBP/USD:
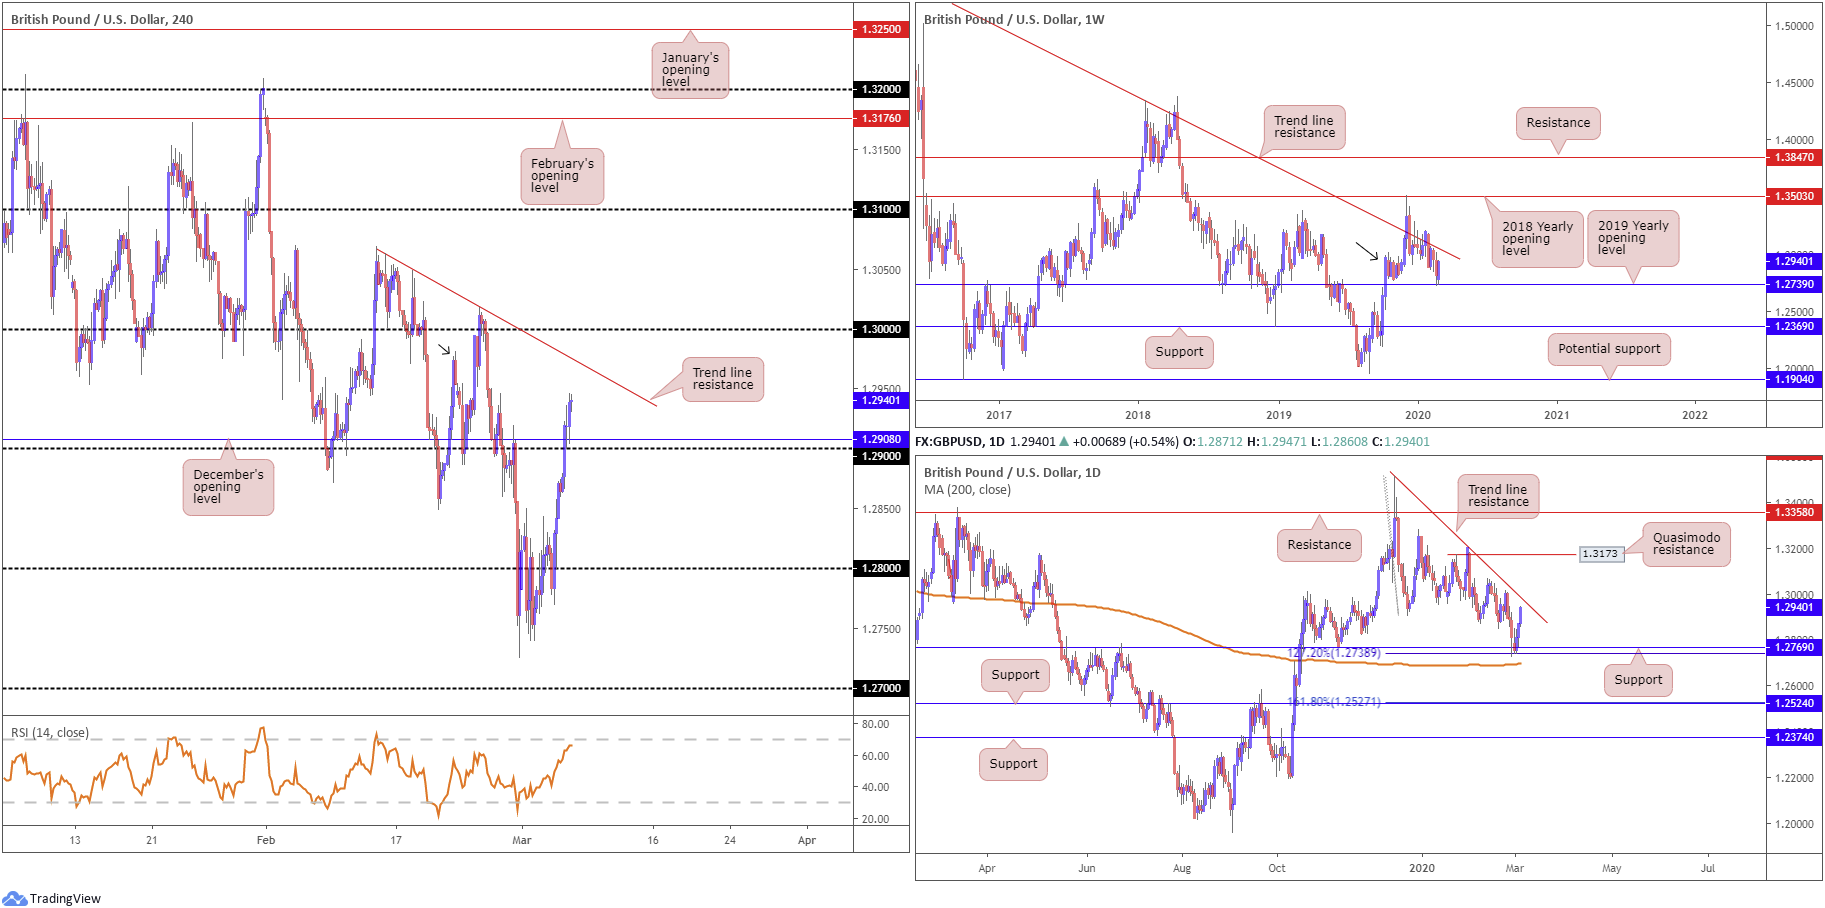
Sterling exploited broad dollar weakness Thursday, adding more than 60 points. Early London observed H4 overthrow 1.29 to the upside, as well as December’s opening level at 1.2908, swiftly followed by a retest going into US trading. Local trend line resistance, taken from the high 1.3069, is next on tap, with a break exposing the widely watched 1.30 figure. While Quasimodo resistance at 1.2981 is visible (black arrow), mentioned H4 structure is likely to take pole position. With respect to the relative strength index, we’re fast approaching overbought status and currently producing hidden bearish divergence.
The story on the bigger picture has weekly price interacting with the 2019 yearly opening level at 1.2739, off YTD lows. A breach of the said support may side-line hopes of recovery and shine the spotlight on support from 1.2369, though the likelihood of the unit now reaching long-term trend line resistance, etched from 1.5930, is a strong possibility.
In conjunction with the weekly timeframe, we can see price action on the daily timeframe poised to shake hands with trend line resistance, extended from the high 1.3514. This follows a stronger-than-expected recovery off support at 1.2769 and a 127.2% Fibonacci extension at 1.2738, closely shadowed by the 200-day SMA. Note the said SMA has been flattening since mid-October 2019.
Areas of consideration:
Each timeframe analysed exhibits scope to explore higher ground. A second retest at 1.29 will, therefore, likely be of interest to many traders, if noted upside targets have yet to enter the mix.
Conservative traders off 1.29 may opt to wait for additional confirmation to form before pulling the trigger, given round numbers being prone to whipsaws.
AUD/USD:
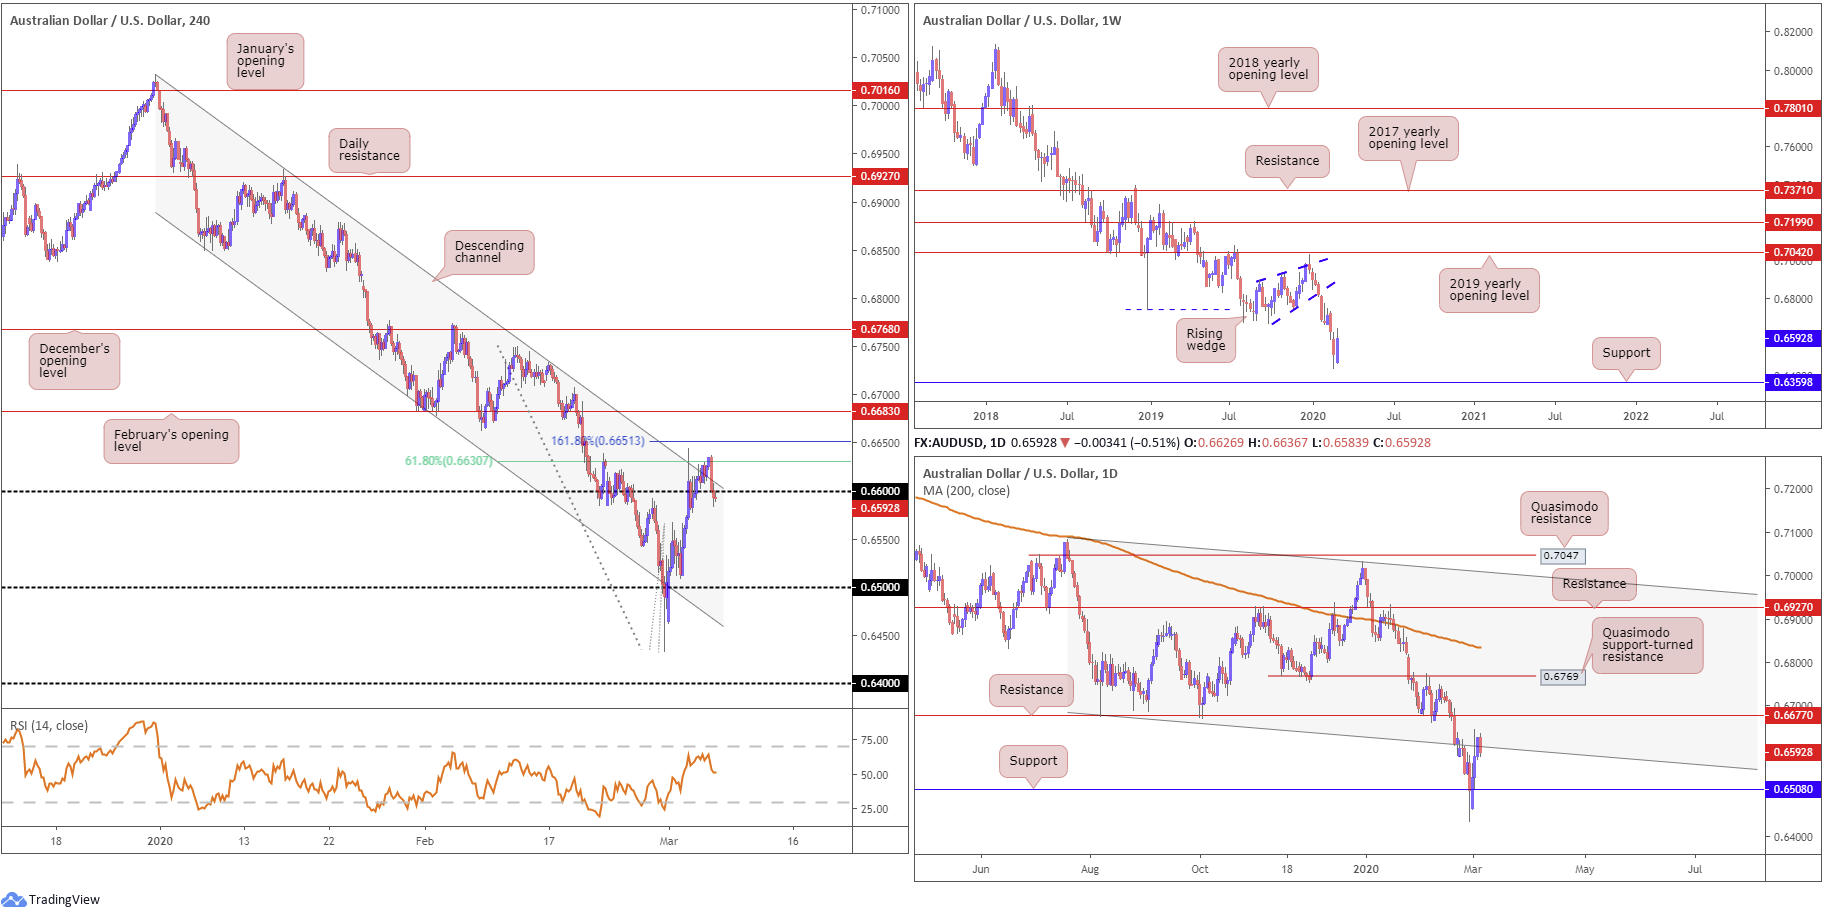
Snapping a three-day bullish phase, sellers strengthened their grip Thursday, guiding AUD/USD lower amid fresh global risk aversion weighing on perceived riskier currencies.
Technical resistance based on the H4 timeframe likely played a role in yesterday’s downside move. Capped by channel resistance, extended from the high 0.7031, a 61.8% Fibonacci retracement value at 0.6630 and a 161.8% Fibonacci extension point at 0.6651, the action marginally reclaimed 0.66 in recent hours. Though last Thursday’s top at 0.6591 could serve as support, logical support on the H4 scale can be seen around the 0.65 handle. Technicians will also note the relative strength index (RSI) turning lower south of overbought levels and testing the 50.00 value into the close.
Technical research on the daily timeframe has the unit suggesting scope for downside to support at 0.6508. Daily activity recently checked in with channel support-turned resistance, taken from the low 0.6677. Above here, nonetheless, could lead to resistance at 0.6677 making its debut.
AUD/USD on the weekly scale still, despite recent recovery this week, has eyes for support coming in at 0.6359. Eight out of nine weeks has seen the pair register losses, since topping a touch south of the 2019 yearly opening level at 0.7042, and completing a five-month rising wedge pattern. Note the primary trend has faced south since 2018, and we’re now testing decade lows in this market.
Areas of consideration:
The H4 close south of 0.66 is an interesting scenario, helping confirm seller intent off current H4 and daily resistances, targeting daily support underlined above at 0.6508, closely trailed by the 0.65 handle on the H4 timeframe.
Conservative traders may elect to wait and see if a retest forms at the underside of 0.66 before pulling the trigger; other traders may feel current price is a valid entry, knowing we’re beneath 0.66 off notable resistance.
USD/JPY:
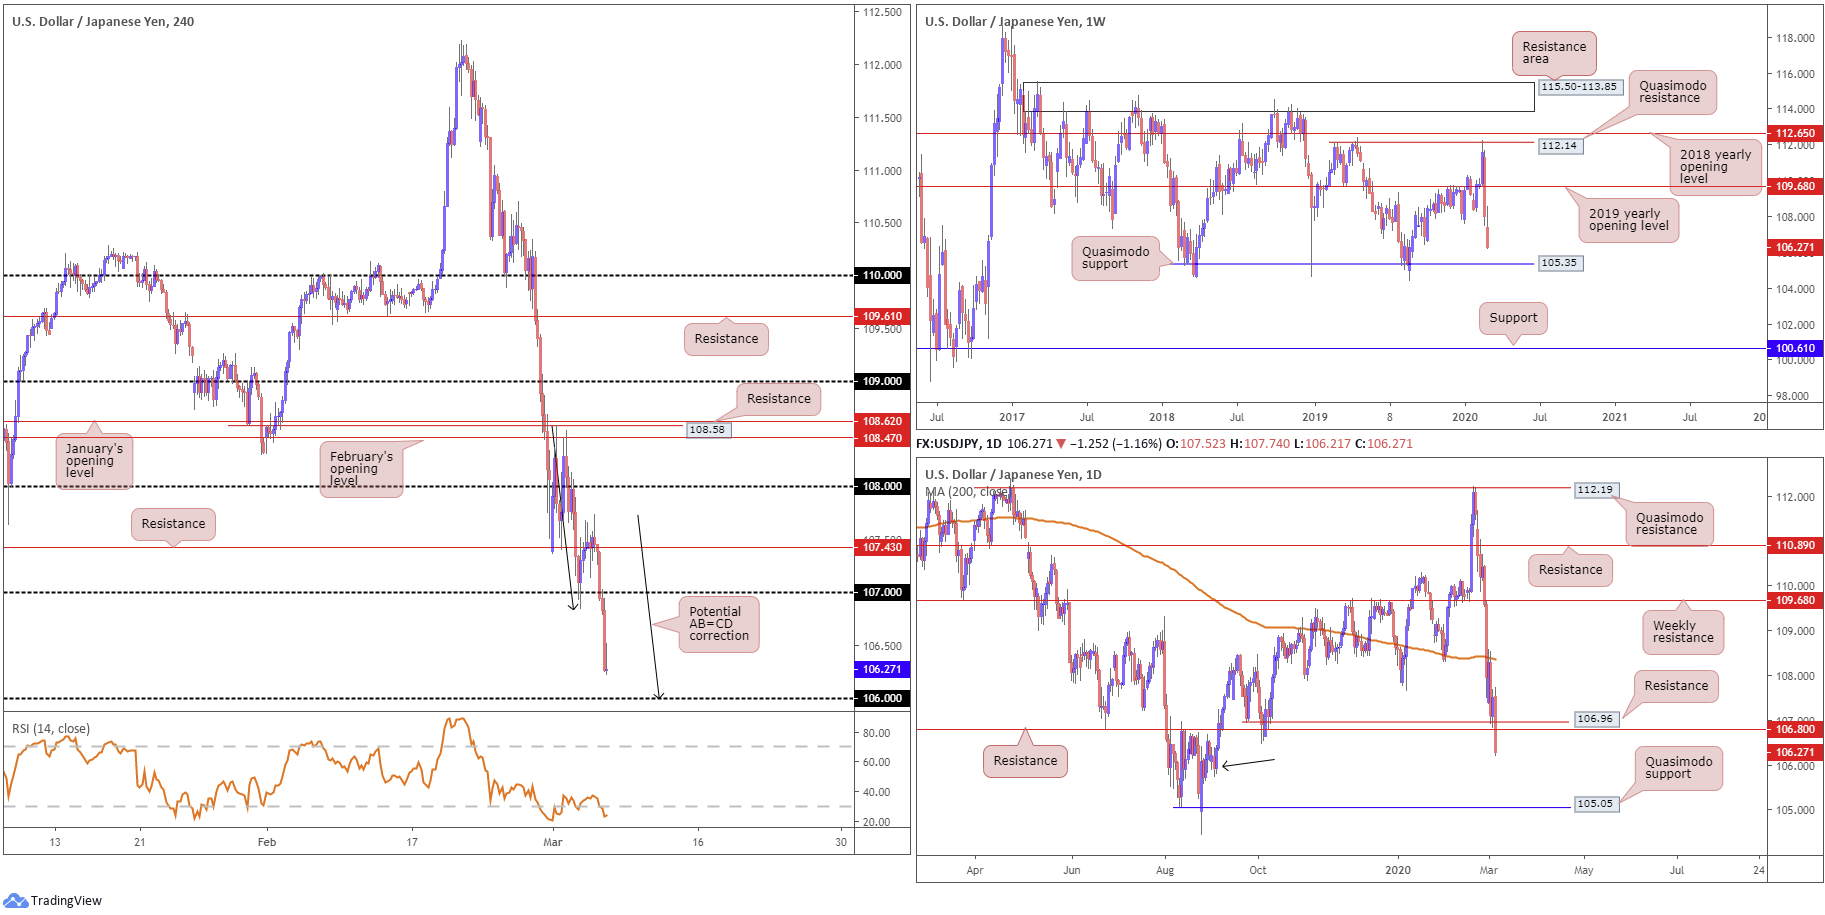
The US dollar ceded ground against the Japanese yen Thursday, pressured lower on the back of broad-based USD selling and softening US Treasury yields. Wednesday’s optimism faded, as European markets and Wall Street posted significant losses.
USD/JPY, based on the H4 timeframe, recently attempted to establish a bottom north of the 106 handle, after tunnelling through orders at 107. What’s interesting on this scale, from a technical perspective, is a potential AB=CD bullish correction forming at 107 (black arrows). Adding to this, the relative strength index (RSI) remains loitering within oversold waters, suggesting a pop back to 50.00 may soon take hold.
Crossing into higher-timeframe space, daily price swarmed Quasimodo support at 106.96, and support at 106.80, both now resembling possible resistance levels. Aside from possible support emerging from the 105.70ish neighbourhood (black arrow), the next port of call on this timeframe can be seen around Quasimodo support at 105.05.
The story on the weekly timeframe had price action record its largest weekly drop since July 2016 last week. Buying in this market could position price back around the 2019 yearly opening level at 109.68, whereas additional losses could see a Quasimodo formation off 105.35 enter view. Note this weekly Quasimodo support aligns closely with daily Quasimodo support mentioned above at 105.05.
Areas of consideration:
A recovery from 106 is an idea, having seen the approach forming by way of a H4 AB=CD correction and the RSI tackling oversold waters. Even so, traders with plans to fade this neighbourhood may find higher-timeframe opposition unsustainable. For this reason, we could be in for further loss beyond 106, which may prompt intraday bearish scenarios to the weekly Quasimodo support at 105.35.
USD/CAD:
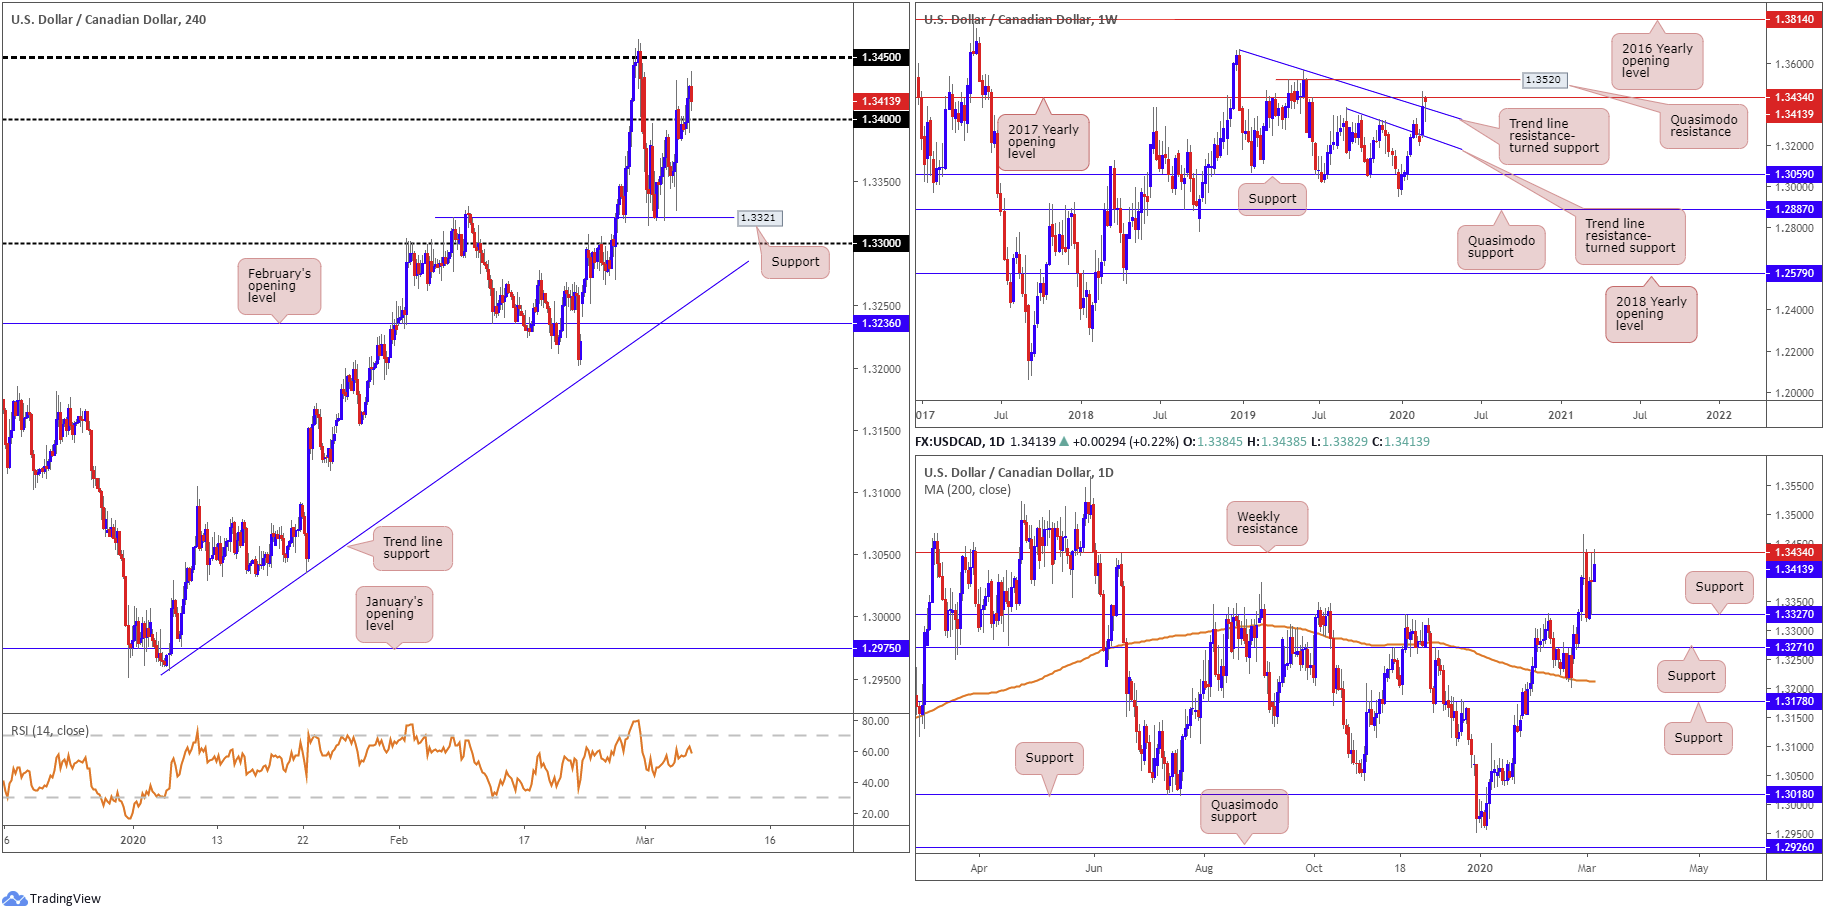
In recent sessions, USD/CAD stripped away remaining orders around 1.34 and clocked highs at 1.3438. Assuming we establish footing north of 1.34, a revisit of 1.3450 may be in store, a level which held price action lower last Friday. It might also interest some traders to note the relative strength index (RSI) is seen hovering just south of overbought ground.
The US dollar index remains vulnerable, giving up 97.00 and testing lows at 96.65, amid plummeting US Treasury yields on Thursday. BoC Governor Poloz also took to the stage, stating the bank is ready to cut rates further if needed to support growth and keep inflation on target.
Weekly price has buyers and sellers squaring off between resistance at 1.3434, the 2017 yearly opening level, and trend line resistance-turned support, from the high 1.3664. A break of the said resistance positions Quasimodo resistance at 1.3520 in the firing range. By the same token, daily price has the current weekly resistance also in play at 1.3434, while daily support resides around 1.3327.
Areas of consideration:
Intraday, buy stop-liquidity is likely consumed above 1.34, perhaps encouraging moves to 1.3450ish today. 1.34, if retested as support, therefore, may deliver a platform for potential long opportunities. Longer term, though, we face weekly resistance at 1.3434, despite price simultaneously holding off trend line resistance-turned support.
So, in a similar tone to Thursday’s analysis, the technical picture, particularly weekly flow, offers an indecisive tone right now, and may cause a bounce in either direction, defiling otherwise sound intraday setups.
USD/CHF:
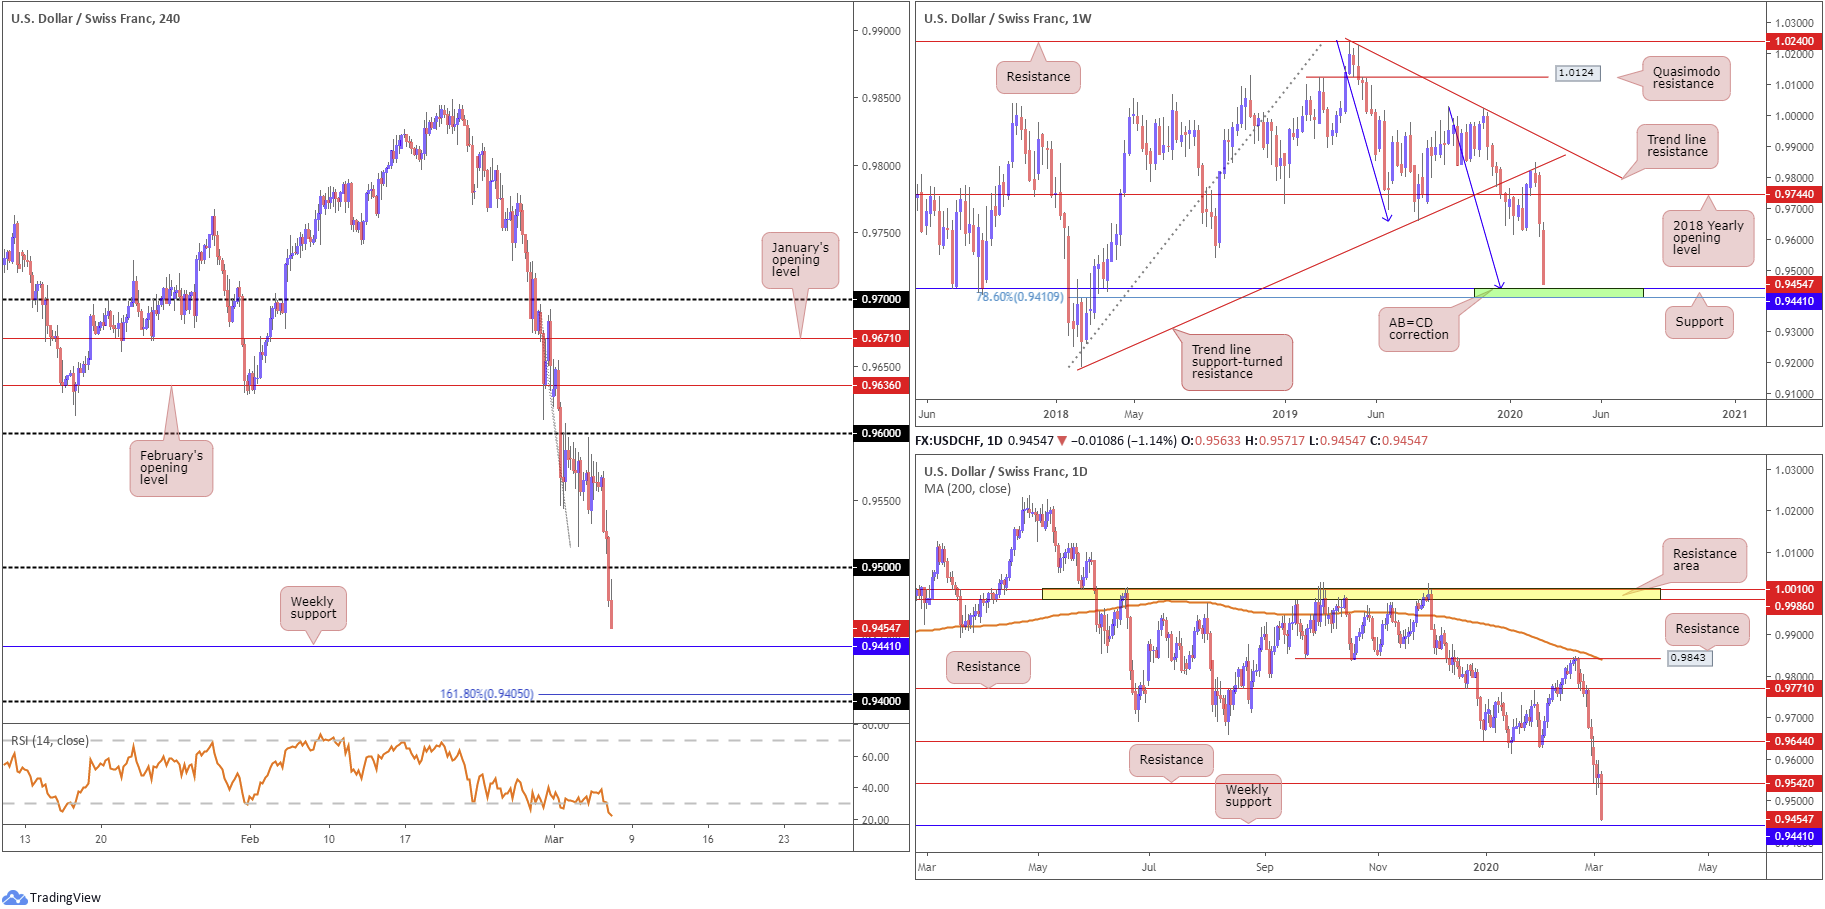
The safe-haven Swiss franc witnessed increased demand Thursday amid risk aversion, as global equity markets plummeted. Additionally, the US dollar index failed to maintain Wednesday’s recovery, running through 97.00 to lows at 96.65.
USD/CHF, based on the H4, burrowed through 0.95 and accelerated to the downside, hauling the relative strength index (RSI) to waters deep within oversold territory, currently trading around 22.50. After daily price swallowed support at 0.9542, support on the weekly timeframe at 0.9441 elbowed its way into the spotlight on the H4, daily and weekly timeframes.
Also of interest on the weekly timeframe is a long-term AB=CD correction (blue arrows) completing at the said weekly support level, bolstered by neighbouring support by way of a 78.6% Fibonacci retracement at 0.9410. A break through the aforementioned weekly support on the H4 scale has 0.94 in sight, located just south of a 161.8% Fibonacci extension point at 0.9405.
Areas of consideration:
The combination of weekly support at 0.9441, the weekly AB=CD bullish correction and nearby 78.6% Fibonacci retracement support on the weekly timeframe at 0.9410, may be sufficient to prompt a bout of short covering and maybe enough to entice fresh buyers into this market. However, traders may want to pencil in the possibility of a move to 0.94 on the H4 timeframe, before serious buyers step in, sited just south of 78.6% support on the weekly chart.
Dow Jones Industrial Average:
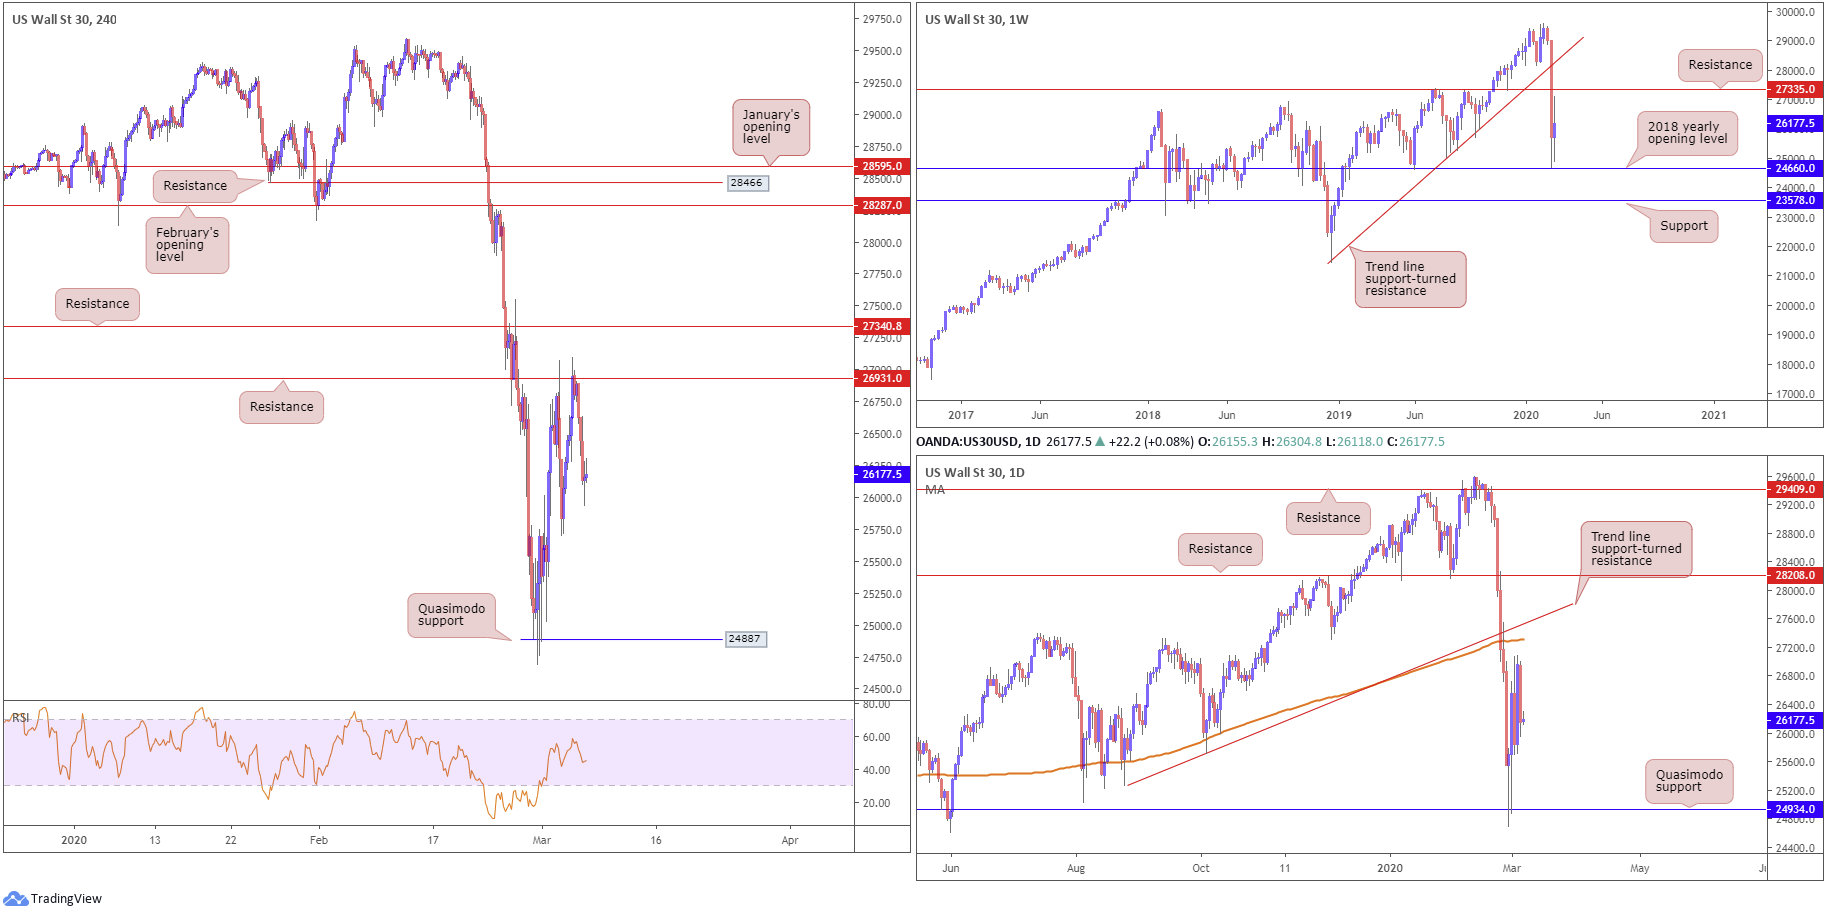
Major US benchmarks plummeted Thursday, with Treasuries clocking record lows, as investors bet the Federal Reserve will slash rates by another half percentage point at its meeting this month. The Dow Jones Industrial Average lost 969.58 points, or 3.58%; the S&P 500 also declined 105.11 points, or 3.36% and the tech-heavy Nasdaq 100 ended lower by 277.62 points, or 3.10%.
Technical movement on the weekly timeframe remains pretty much unchanged. Resistance is in focus at 27335, while support, in the form of the 2018 yearly opening level, at 24660, is stationed nearby. Breaking current support could lead to 23578 entering play. The aforementioned resistance is a key level in this market – expect the possibility of activity developing from this region if tested. A closer reading of price action on the daily timeframe reveals the index topped a few points south of the 200-day SMA (orange – 27305), closely followed by trend line support-turned resistance, taken from the low 25264.
Across the page on the H4 timeframe, we revisited familiar resistance at 26931 in early hours Thursday, and proceeded to head lower. With the lack of higher timeframe resistances in motion, a break of the 25700 March 3rd low is unlikely. The more appealing resistance on the H4 timeframe, in terms of technical studies, resides around 27340. Not only does it boast strong history, the level converges closely with weekly resistance at 27335 and daily resistances, the 200-day SMA and the trend line support-turned resistance.
Areas of consideration:
H4 resistance at 27340 is likely eyed as a potential ceiling, having noted surrounding confluence. A pullback from here will likely make its way to 26931, an acting support. However, moves beyond this base back to 25700 is also a possible scenario, re-opening the door for bearish themes, either on the downside breakout candle close (H4), or, for more conservative traders, a retest motion at the underside of 26931.
With focus drawn to 27340, traders may seek intraday bullish scenarios, with the line in the sand for longs set beneath 25700, and an upside target at 27340.
XAU/USD (GOLD):
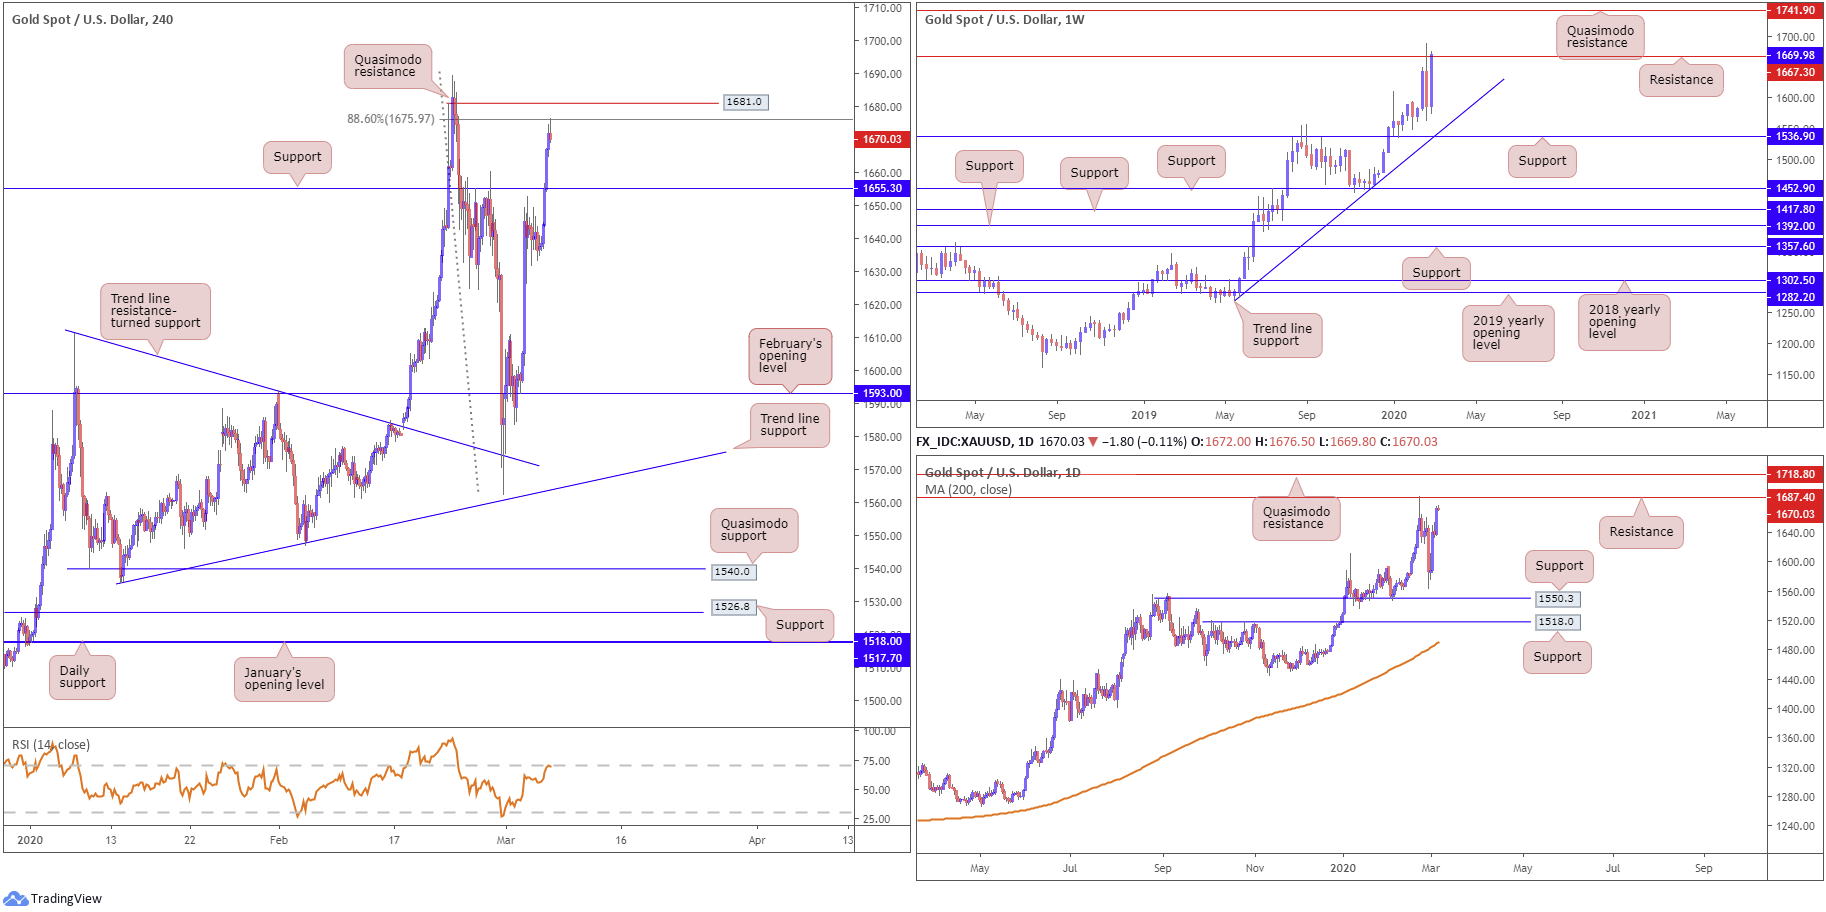
This week observed bullion stage a sharp rally, set to potentially break to a new high for the year. Supported by the recent emergency rate cuts and global equities spinning lower, as well as the 10-year Treasury yield hitting a new all-time low in recent trade, we can see weekly price threatening a close above resistance at 1667.3, which if it comes to pass, may clear the path north and expose Quasimodo resistance at 1741.9.
Resistance on the daily timeframe at 1687.4 remains in play. A close above the said level adds conviction to a run higher, targeting a daily Quasimodo resistance plotted at 1718.8.
Shorter-term movement on the H4 timeframe, nonetheless, recently crossed swords with a deep 88.6% Fibonacci retracement ratio at 1675.9. Traders may also note Quasimodo resistance resides close by at 1681.0. A pullback from either H4 resistance could draw support at 1655.3 back into the frame, whereas sustained bidding may entice daily resistance into view, mentioned above at 1687.4. Interestingly, the relative strength index (RSI) trades at overbought levels.
Areas of consideration:
A retreat from H4 structure at 1681.0/1675.9 is possible, with H4 support in wait at 1655.3. Traders considering fading the said resistances will likely wait for additional confirmation before committing, given the strength of the bulls right now.
Those interested in joining the current uptrend may find an entry north of daily resistance at 1687.4. At current price, H4 resistances may hinder upside.
The accuracy, completeness and timeliness of the information contained on this site cannot be guaranteed. IC Markets does not warranty, guarantee or make any representations, or assume any liability regarding financial results based on the use of the information in the site.
News, views, opinions, recommendations and other information obtained from sources outside of www.icmarkets.com.au, used in this site are believed to be reliable, but we cannot guarantee their accuracy or completeness. All such information is subject to change at any time without notice. IC Markets assumes no responsibility for the content of any linked site.
The fact that such links may exist does not indicate approval or endorsement of any material contained on any linked site. IC Markets is not liable for any harm caused by the transmission, through accessing the services or information on this site, of a computer virus, or other computer code or programming device that might be used to access, delete, damage, disable, disrupt or otherwise impede in any manner, the operation of the site or of any user’s software, hardware, data or property.


