
DXY:
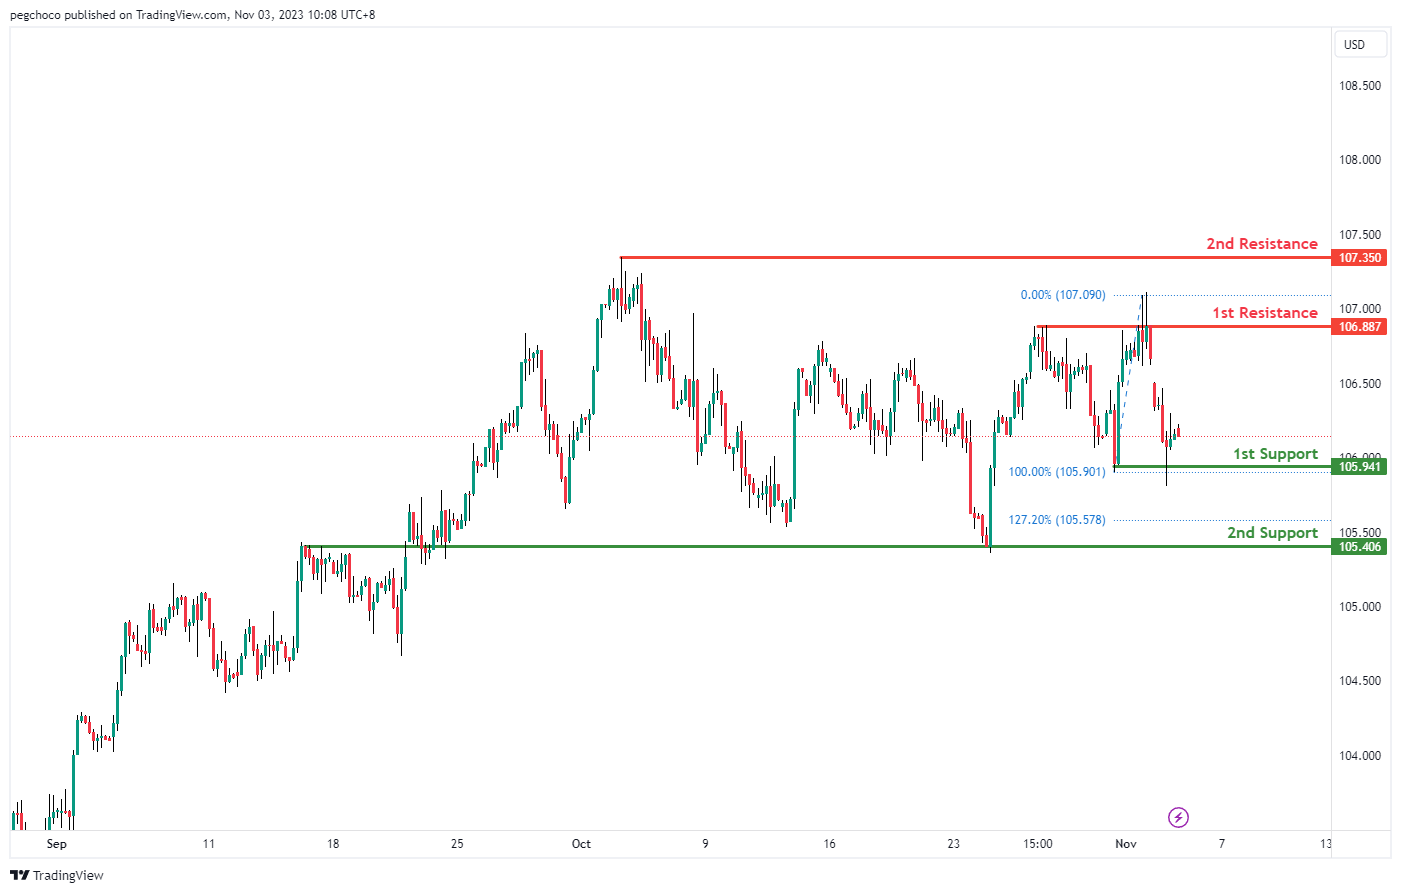
The DXY (US Dollar Currency Index) chart currently has a neutral overall momentum, indicating a lack of a strong directional bias. In this situation, it’s suggested that the price could potentially fluctuate between the 1st support and 1st resistance levels.
1st support at 105.94 is identified as a swing low support, which could act as a significant level where the price might find buying interest. The 2nd support at 105.40 is categorized as an overlap support, further reinforcing its potential as a support level.
On the resistance side, the 1st resistance at 106.88 is noted as a multi-swing high resistance, indicating it could act as a level where the price faces selling pressure.The 2nd resistance at 107.35 is categorized as a swing high resistance, suggesting it might be a level where the price encounters obstacles in its upward movement.
EUR/USD:
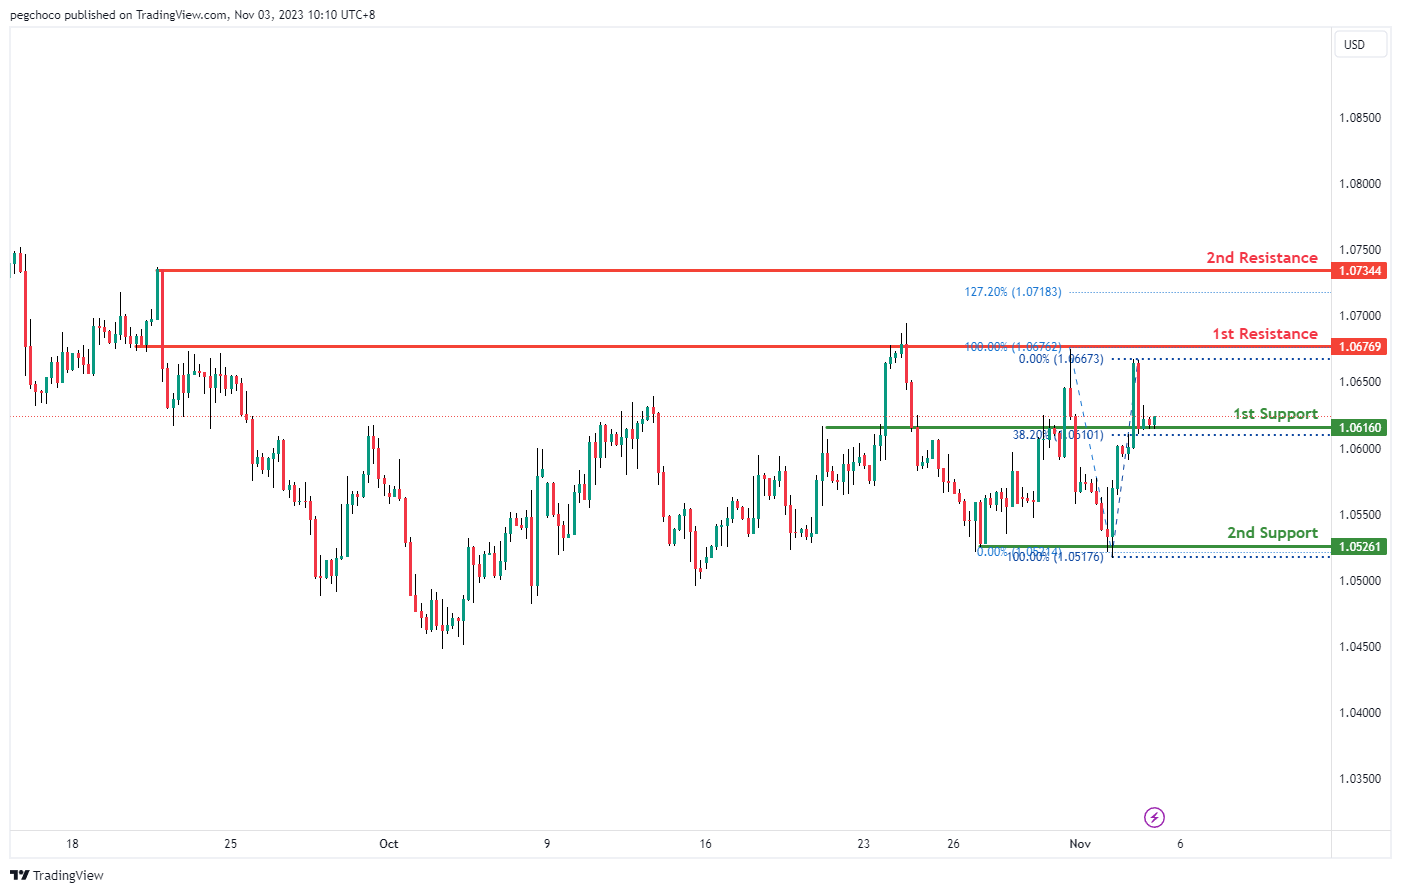
The EUR/USD chart currently exhibits a bullish overall momentum, indicating a potential upward bias. In this scenario, it’s suggested that the price could potentially make a bullish continuation towards the 1st resistance level.
1st support at 1.0526 is identified as an overlap support and coincides with the 38.20% Fibonacci Retracement level. This makes it a significant level where buyers might step in to provide support.The 2nd support at 1.0526 is categorized as a multi-swing low support, further strengthening its potential as a support level.
On the resistance side, the 1st resistance at 1.0676 is noted as a swing high resistance, indicating it could act as a level where the price faces selling pressure.The 2nd resistance at 1.0734 is also categorized as a swing high resistance, suggesting it might be a level where the price encounters obstacles in its upward movement.
EUR/JPY:
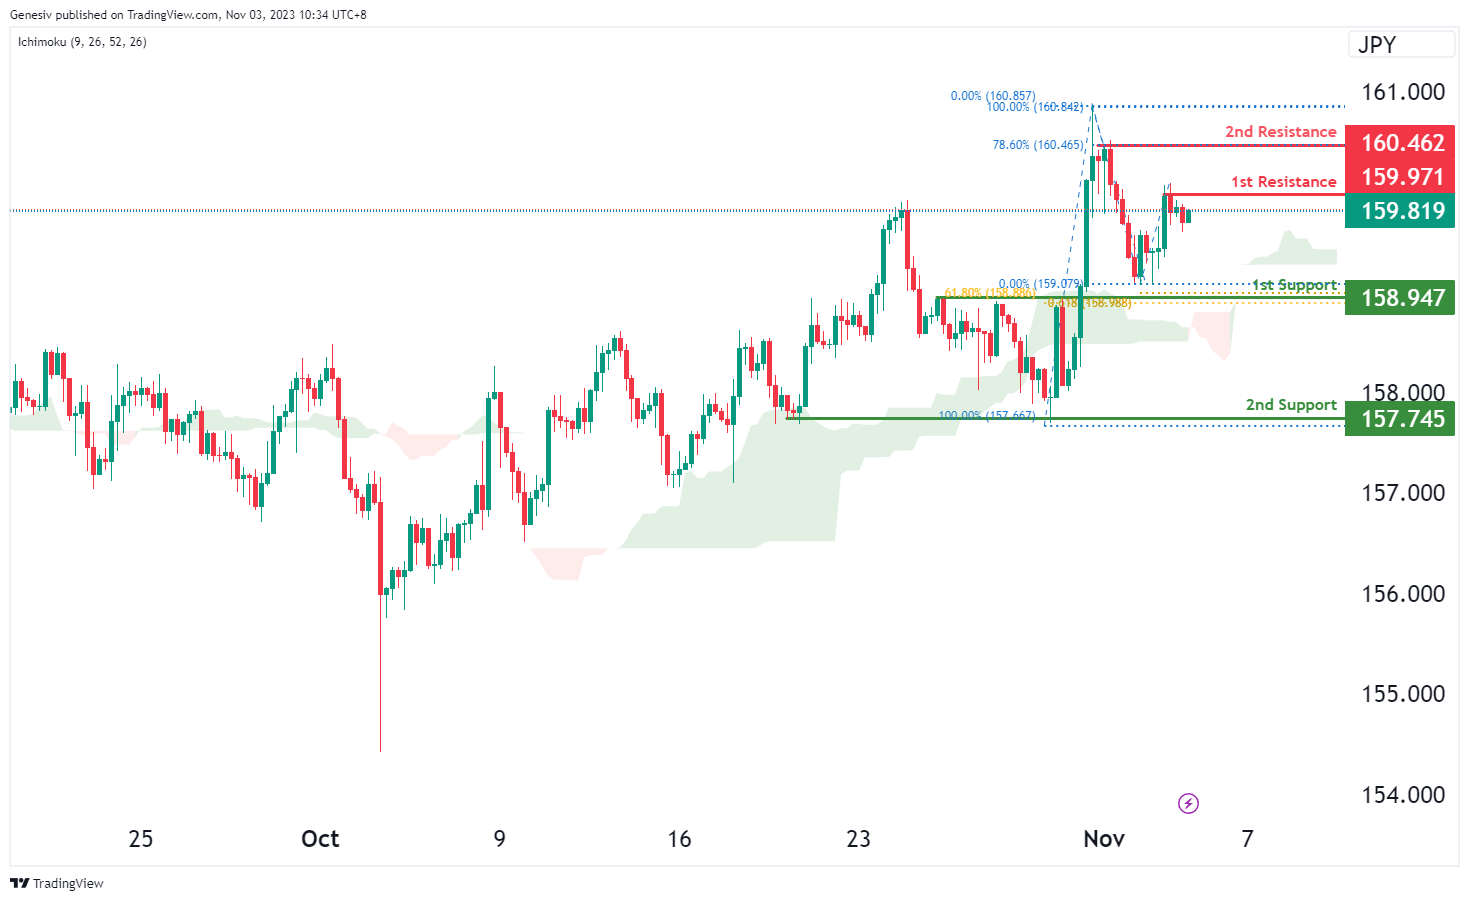
The EUR/JPY chart is currently showing a bearish momentum, suggesting a potential scenario for a bearish reaction off the first resistance at 159.97, potentially leading to a drop to the first support.
The first support at 158.94 is identified as a pullback support, highlighting a level where the price might find support during its downward movement. This level is significant due to the confluence of the 61.80% Fibonacci Retracement and the 61.80% Fibonacci Projection, indicating strong Fibonacci support.
The second support at 157.74 is recognized as multi-swing low support, offering an additional level that could potentially provide support during the bearish trend.
Regarding resistance levels, the first resistance at 159.97 is characterized as swing high resistance, representing a significant barrier to the price’s upward movement in the current bearish scenario.
The second resistance at 160.46 aligns with swing high resistance and the 78.60% Fibonacci Retracement, further reinforcing a potential barrier for the price’s upward movement within the existing bearish trend.
EUR/GBP:
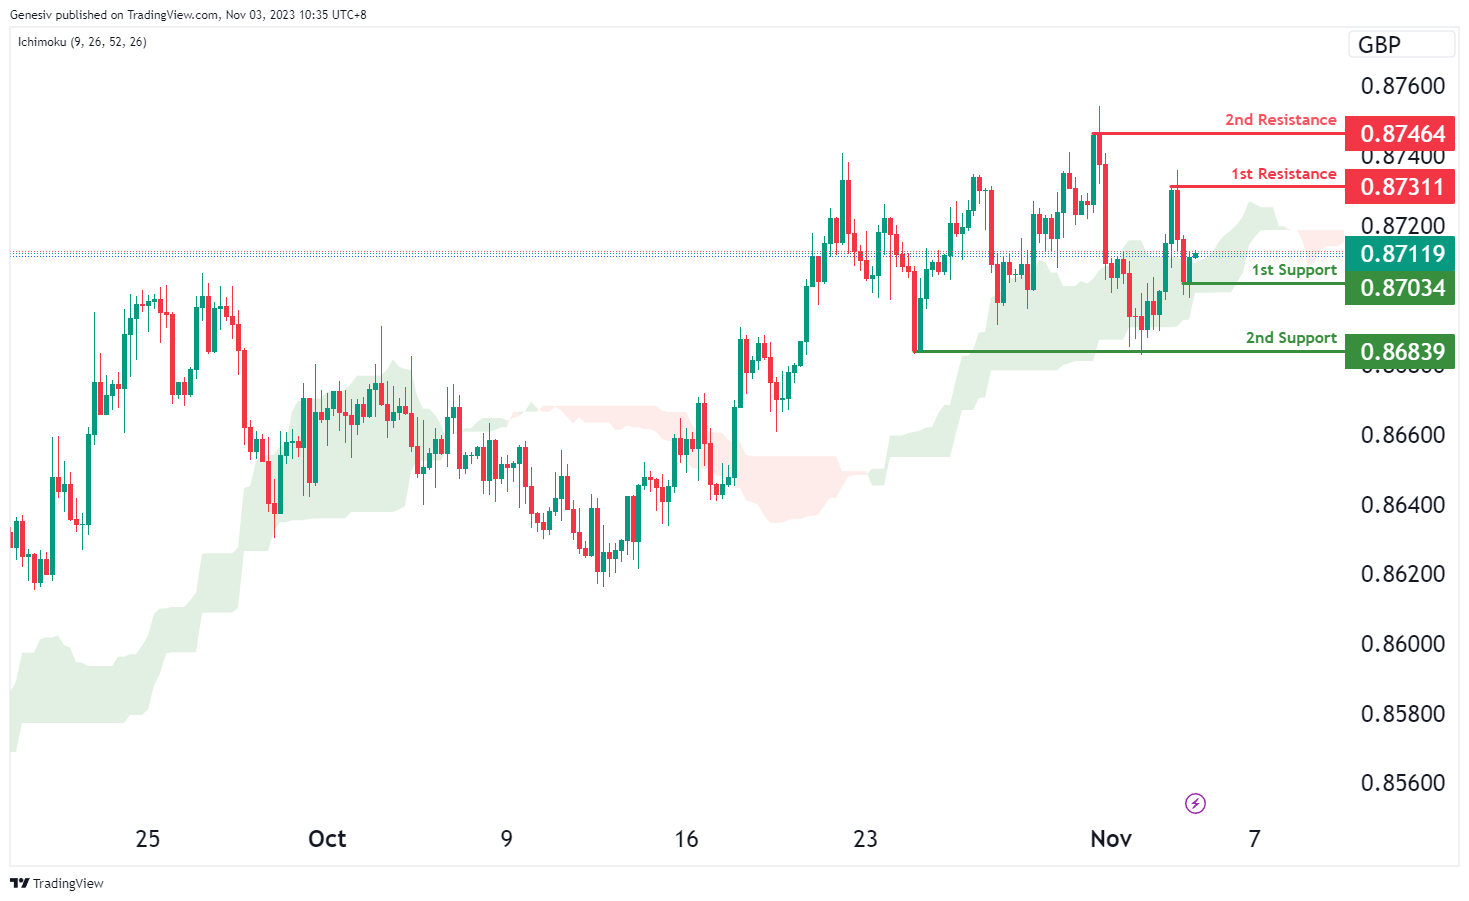
The EUR/GBP chart is currently indicating a bullish momentum, suggesting a potential scenario for a bullish continuation towards the first resistance at 0.8731.
The first support at 0.8703 is identified as swing low support, indicating a level where the price might find support during any potential retracement or decline.
The second support at 0.8683 is recognized as multi-swing low support, providing an additional level that might offer support during the bullish trend.
On the resistance side, the first resistance at 0.8731 is characterized as swing high resistance, signifying a level that could potentially act as a barrier to the price’s upward movement in the current bullish scenario.
The second resistance at 0.8746 is also identified as swing high resistance, suggesting it might pose another significant barrier to the price’s upward movement within the prevailing bullish trend.
.
GBP/USD:
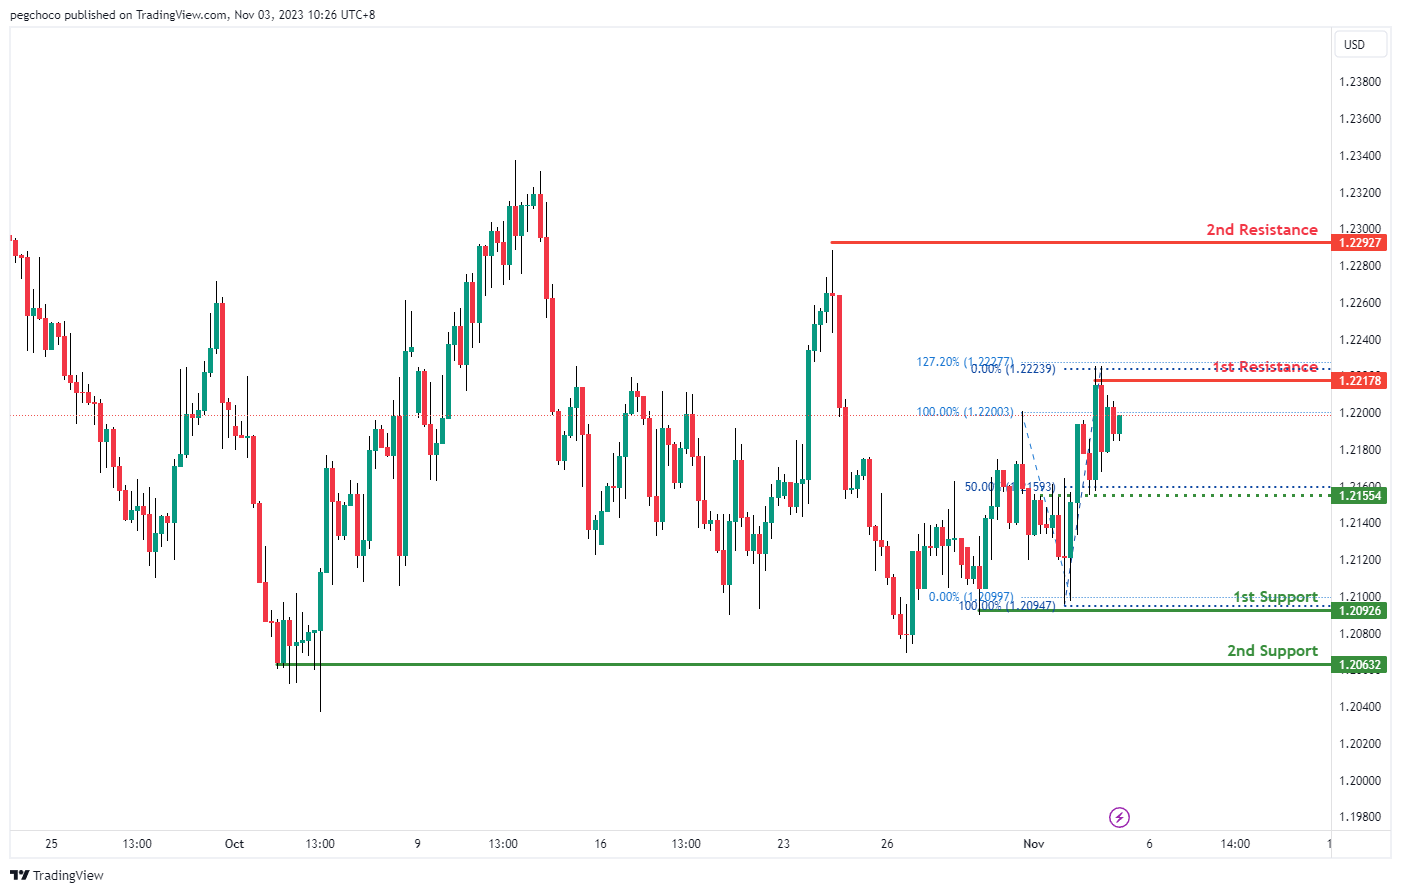
The GBP/USD chart currently has a bullish overall momentum, indicating the potential for a bullish continuation towards the 1st resistance level.
The 1st support at 1.2092 is identified as a multi-swing low support, signifying its significance as a potential level where buyers may step in.
Similarly, the 2nd support at 1.2063 is also categorized as a multi-swing low support, reinforcing its potential as a support level.
On the resistance side, the 1st resistance at 1.2217 is identified as a swing high resistance, suggesting it could act as a level where the price may face selling pressure.
Additionally, the 2nd resistance at 1.2291 is defined as a swing high resistance, further adding to the potential areas where the price might encounter obstacles in its upward movement.
Intermediate support at 1.2155 is noted as an overlap support and is associated with the 50% Fibonacci Retracement, making it another level to watch for potential price movements.
GBP/JPY:
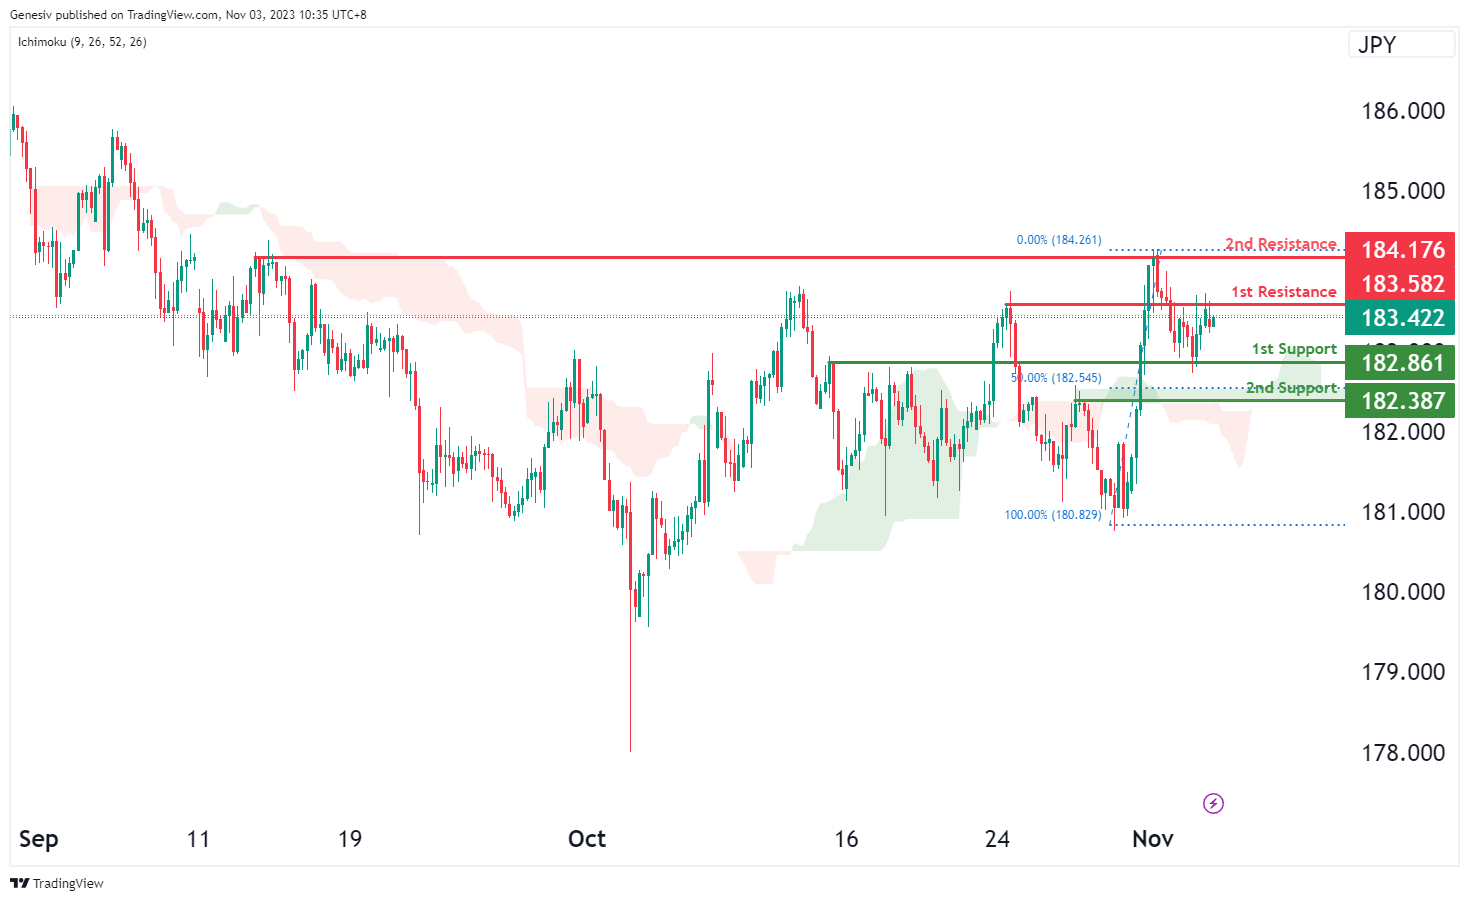
The GBP/JPY chart currently reflects a bearish momentum, indicating a potential scenario for a bearish reaction off the first resistance at 183.58, possibly leading to a drop to the first support.
The first support at 182.86 is identified as an overlap support, signifying a level where the price might find support during its potential decline.
The second support at 182.38 is recognized as pullback support and aligns with the 50% Fibonacci Retracement, indicating another level that could potentially offer support in the bearish movement.
On the resistance side, the first resistance at 183.58 is characterized as an overlap resistance, representing a significant barrier to the price’s upward movement in the current bearish scenario.
The second resistance at 184.17 is identified as multi-swing high resistance, further suggesting it might pose a substantial obstacle for the price’s upward movement within the prevailing bearish trend.
USD/CHF:
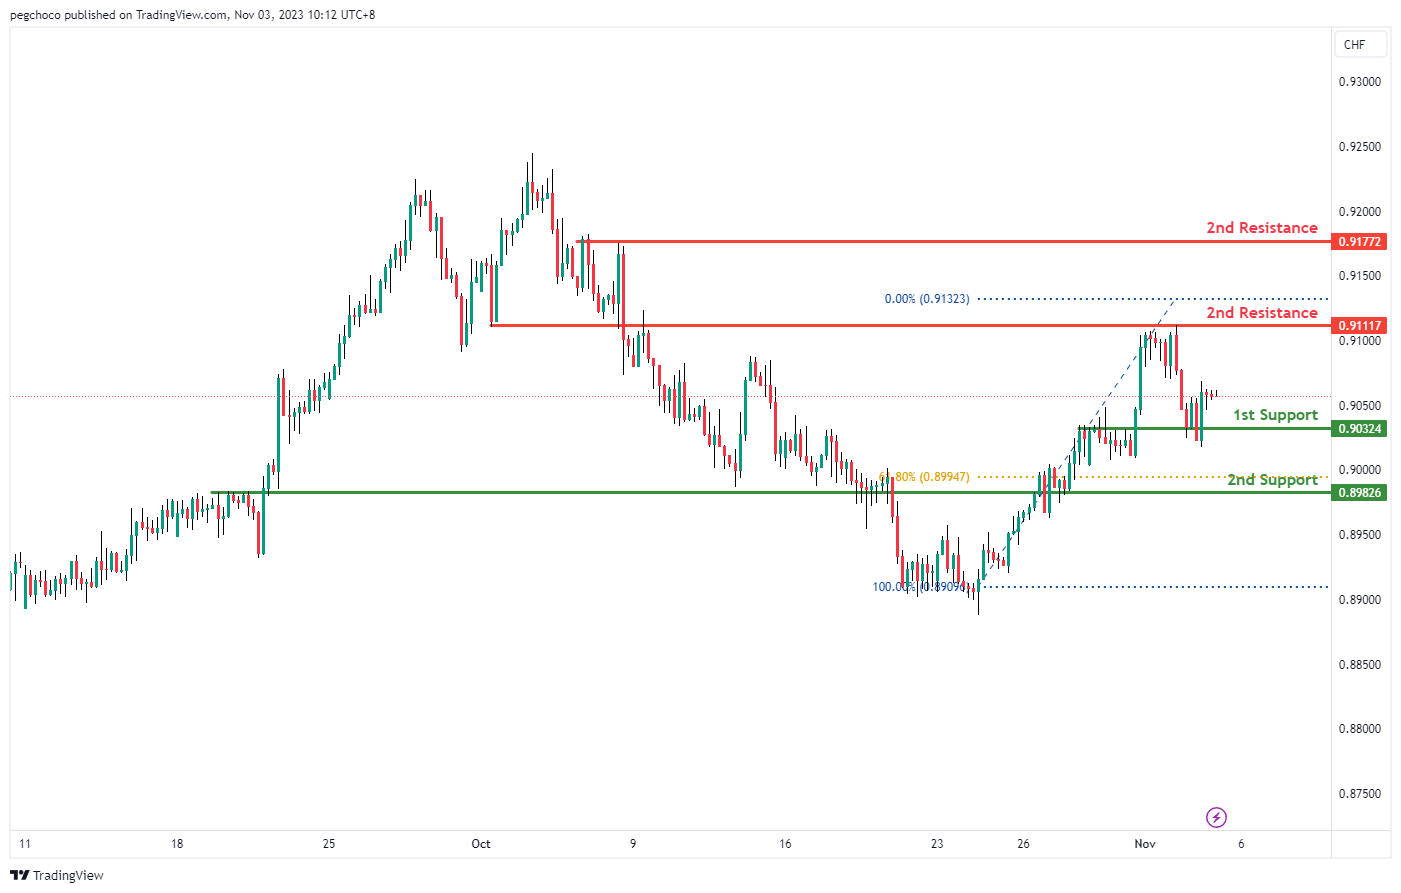
The USD/CHF chart currently exhibits a bearish overall momentum, indicating the potential for a bearish continuation towards the 1st support level at 0.9032. This support level is identified as a pullback support, suggesting it could be a significant level where buyers might step in. Furthermore, the 2nd support at 0.8982 is considered an overlap support and is reinforced by the presence of the 61.80% Fibonacci Retracement level, making it a strong potential support area.
On the resistance side, the 1st resistance at 0.9111 is categorized as an overlap resistance, indicating it may act as a level where selling interest could emerge. The 2nd resistance at 0.9177 is defined as a multi-swing high resistance, further highlighting its significance as a potential barrier to upward movement. Traders should keep a close eye on these support and resistance levels for potential price reactions and trading opportunities, in line with the overall bearish bias of the chart.
USD/JPY:
The USD/JPY chart currently has a bearish overall momentum, suggesting the potential for a bearish continuation towards the 1st support level at 149.96. This support level is identified as an overlap support, indicating its significance as a potential area where buyers may enter the market.
Additionally, the 2nd support at 148.74 is considered a swing low support, further reinforcing its potential as a support level.
On the resistance side, the 1st resistance at 150.77 is categorized as a pullback resistance, suggesting it could act as a level where the price may face selling pressure. This resistance level is also associated with the 50% Fibonacci Retracement, adding to its significance.
The 2nd resistance at 151.70 is defined as a swing high resistance, indicating another potential level where the price may encounter obstacles in its upward movement.

USD/CAD:
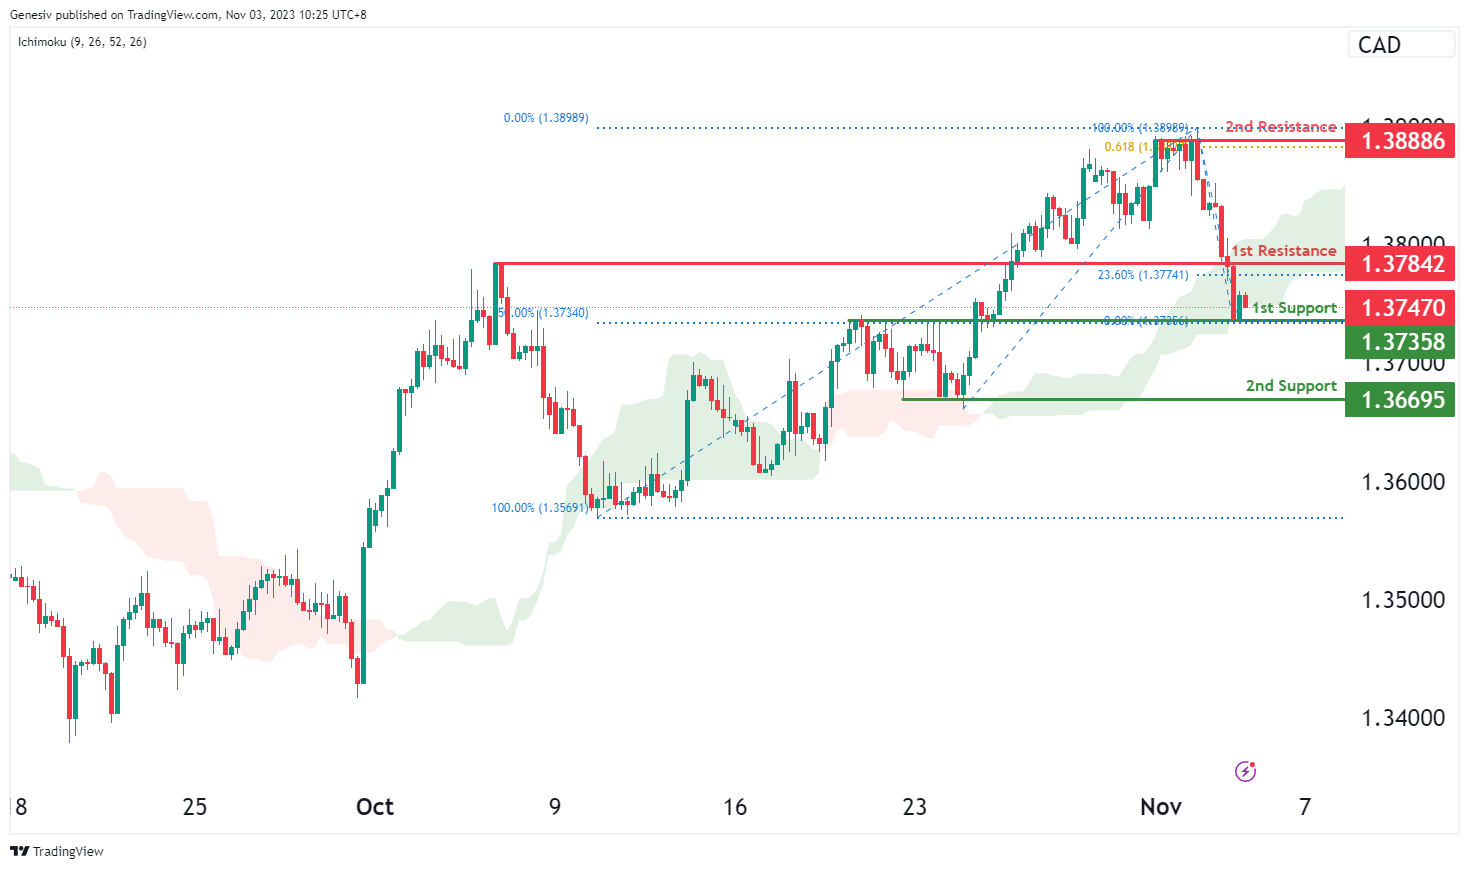
The USD/CAD chart currently demonstrates an overall bearish momentum. However, there is a potential scenario for price to make a bullish bounce off the 1st support. Price is also trading within the bullish Ichimoku cloud, potentially acting as a support zone.
The 1st support level at 1.3736 is identified as an overlap support that aligns with the 50.00% Fibonacci retracement level. Further below, the 2nd support level at 1.3669 is marked as a pullback support, indicating a potential area of price support.
To the upside, the 1st resistance level at 1.3784 is identified as a pullback resistance that aligns with the 23.60% Fibonacci retracement level. Beyond that, the 2nd resistance level at 1.3889 is also marked as a pullback resistance that aligns with the 61.80% Fibonacci projection level, further reinforcing the potential for resistance in that region.
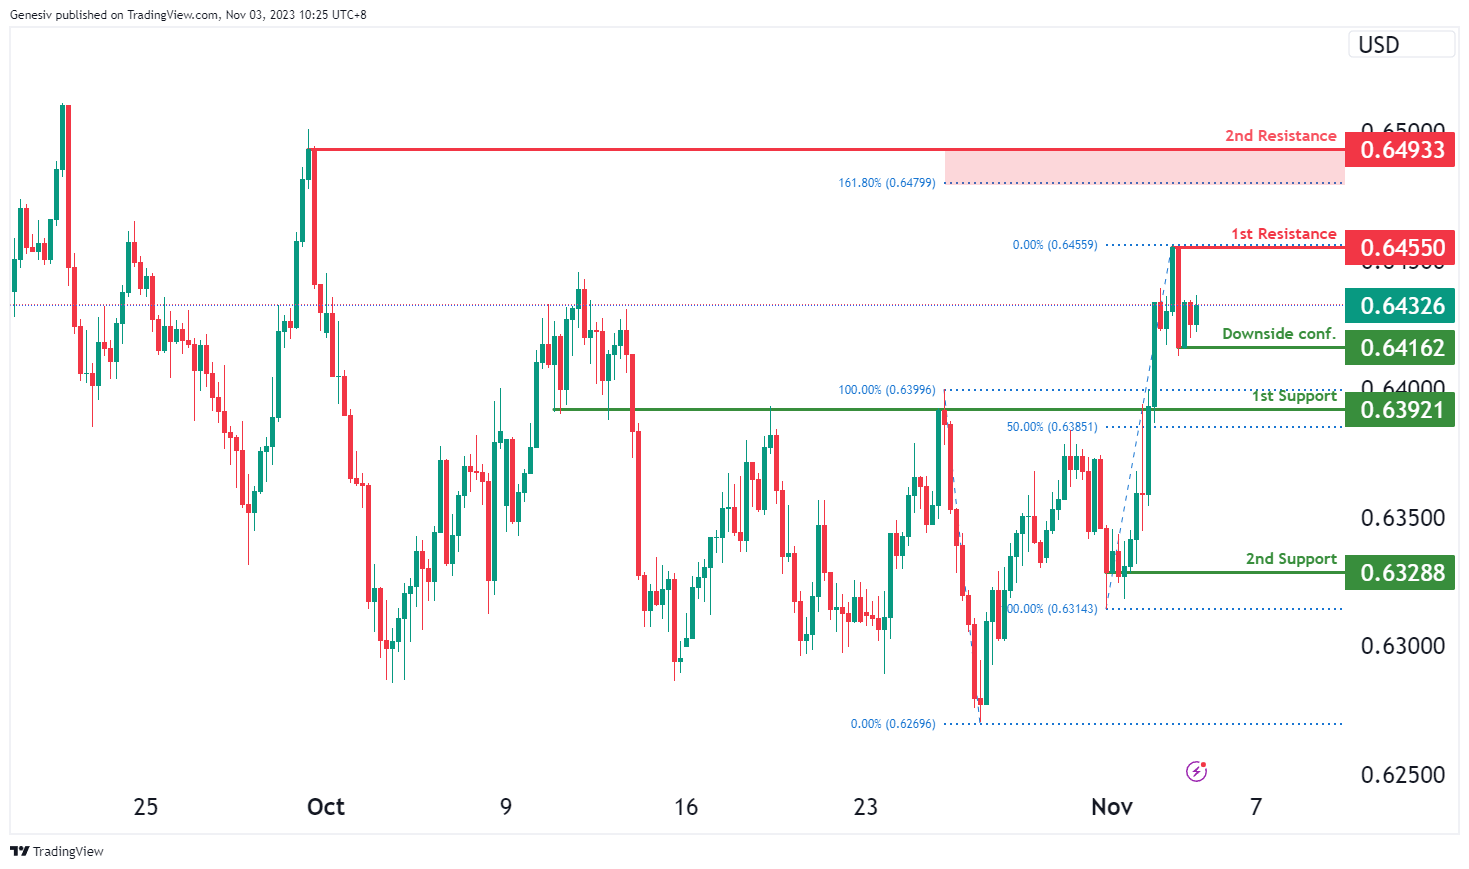
AUD/USD:
The AUD/USD chart currently exhibits an overall bullish momentum, suggesting a potential for a bullish continuation towards the 1st resistance.
The 1st resistance level at 0.6455 is identified as a pullback resistance. Higher up, the 2nd resistance level at 0.6493 is also noted as a swing-high resistance that aligns close to the 161.80% Fibonacci extension level.
On the support side, should price break below the downside confirmation at 0.6416, it could continue to fall towards the 1st support. The 1st support level at 0.6392 is identified as an overlap support that aligns close to the 50.00% Fibonacci retracement level. Further below, the 2nd support level at 0.6329 is marked as a pullback support, indicating a potential for a strong price support.
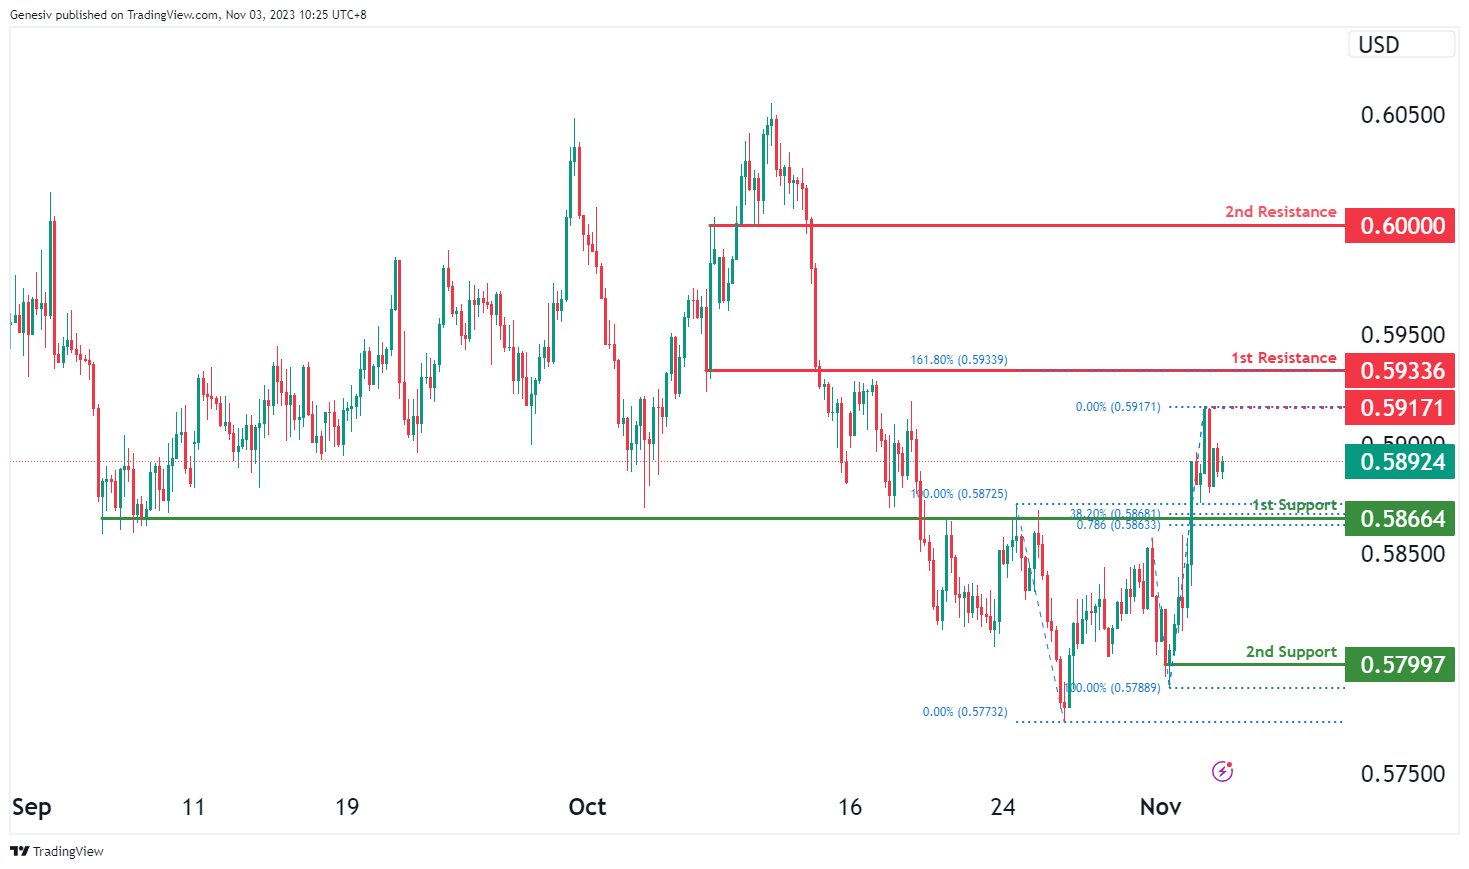
NZD/USD
The NZD/USD chart currently demonstrates an overall bullish momentum, suggesting a potential for a bullish continuation towards the 1st resistance.
The intermediate resistance level at 0.5917 is identified as a pullback resistance while the 1st resistance level at 0.5934 is identified as an overlap resistance that aligns with the 161.80% Fibonacci extension level. Beyond this, the 2nd resistance level at 0.6000 is also noted as an overlap resistance, acting as a potential barrier to upward price movements.
To the downside, the 1st support level at 0.5866 is identified as an overlap support that aligns with a confluence of Fibonacci levels i.e. the 38.20% retracement and the 78.60% projection levels. Additionally, the 2nd support level at 0.5799 is marked as a pullback, potentially acting as a strong support zone.
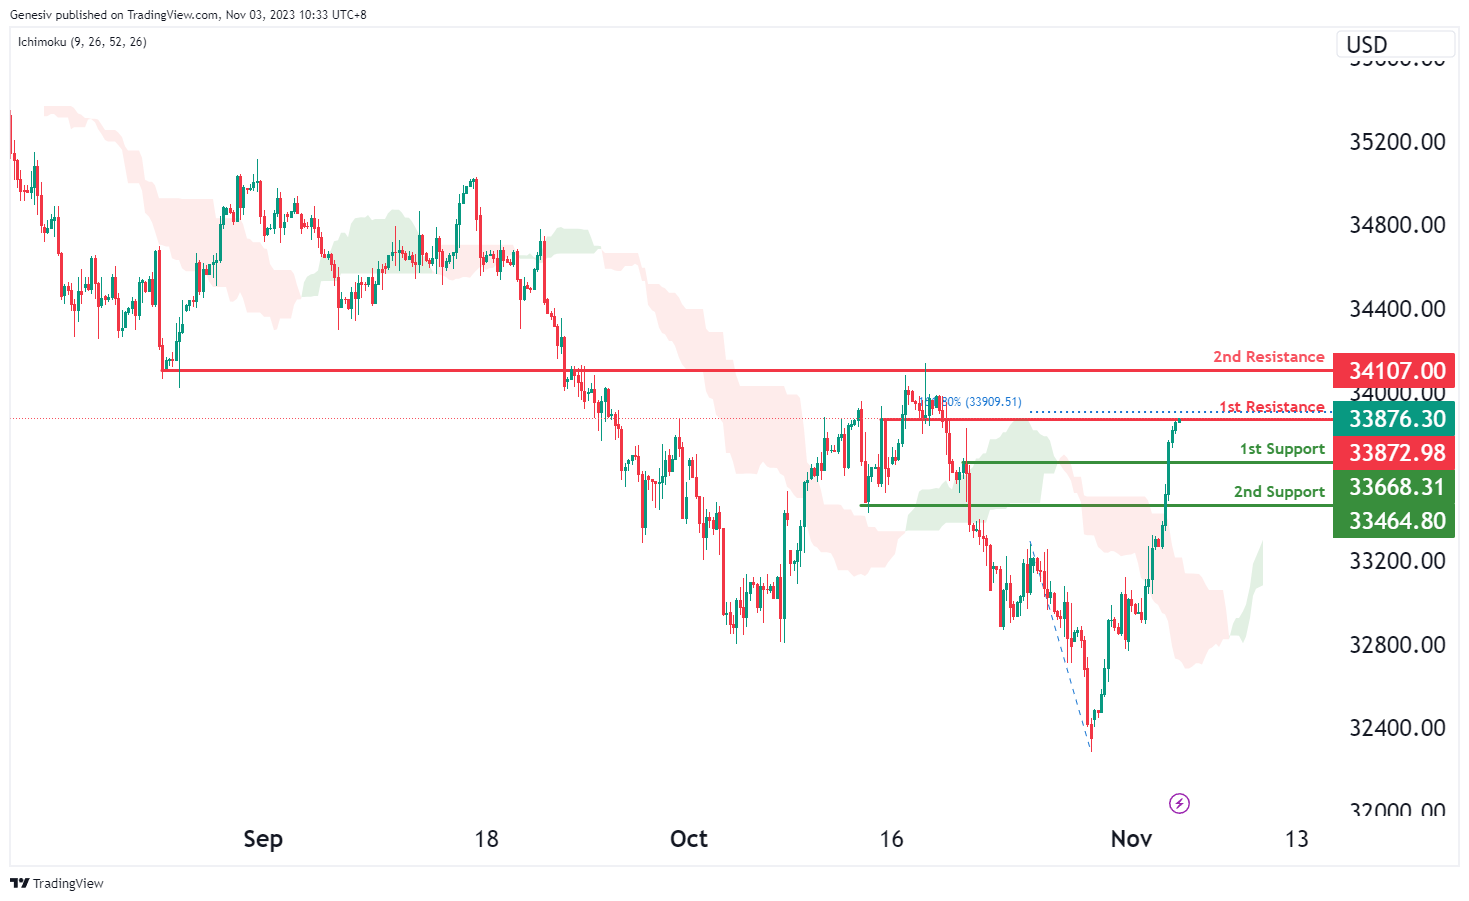
DJ30:
The DJ30 chart currently demonstrates a bearish momentum, suggesting a potential scenario for a bearish reaction off the first resistance at 33872.98, potentially leading to a drop to the first support.
The first support at 33668.31 is considered as a pullback support level, indicating a point where the price might find support during its downward movement.
The second support at 33464.80 is also identified as pullback support, providing an additional level that could offer support in case of a decline.
Regarding resistance levels, the first resistance at 33872.98 is characterized as pullback resistance and coincides with the 161.80% Fibonacci Extension, indicating a significant barrier to the price’s upward movement in the current bearish scenario.
The second resistance at 34107.00 is recognized as an overlap resistance, suggesting it could pose another substantial barrier to the price’s upward movement within the prevailing bearish trend.
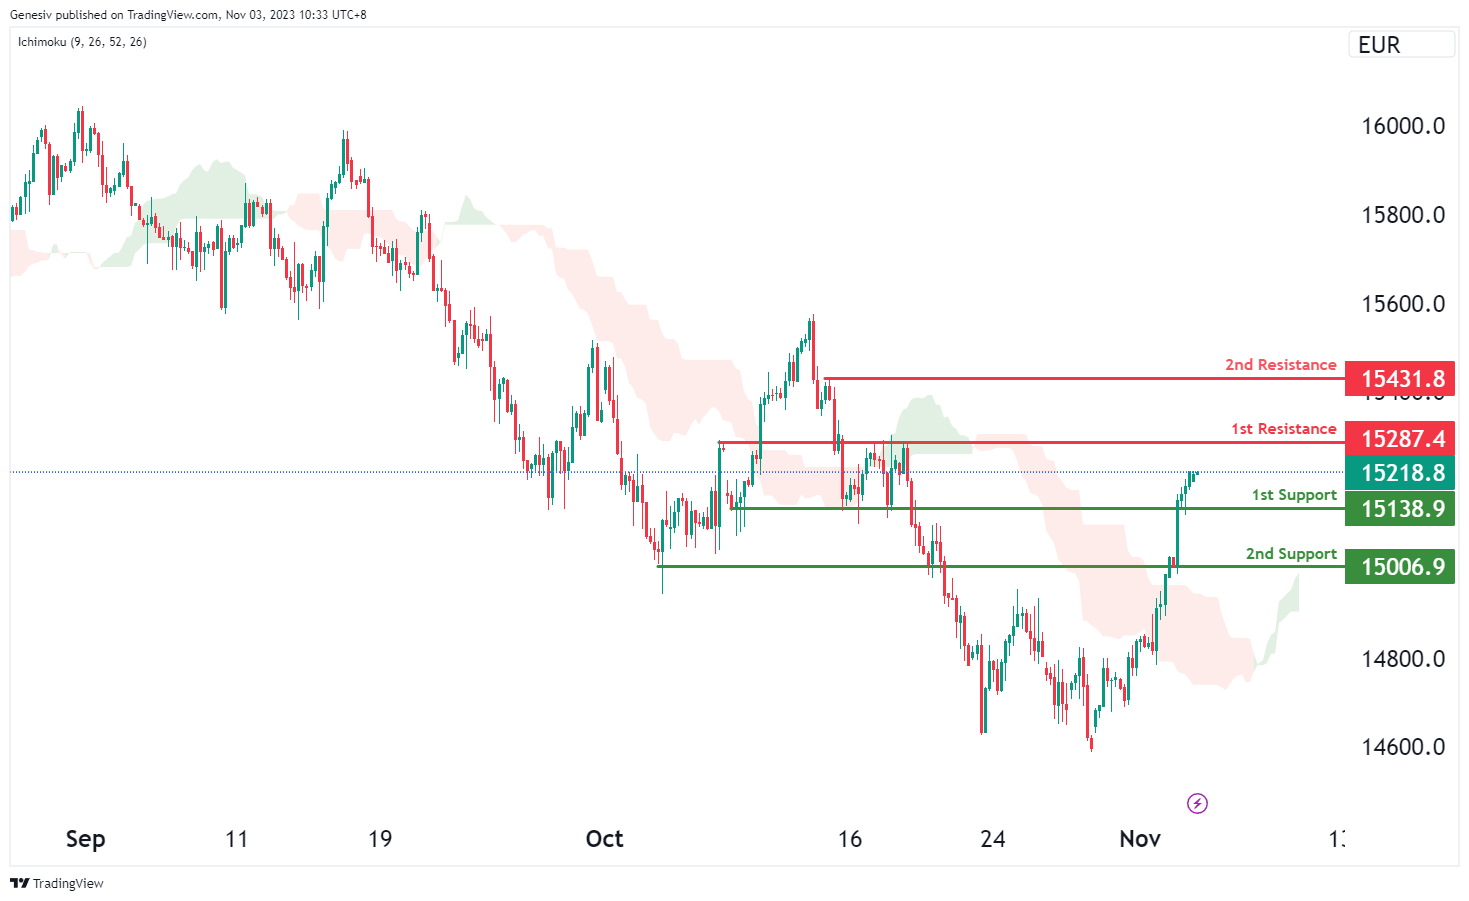
GER40:
The GER40 chart is currently indicating a bullish momentum, suggesting a potential scenario for a bullish continuation towards the first resistance at 15287.40.
The first support at 15138.90 is identified as a pullback support, indicating a level where the price might find support during any potential retracement in its upward movement.
The second support at 15006.90 is recognized as an overlap support, indicating an additional level that might offer support during the bullish trend.
On the resistance side, the first resistance at 15287.40 is characterized as an overlap resistance, suggesting it could act as a significant barrier to the price’s upward movement within the current bullish scenario.
The second resistance at 15431.80 is identified as a swing high resistance, indicating it might pose a substantial obstacle for the price’s upward movement within the prevailing bullish trend.
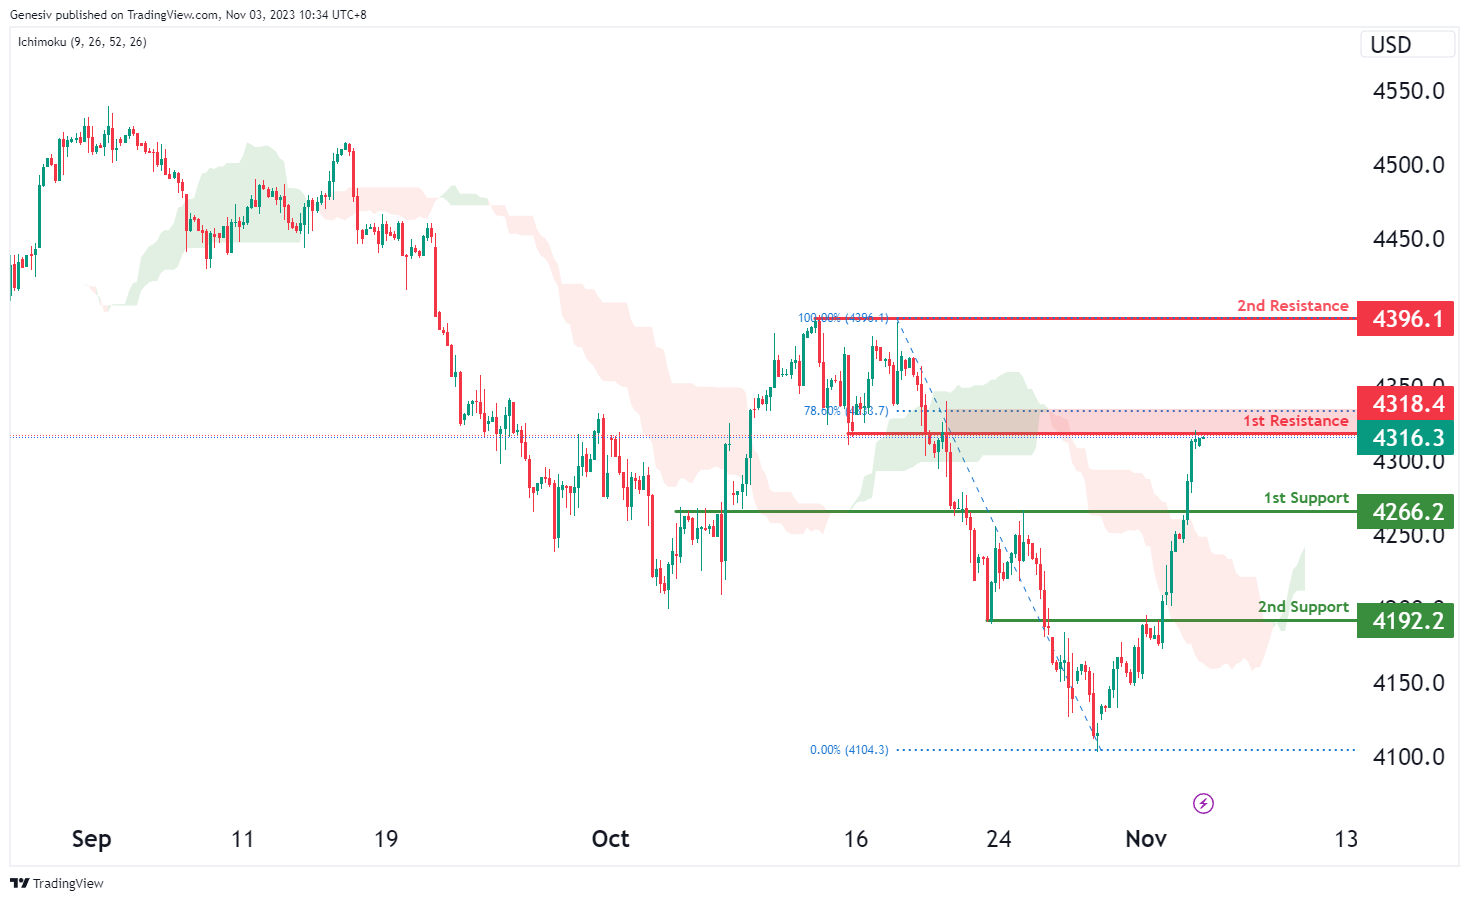
`US500
The US500 chart currently reflects a bearish momentum, suggesting a potential scenario for a bearish reaction off the first resistance at 4318.4, potentially resulting in a drop to the first support.
The first support at 4266.2 is identified as a pullback support, indicating a level where the price might find support during its downward movement.
The second support at 4192.2 is recognized as an additional pullback support, providing another level that might offer support if the price continues its decline.
On the resistance side, the first resistance at 4318.4 is characterized as an overlap resistance and coincides with the 78.60% Fibonacci Retracement, indicating a significant barrier to the price’s upward movement in the current bearish scenario.
The second resistance at 4396.1 is identified as a multi-swing high resistance, suggesting it could pose a substantial obstacle for the price’s upward movement within the prevailing bearish trend.
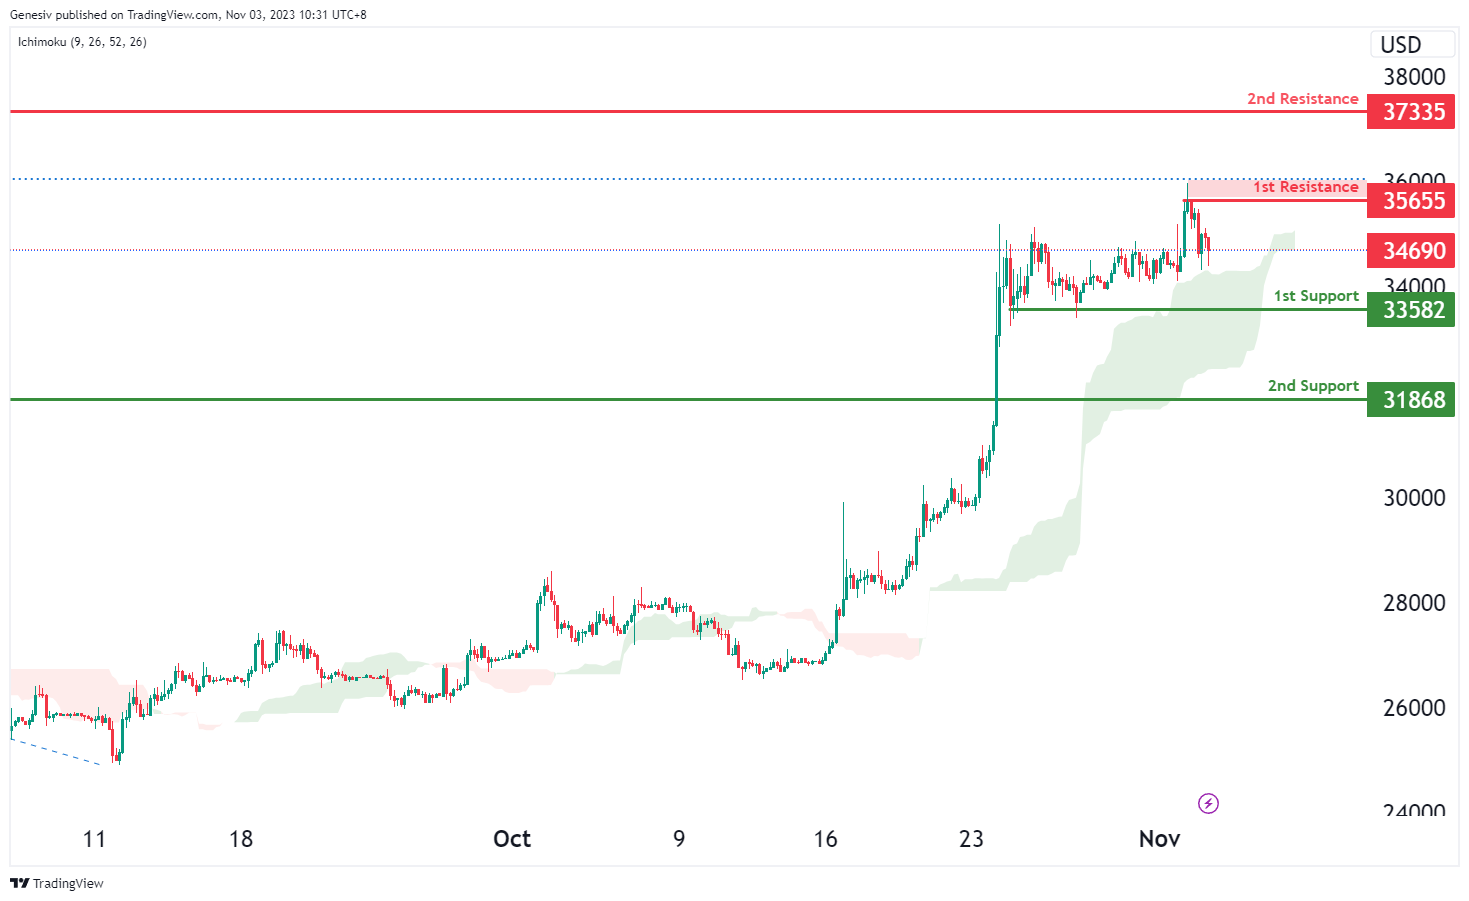
BTC/USD:
The BTC/USD chart currently reflects a neutral momentum, indicating the potential for price fluctuation between the first resistance at 35655 and the first support level at 33582.
The first support at 33582 is attributed to being a multi-swing low support, signifying a level where the price could find support in the event of a decline.
The second support at 31868 is considered a pullback support, indicating an additional level that might provide support if the price experiences a decline.
In terms of resistance, the first resistance at 35655 is recognized as swing high resistance, coinciding with the 161.80% Fibonacci Extension level. This level could pose a significant barrier to the price’s upward movement in the neutral scenario.
Furthermore, the second resistance at 37335 is identified as pullback resistance, suggesting it as another potential level that might impede further bullish movement within this neutral phase.
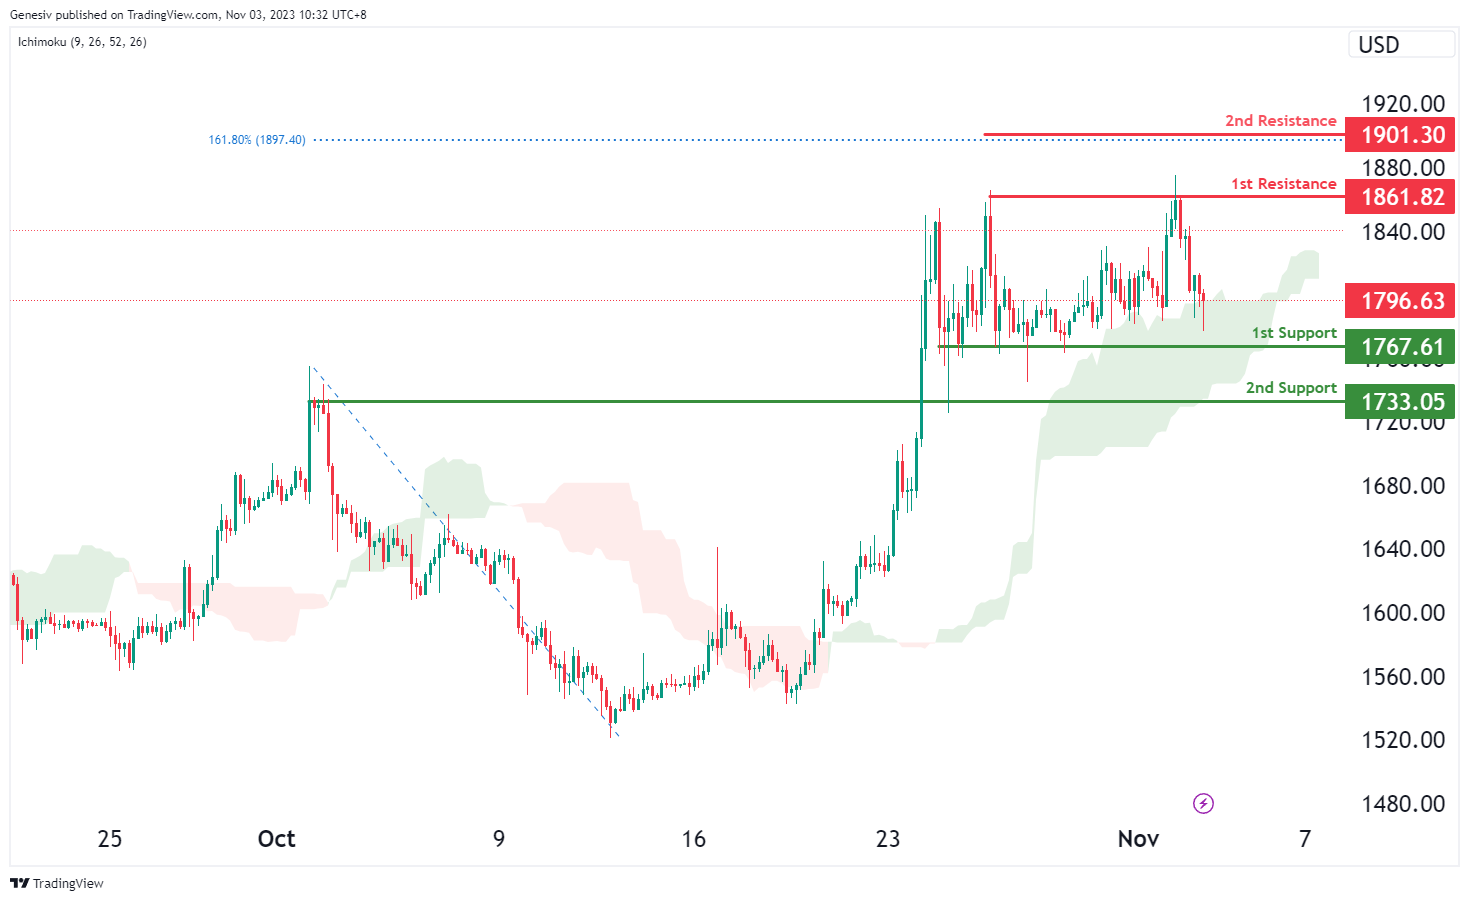
ETH/USD:
The ETH/USD chart currently shows a neutral momentum, suggesting a potential scenario for price fluctuation between the first resistance at 1861.82 and the first support level at 1767.61.
The first support at 1767.61 is considered a multi-swing low support, indicating a level where the price might find support in case of a decline.
The second support at 1733.05 is recognized as a pullback support, providing an additional level that might offer support if the price experiences a decline.
On the resistance side, the first resistance at 1861.82 is attributed to multi-swing high resistance, representing a significant barrier that the price might encounter during upward movements within this neutral phase.
The second resistance at 1901.30 aligns with the 161.80% Fibonacci Extension level, suggesting it as another potential level that could impede further bullish movement within this neutral phase.
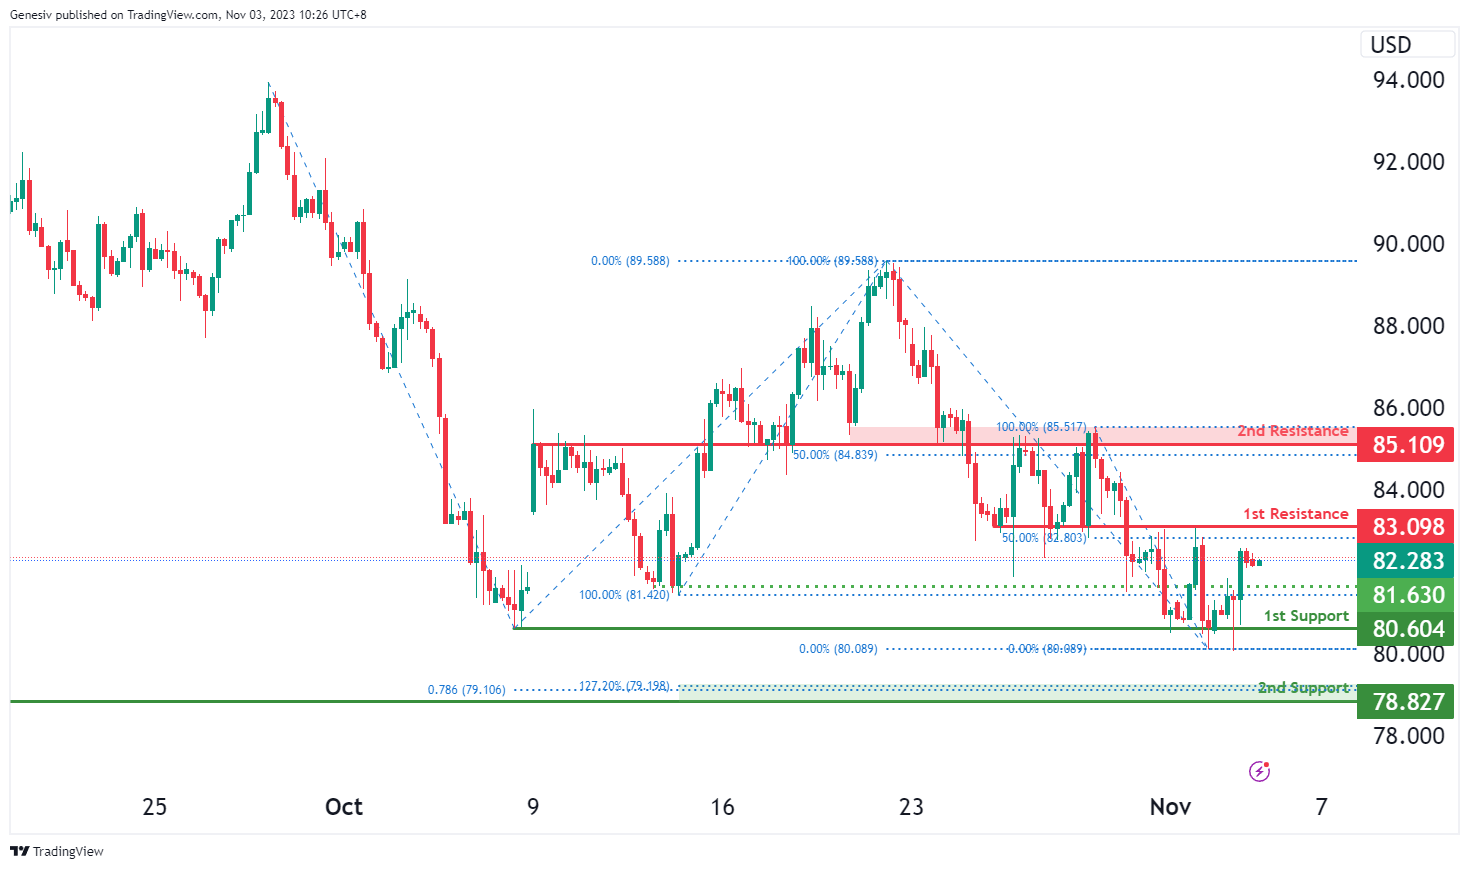
WTI/USD:
The WTI chart currently exhibits an overall bearish momentum. However, there is a potential for price to make a bullish continuation towards the 1st resistance.
The 1st resistance level at 83.09 is noted as an overlap resistance that aligns with the 50.00% Fibonacci retracement level. Higher up, the 2nd resistance level at 85.11 is also marked as an overlap resistance that aligns with the 50.00% Fibonacci retracement level, making it a strong potential barrier to upward price movement.
To the downside, the intermediate support level at 81.63 is identified as a pullback support while the 1st support level at 80.60 is identified as a swing-low support. Additionally, the 2nd support level at 78.83 is marked as a pullback support that aligns with a confluence of Fibonacci levels i.e. the 127.20% extension and the 78.60% projection levels, reinforcing a potential support zone.
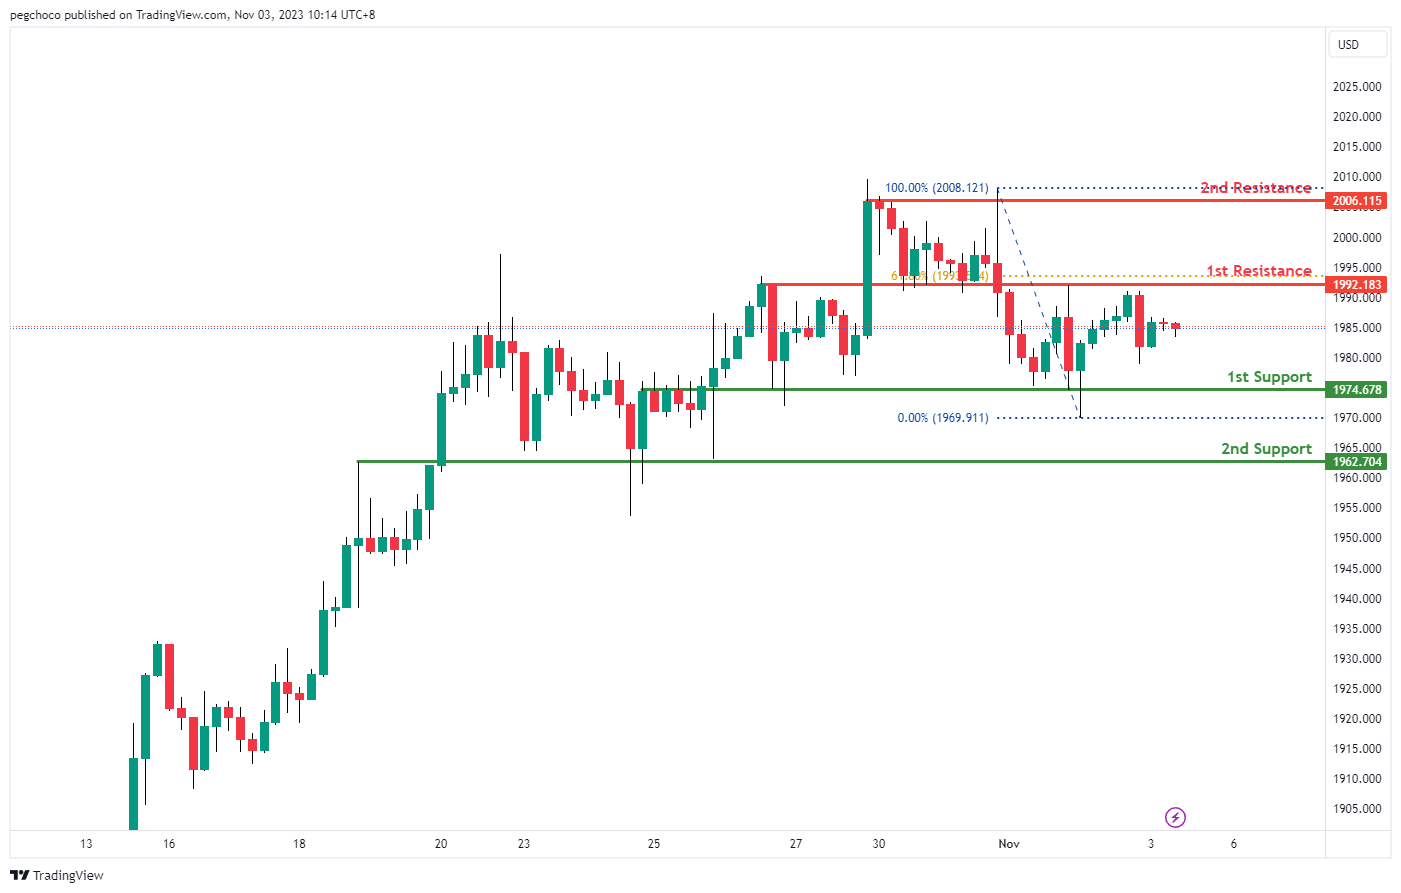
XAU/USD (GOLD):
The XAUUSD (Gold/US Dollar) chart currently exhibits a neutral overall momentum, suggesting the potential for price to fluctuate between the 1st support and 1st resistance levels.
The 1st support level at 1974.67 is identified as an overlap support, indicating its significance as a potential area where buyers may enter the market.
Furthermore, the 2nd support at 1962.70 is also considered an overlap support, reinforcing its potential as a support level.
On the resistance side, the 1st resistance at 1992.18 is categorized as an overlap resistance and is associated with the 61.80% Fibonacci Retracement, adding to its significance as a potential area where selling pressure may emerge.
The 2nd resistance at 2006.11 is defined as a multi-swing high resistance, indicating another potential level where the price may encounter obstacles in its upward movement.
The accuracy, completeness and timeliness of the information contained on this site cannot be guaranteed. IC Markets does not warranty, guarantee or make any representations, or assume any liability regarding financial results based on the use of the information in the site.
News, views, opinions, recommendations and other information obtained from sources outside of www.icmarkets.com, used in this site are believed to be reliable, but we cannot guarantee their accuracy or completeness. All such information is subject to change at any time without notice. IC Markets assumes no responsibility for the content of any linked site.
The fact that such links may exist does not indicate approval or endorsement of any material contained on any linked site. IC Markets is not liable for any harm caused by the transmission, through accessing the services or information on this site, of a computer virus, or other computer code or programming device that might be used to access, delete, damage, disable, disrupt or otherwise impede in any manner, the operation of the site or of any user’s software, hardware, data or property.


