
Key risk events today:
UK Final Services PMI; US Average Hourly Earnings m/m; US Non-Farm Employment; US Unemployment Rate; US ISM Non-Manufacturing PMI.
(Previous analysis as well as outside sources – italics).
EUR/USD:
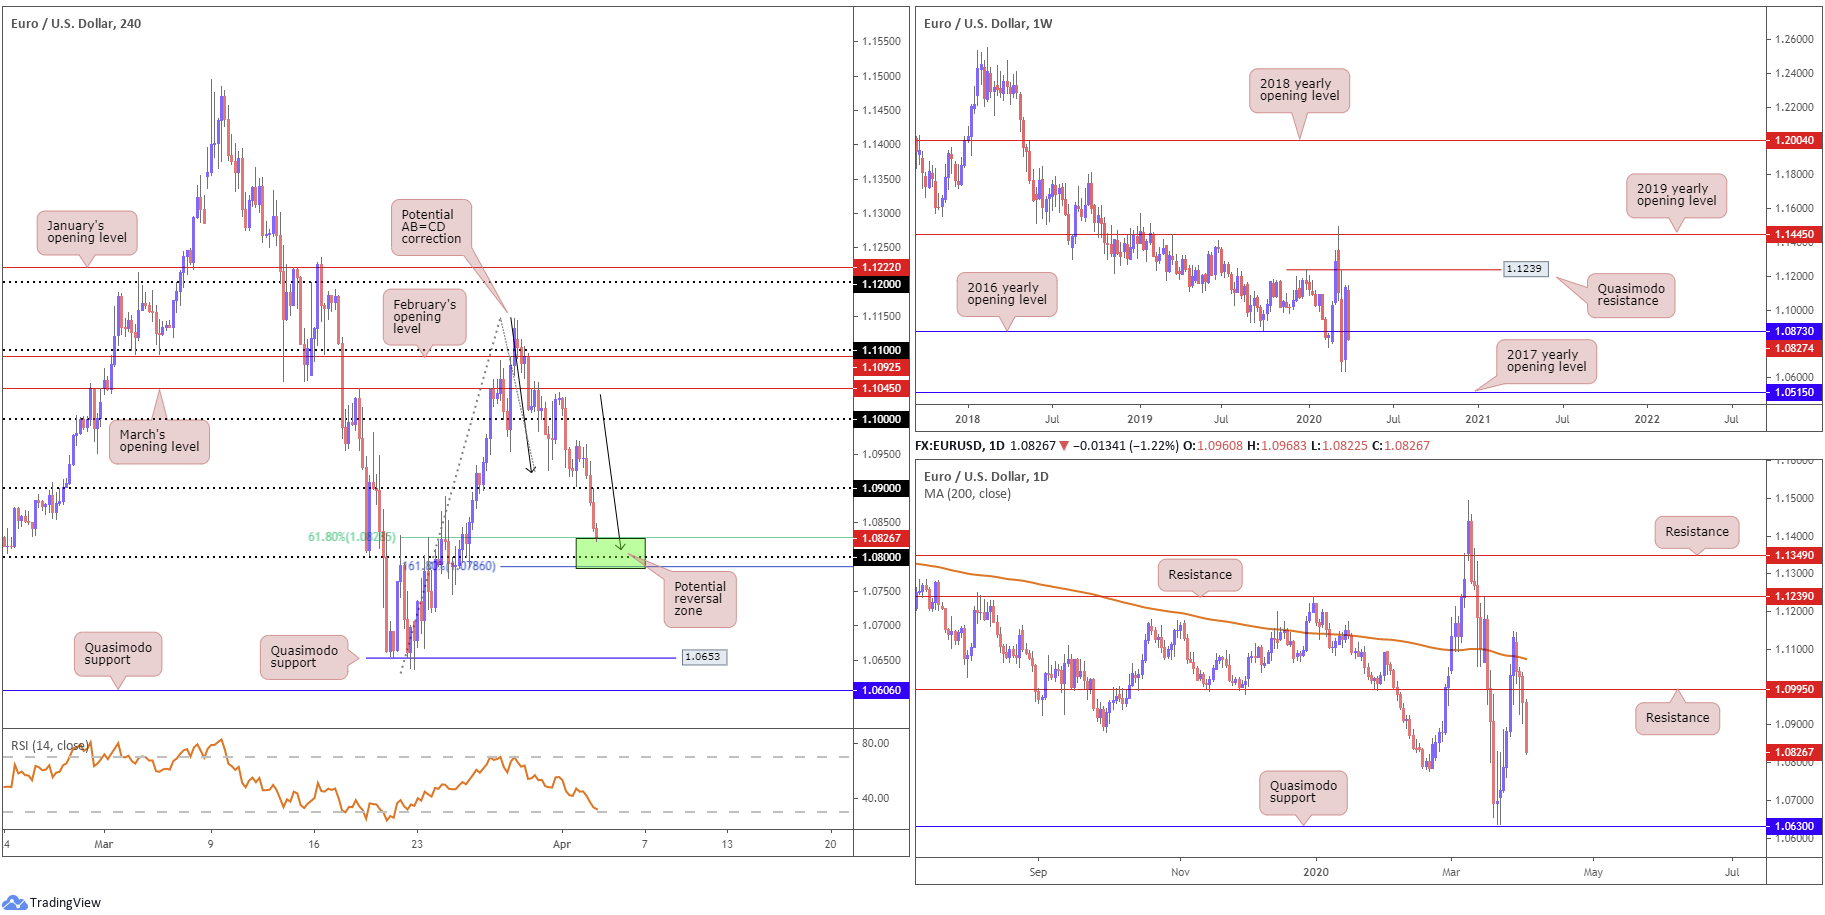
Although dipping briefly in response to the latest record weekly US claims figure soaring to 6.6 million, the buck quickly rebounded Thursday and has since overthrown 100.00, based on the US dollar index. EUR/USD subsequently tumbled sub 1.09 and tested an interesting area of H4 support (green), comprised of a 161.8% Fibonacci extension point at 1.0786, the round number 1.08, a 61.8% Fibonacci retracement at 1.0827 and an AB=CD configuration terminating at 1.0808 (black arrows).
Further afield, weekly flow crossed the 2016 yearly opening level at 1.0873, with eyes now on multi-year lows at 1.0637, followed by the 2017 yearly opening level at 1.0515.
On the daily scale, the recent break of support at 1.0995 potentially lays the foundation for a run back to Quasimodo support at 1.0630, though this entails engulfing the weekly level at 1.0873.
Areas of consideration:
A rebound from the H4 support area highlighted above at 1.0786/1.0827 is considered high probability among price-action traders, with the possibility of revisiting the underside of 1.09. This will likely be bolstered by weekly support at 1.0873, despite the minor whipsaw playing out.
However, with daily price threatening lower levels, conservative traders may still seek additional confirmation out of 1.0786/1.0827 before pulling the trigger.
GBP/USD:
Sterling continued to seesaw around 1.24 on the H4 scale Thursday between 1.2475/1.2347. As a result of yesterday’s lacklustre performance, much of the following piece resembles Wednesday’s technical briefing.
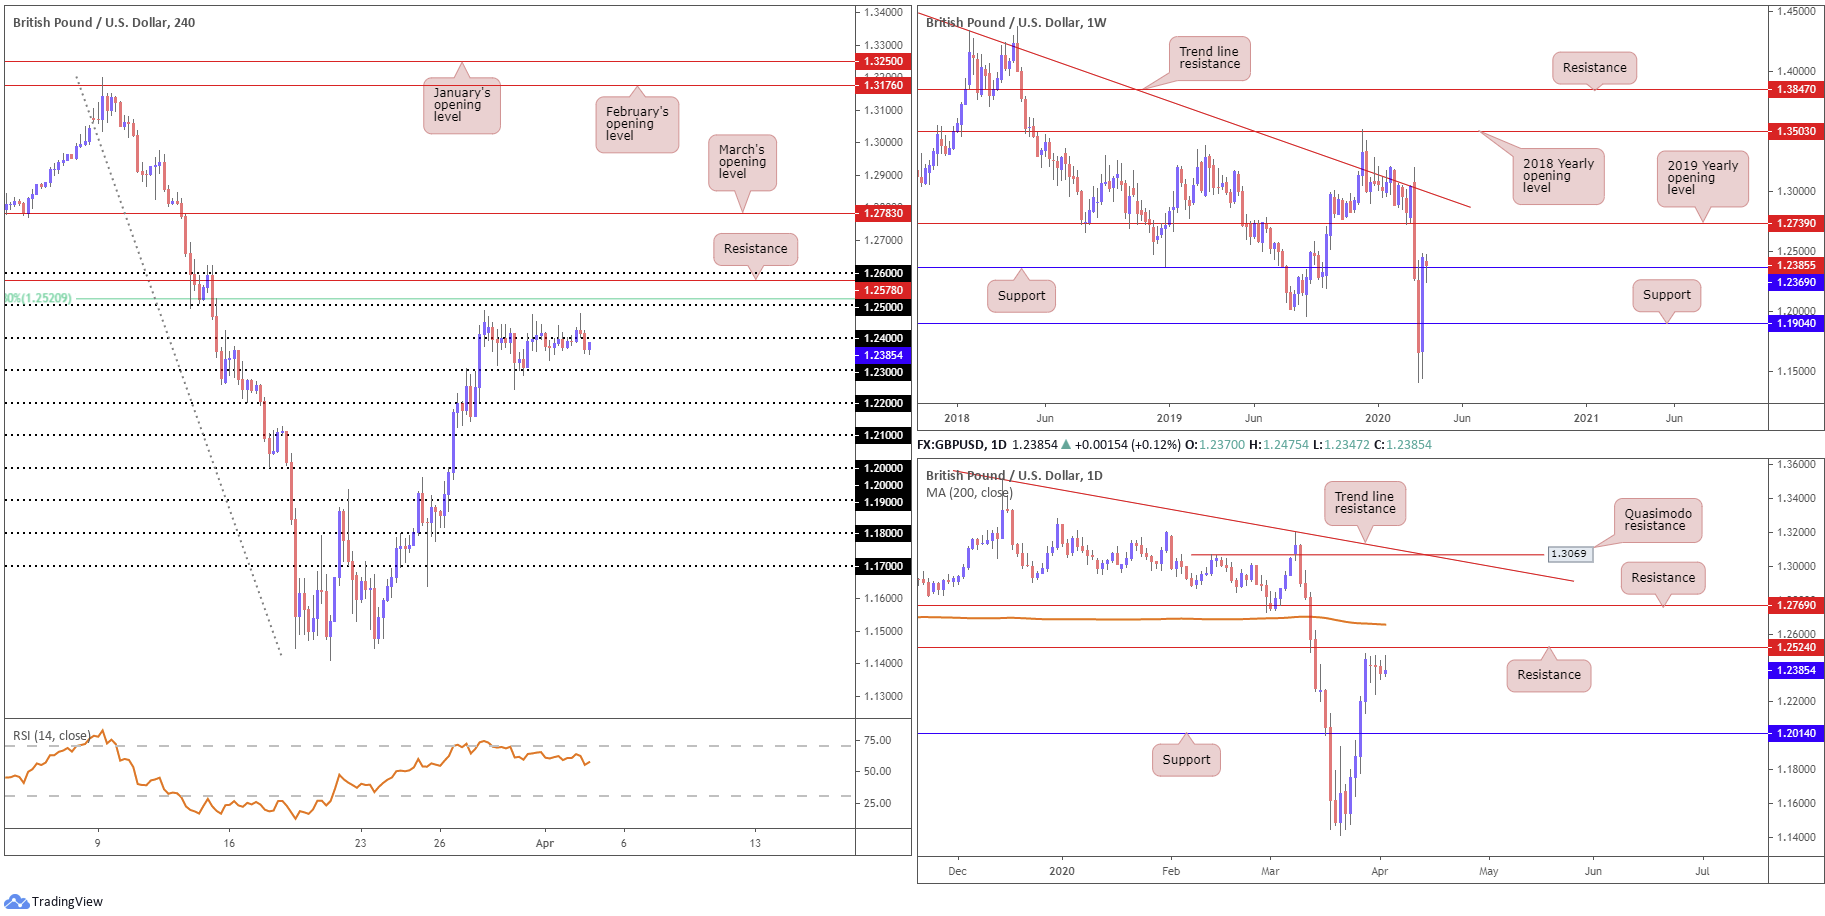
Should 1.24 echo a supportive tone today, traders are urged to key in the 1.25 handle and 61.8% Fibonacci retracement ratio at 1.2520. A violation of this region may also persuade further gains to resistance at 1.2578, taken from July 2019, and the round number 1.26.
Nothing standout is seen in terms of movement on the bigger picture so far this week. Last week’s vigorous climb firmed above weekly resistance at 1.1904 and 1.2369, with the latter currently being retested as support. The next upside target falls in around the 2019 yearly opening level at 1.2739, with a break exposing long-term weekly trend line resistance, taken from the high 1.5930.
After crossing daily resistance at 1.2014 (now a serving support), resistance lies in wait around the 1.2524 neighbourhood, trailed closely by the 200-day SMA (orange – 1.2658). Traders will also note Thursday’s action closed by way of a shooting star candlestick pattern (considered a bearish signal at troughs).
Areas of consideration:
Higher-timeframe projections on the weekly timeframe forecasts additional gains until shaking hands with 1.2739. Daily resistance at 1.2524 may throw a spanner in the works, however.
There’s not much (technical) evidence to suggest we’re heading beneath 1.24, aside from the recently closed daily candle, though for this to be a genuine bearish signal it generally needs to form in an area of space. 1.25 is the more likely destination, owing to its surrounding confluence from a 61.8% H4 Fibonacci ratio at 1.2520 and daily resistance at 1.2524. Therefore, this zone could be an area countertrend traders look to fade, targeting 1.24.
The next port of resistance falls in around the 1.26 handle on the H4 timeframe (another area countertrend traders may lean towards), enhanced by a H4 resistance level plotted at 1.2578, with the possibility of a fakeout seen to the 200-day SMA at 1.2658.
AUD/USD:
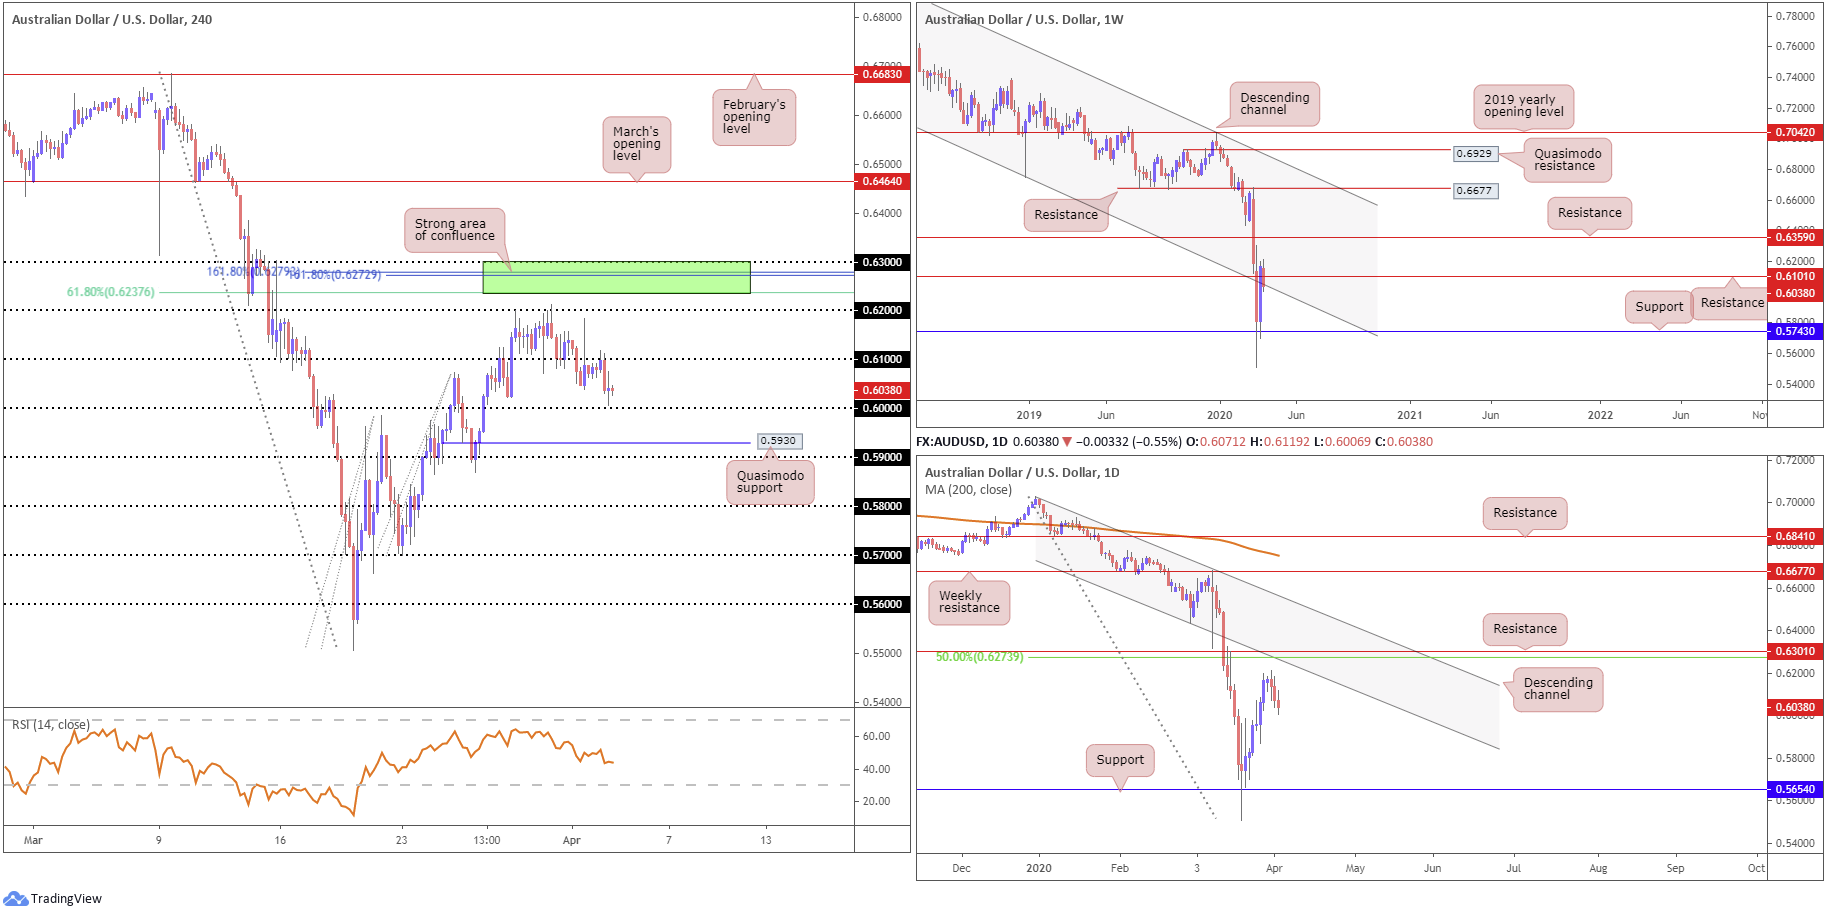
Undermined by the US dollar’s pronounced advance Thursday, despite weekly US unemployment claims surging past 6 million, the Australian dollar revisited the underside of 0.61 and registered its third successive close lower. Shaped by way of a doji indecision candle, H4 price bottomed a few points ahead of the key figure 0.60. A violation of 0.60 today could see the candles drawn towards Quasimodo support coming in at 0.5930, closely shadowed by the 0.59 handle.
What’s also notable from a technical perspective on the H4 is 0.63/0.6237, as a potential resistance zone; although unlikely to emerge today, it’s worth noting for the following week. Joining this region is the 0.63 handle, two 161.8% Fibonacci extensions at 0.6279 and 0.6272, a 61.8% Fibonacci retracement at 0.6237 and daily resistance at 0.6301 (green). In addition, buy stops above 0.62 will likely provide liquidity to sell into from 0.63/0.6237. The relative strength index (RSI), for those who follow momentum-based indicators, recently crossed beneath 50.00, emphasising a bearish tone.
Continued downside on the daily timeframe has support at 0.5654. Focus however, despite activity extending losses, remains at resistance from 0.6301. Joined closely with a 50.0% retracement ratio carved in at 0.6273 and a channel support-turned resistance, extended from the low 0.6433, this area could be an issue for buyers, in the event we attempt higher ground.
With respect to the weekly timeframe, traders are watching price action shake hands with resistance at 0.6101, which happens to align with a channel support-turned resistance, coming in from the low 0.6744.
Areas of consideration:
The widely watched 0.60 level may offer support today, though buyers may be concerned by the fact the round number, although it is a strong base by and of itself, houses limited confluence as well as recent H4 action demonstrating indecision. Conservative traders, therefore, will likely seek additional confirmation from this neighbourhood.
0.63/0.6237 remains an upside target for any long positions above 0.61.
Further to this, 0.63/0.6237 represents a potential spot to consider bearish setups, in view of supporting structure.
USD/JPY:
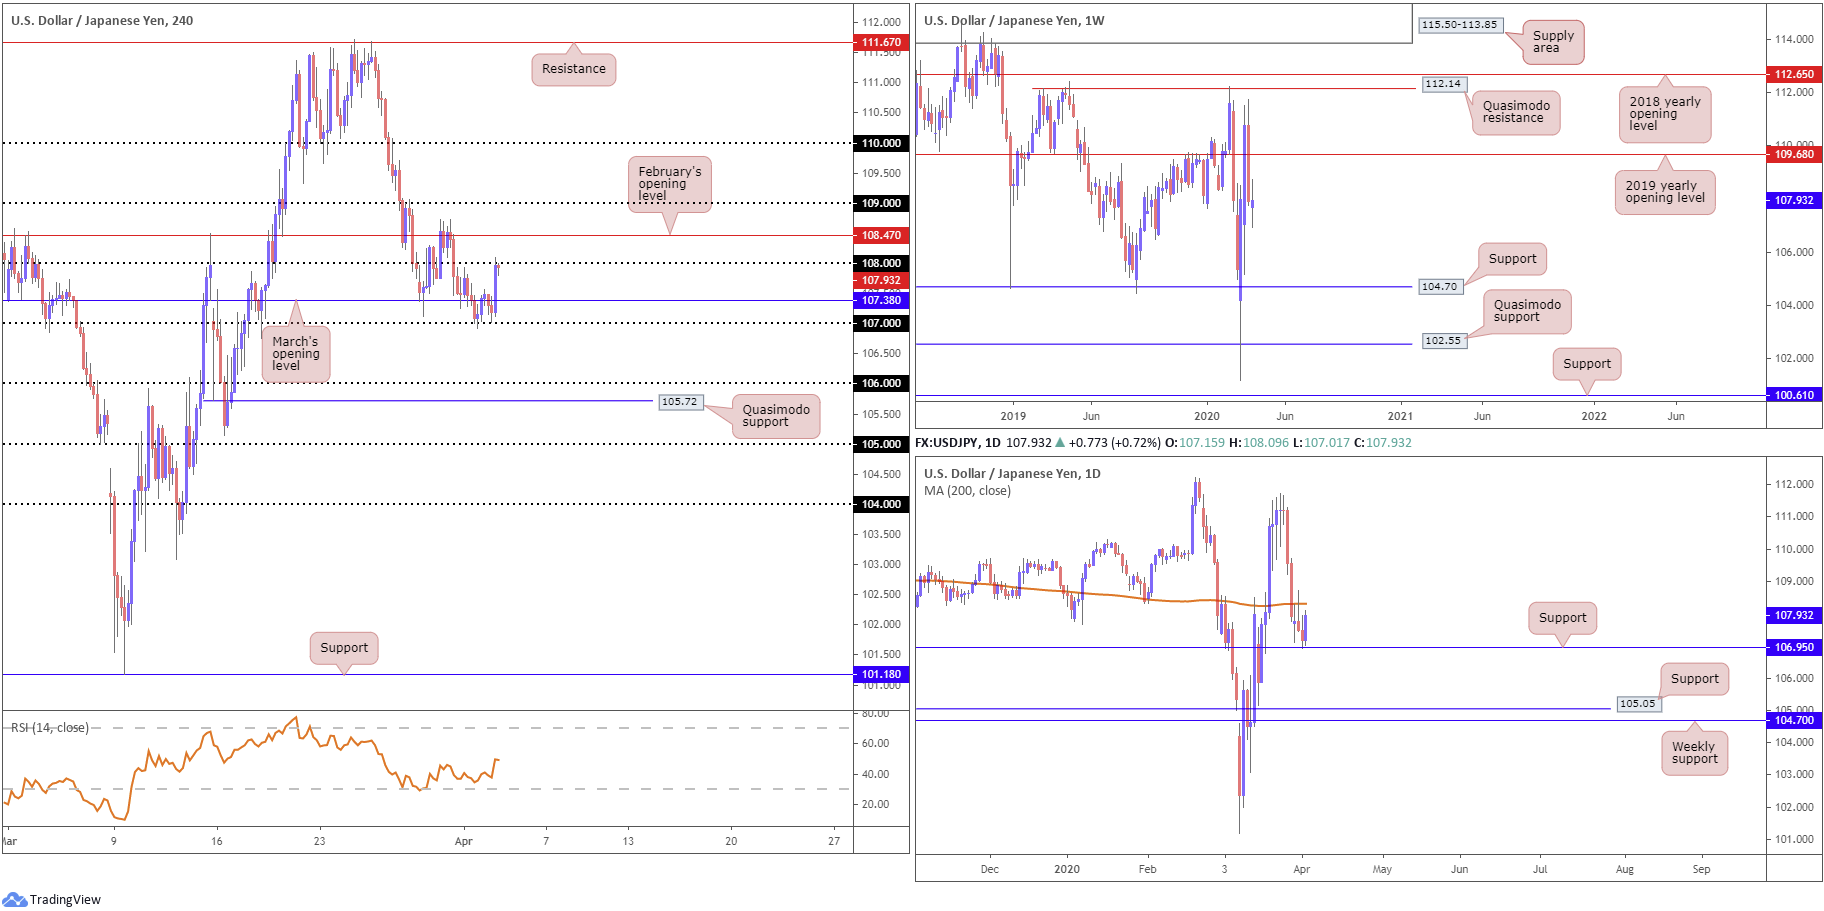
The aftermath of yesterday’s US unemployment claims data sent USD/JPY to lows at 107.02 in the early hours of US trade. Despite this, leaving 107 unchallenged, USD/JPY reclaimed recently lost ground and shook hands with 108, reinforced by a modest recovery in US equites and the US dollar index firming through 100.00.
North of 108, February’s opening level at 108.47 is in sight, with a breach likely leading the way to 109. A rejection from 108, on the other hand, has March’s opening level at 107.38 to target.
Technical action on the weekly timeframe left Quasimodo resistance at 112.14 unopposed, and pared a large portion of the prior-week’s gains last week, wiping off more than 280 points. Sustained downside on this timeframe is free to navigate lower until touching gloves with a familiar area of support coming in at 104.70, while a recovery could see the 2019 yearly opening level at 109.68 re-emerge. It might also interest some traders to note 104.70 denotes the lower boundary of a multi-month range between Quasimodo resistance mentioned above at 112.14. Current action on the weekly scale, however, emphasises an indecision candle.
A closer reading of price action on the daily timeframe recently saw the pair rebound from support at 106.95, heading for the underside of the 200-day SMA at 108.30.
Areas of consideration:
February’s opening level at 108.47 combined with the 200-day SMA at 108.30 may offer some form of resistance today, should we reach this far north, though the rejection could falter at 108 given weekly price may want higher levels.
USD/CAD:
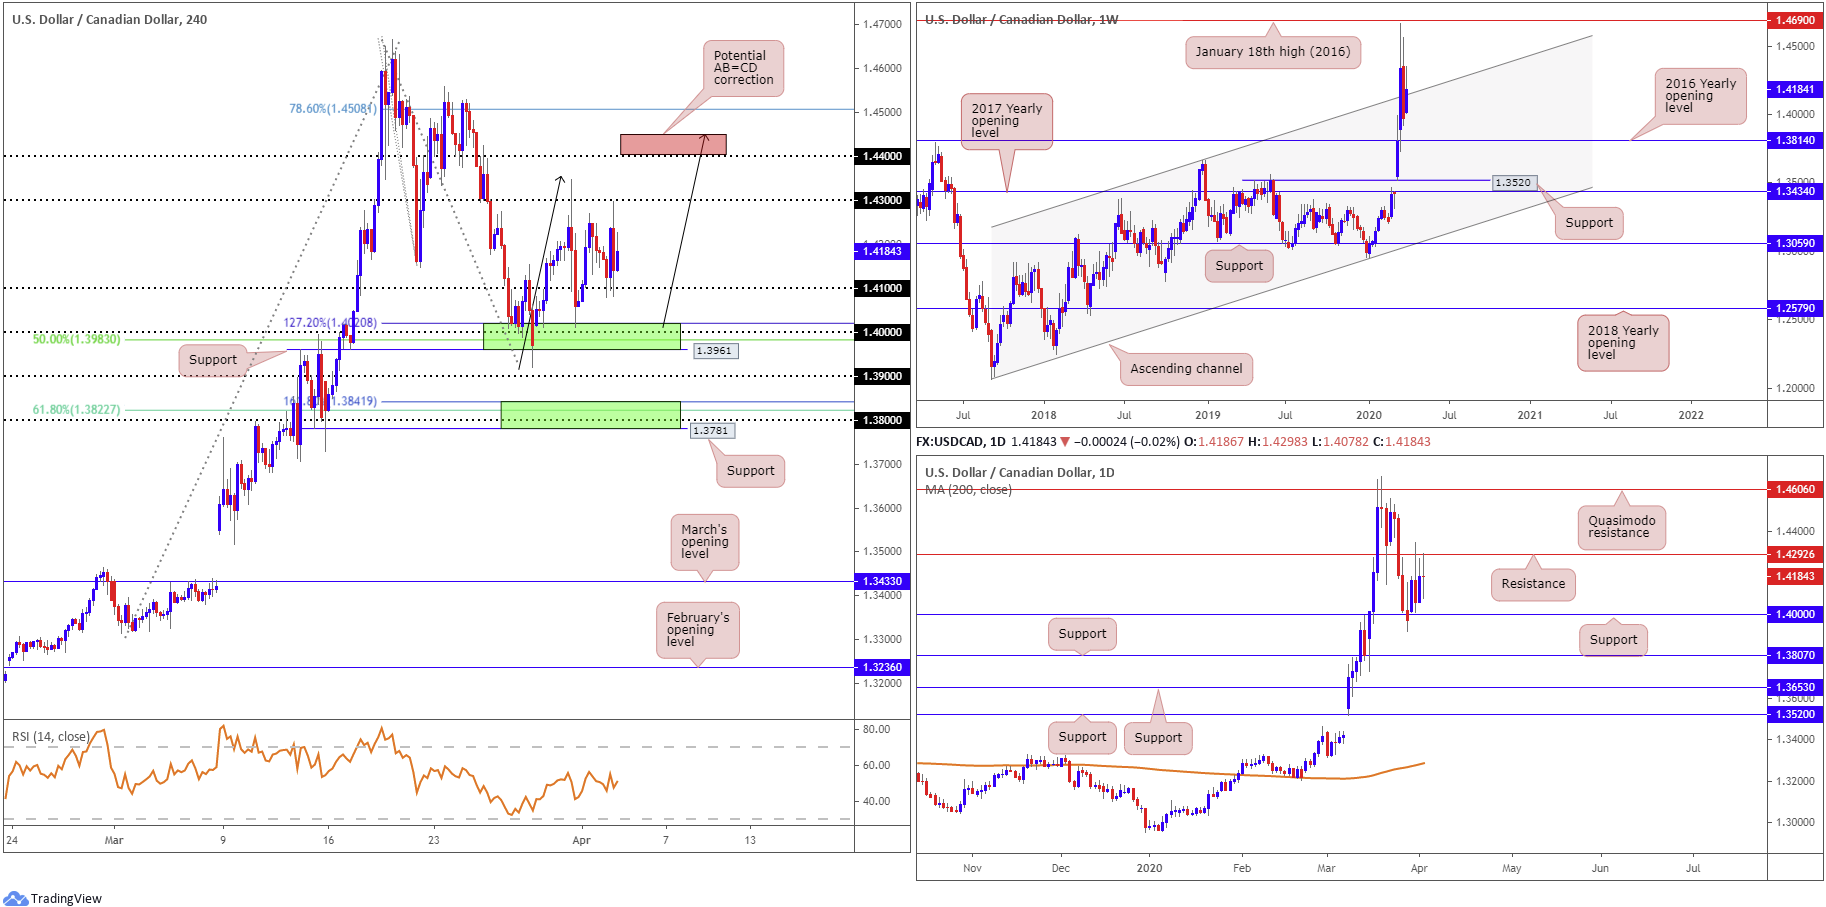
The combination of the US dollar index rallying through 100.00 to highs at 100.41 and WTI prices reaching highs of $27.32/bbl (as President Trump expects a deal between Saudi and Russia), witnessed USD/CAD form the beginnings of a consolidation between 1.43 and 1.41 on the H4 scale.
1.3961/1.4020 (upper green zone) on the H4, made up of a 127.2% Fibonacci extension base at 1.4020, the round number 1.40, a 50.0% retracement at 1.3983 and support coming in at 1.3961, also likely remains a watched base of support, despite price emphasising a range at the moment. In the event of a break above 1.43, nonetheless, we’re then likely headed for 1.44 and a completion of a H4 AB=CD bearish pattern (black arrows) around 1.4450.
From the weekly timeframe, the unit is seen attempting to secure ground above channel resistance, extended from the high 1.3661, despite a sizeable move to the downside in recent trading. Further buying from this point has January 18th high at 1.4690 (2016) to target, whereas moves lower could draw in support at the 2016 yearly opening level from 1.3814.
A closer examination of price action on the daily timeframe reveals the candles remain confined between resistance at 1.4292 and support coming in at 1.4000. Support is seen at 1.3807, in the event we push lower, while moves to the upside has crosshairs fixed on Quasimodo resistance at 1.4606. Traders will also note Thursday’s movement chalked up a clear-cut indecision candle off 1.4292, bolstering the upper edge of the current H4 range at 1.43.
Areas of consideration:
Range traders may attempt to trade between H4 range limits today; do remain aware that this consolidation is in the early stages of forming therefore the likelihood of a whipsaw being seen is certainly there. Waiting for a H4 candlestick pattern to form before engaging can help avoid this.
A break of 1.41 will likely land price back within 1.3961/1.4020, which could offer a ‘floor’, knowing the area houses daily support at 1.4000.
A breach of 1.43, on the other hand, may look for 1.44 and, as highlighted above, a completion of a H4 AB=CD bearish pattern around 1.4450. A fakeout through 1.44, tripping buy-stop liquidity into 1.4450 (red zone), therefore, could be a scenario worthy of the watchlist, particularly if H4 price action closes in the form of a bearish candlestick signal.
USD/CHF:
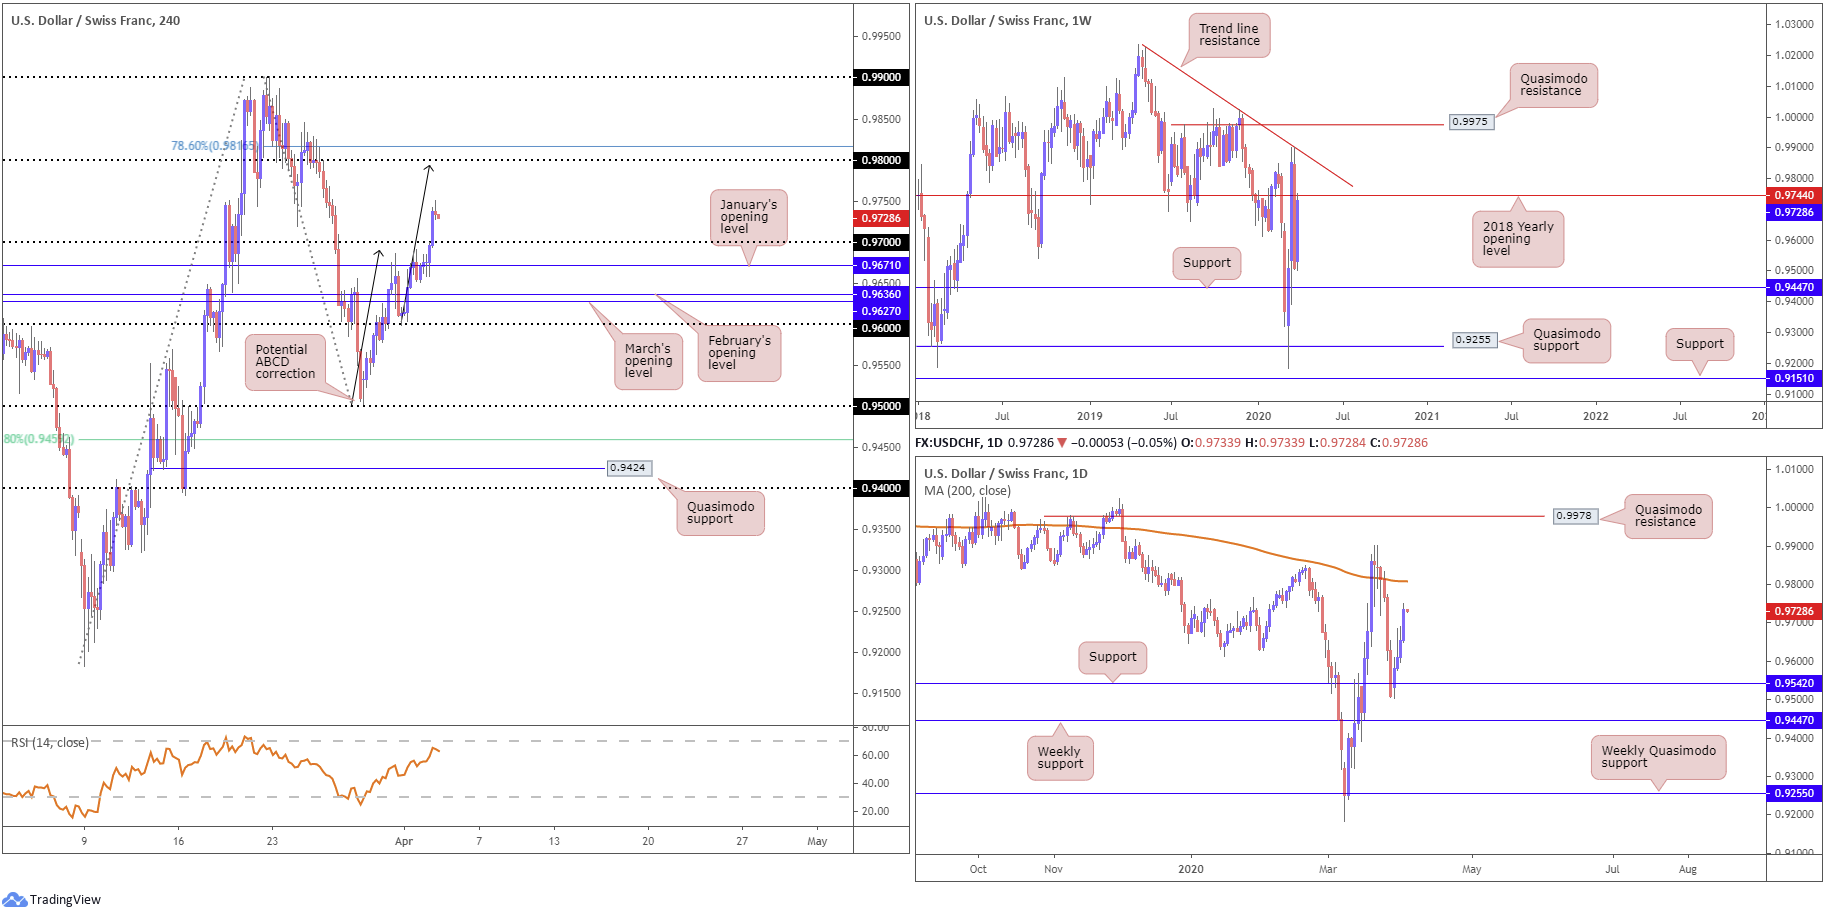
A pickup in USD demand Thursday boosted the greenback across the board, extending USD/CHF recovery from lows of 0.9502 to north of 0.97 at 0.9750. Technically, this positions the pair within potential striking distance of 0.98 on the H4, which happens to combine with an ABCD bearish completion (black arrows) at 0.9794 and a 78.6% Fibonacci retracement ratio at 0.9816.
Further out on the bigger picture, weekly price is crossing swords with the 2018 yearly opening level at 0.9744; a break of here shines the spotlight on trend line resistance, etched from the high 1.0236. On the daily timeframe, nevertheless, price action is seen fast approaching the 200-day SMA value at 0.9808, following a stronger-than-expected recovery off support coming in at 0.9542.
Areas of consideration:
The 0.98 handle on the H4 timeframe, coupled with a potential ABCD bearish correction and a 78.6% Fibonacci retracement at 0.9816, as well as the 200-day SMA value at 0.9808, could collectively send USD/CHF lower if tested today. This would, however, entail whipsawing above weekly resistance at 0.9744, though a 50-point whipsaw is considered reasonably minor on the weekly scale, therefore is certainly a possibility.
Dow Jones Industrial Average:
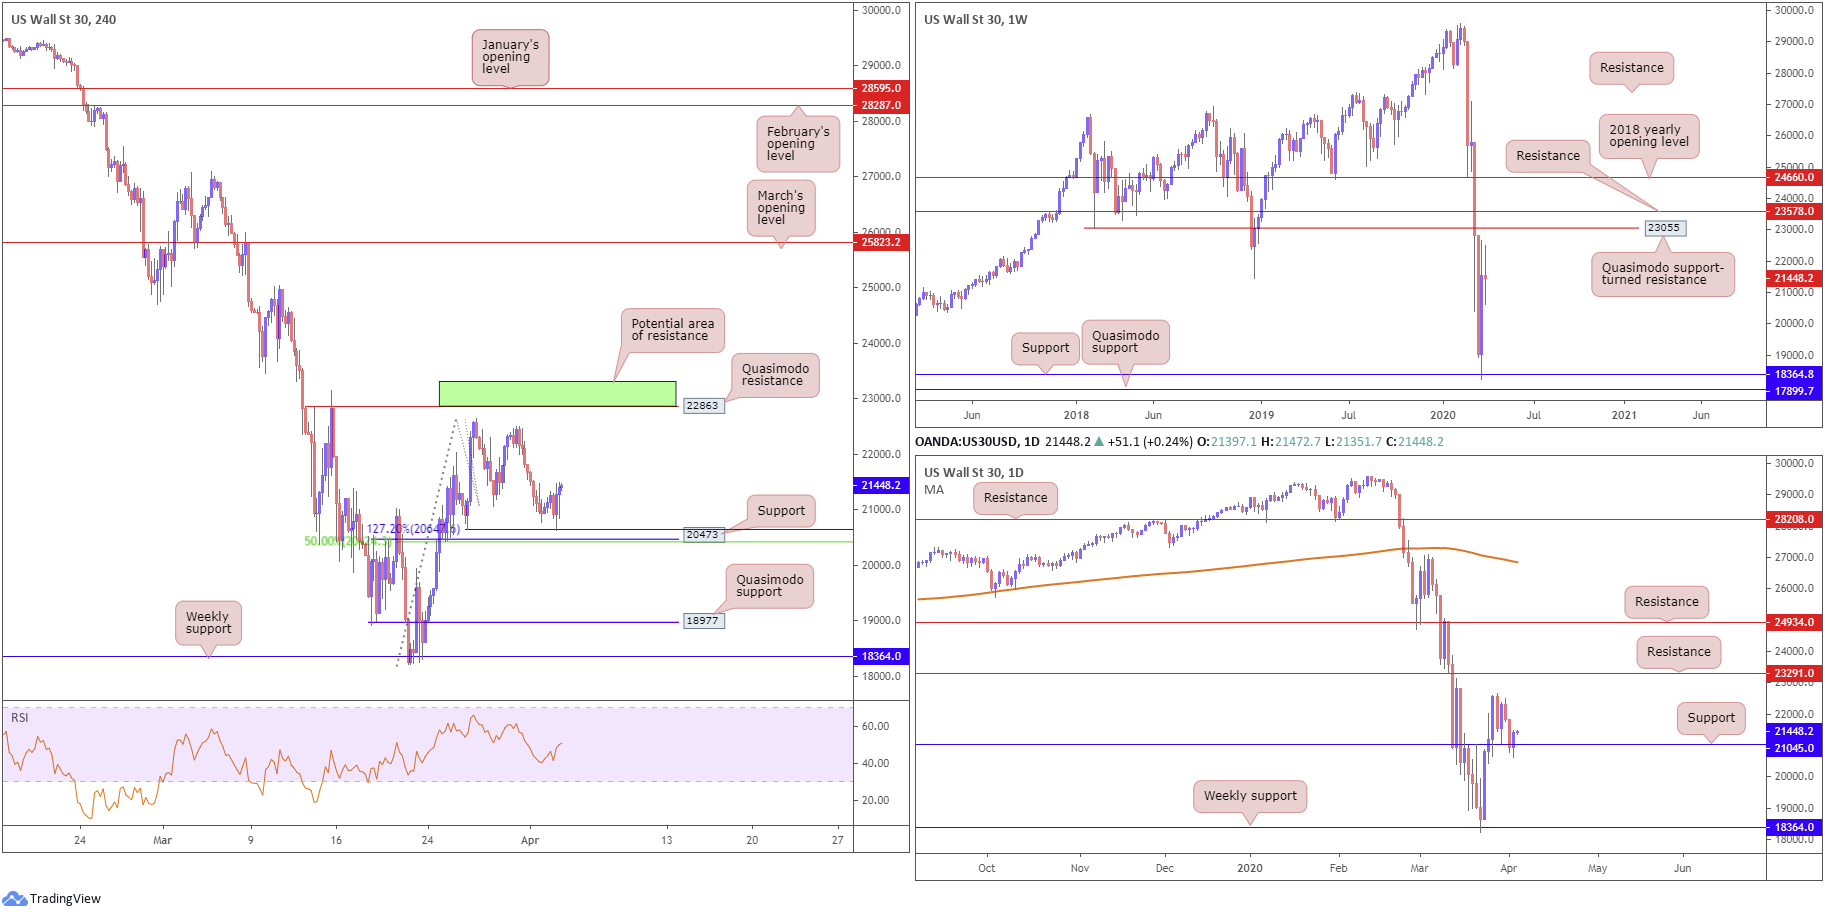
US equities finished Thursday in positive territory, maintained on hopes the oil price war between Russia and Saudi Arabia could soon ease. The Dow Jones Industrial Average rebounded 469.93 points, or 2.24%; the S&P 500 also gained 56.40 points, or 2.28%, and the tech-heavy Nasdaq 100 concluded higher by 149.37 points, or 2.00%.
Technicians on the H4 timeframe will note the 127.2% Fibonacci extension at 20647 entered the fold Thursday, which represents the top base of a support area highlighted in Thursday’s technical briefing, comprised of support coming in at 20473 and a 50.0% retracement at 20433.
The rebound from 20433/20647 produced a nice-looking bullish outside candlestick formation, likely enough to generate interest from candlestick enthusiasts to take things higher from here. Aside from tops sited around 22500, Quasimodo resistance resides at 22863.
Reinforcing the noted H4 support area, we can see daily support also made an appearance at 21045 yesterday, reclaiming at least 50% of Wednesday’s losses. Further out on the weekly timeframe, weekly price continues to languish beneath Quasimodo support-turned resistance at 23055, following last week’s enthusiastic recovery off support at 18364. Weekly price, for those who follow candlestick patterns, will also note an indecisive tone emerging on the weekly timeframe right now.
Areas of consideration:
Continued buying from current price, knowing the unit is effectively bolstered by H4 and daily confluence, is a possibility today, targeting 22500 on the H4, followed by Quasimodo resistance at 22863.
22863 also represents healthy resistance, owing to daily resistance merging closely at 23291 and weekly resistance at 23055 (H4 green zone).
XAU/USD (GOLD):
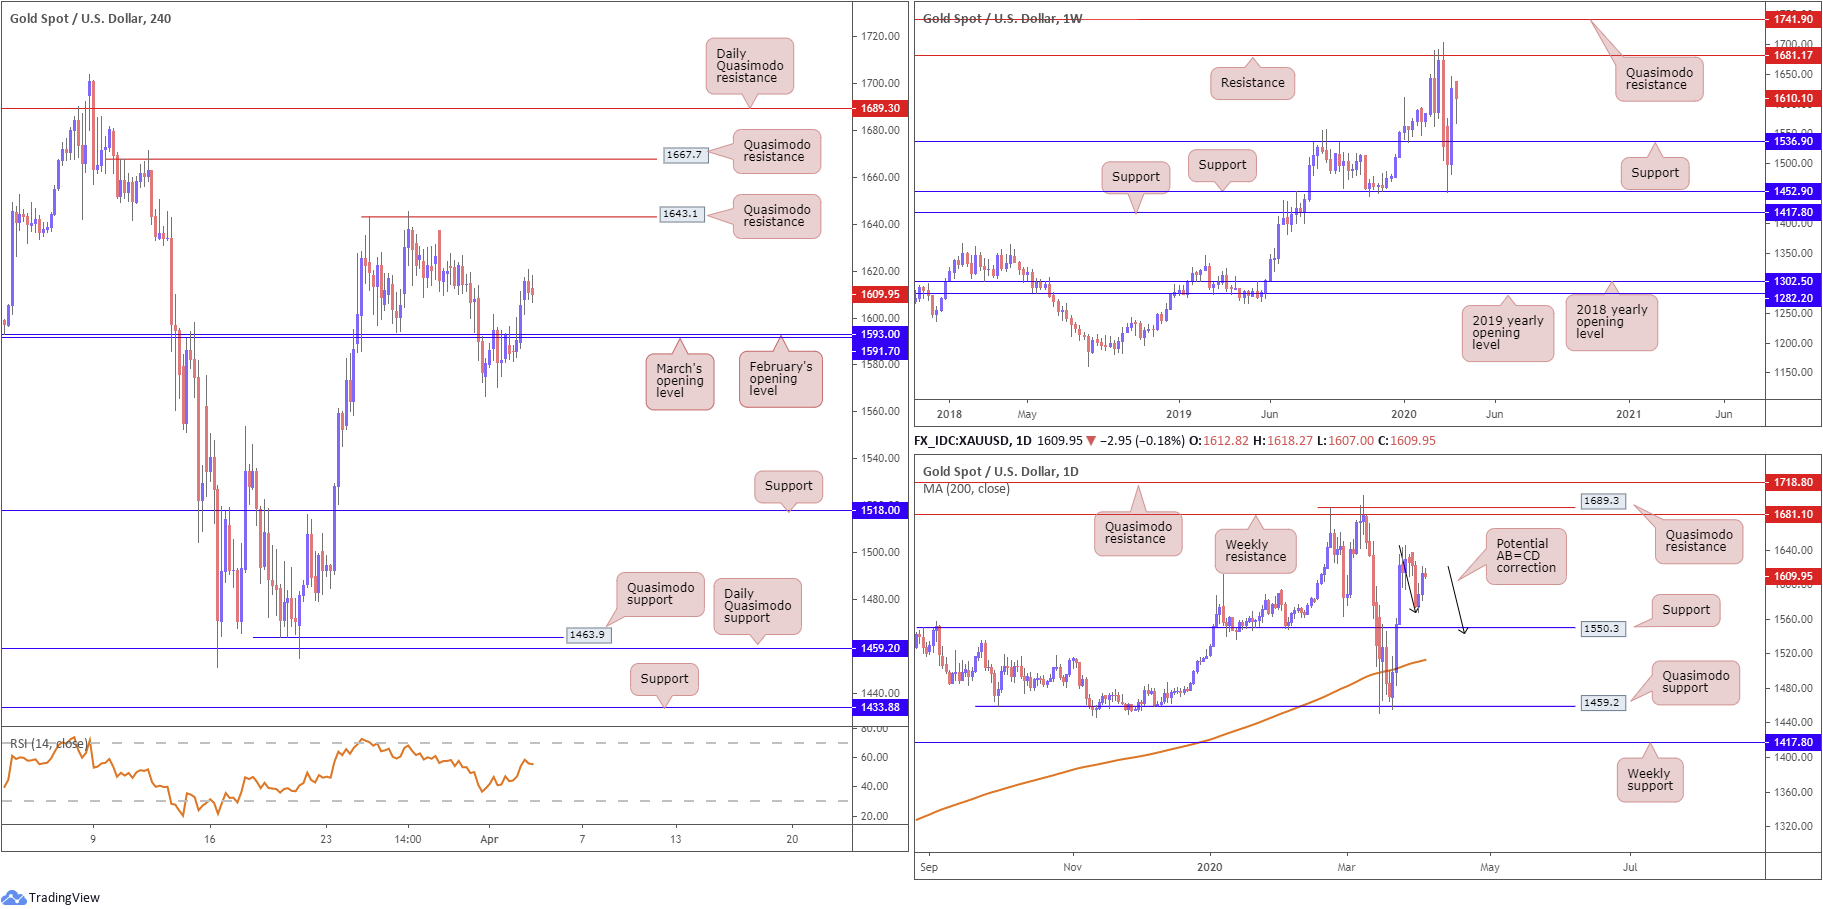
Despite a brief spell beneath March and February’s opening levels at 1591.7/1593.0 on the H4 scale, Thursday observed a climb in prices, adding nearly $25. In the event we push higher, a shallow Quasimodo resistance resides at 1643.1, followed by another layer of Quasimodo resistance at 1667.7.
Weekly price continues to trade in no man’s land right now with support at 1536.9 eyed to the downside and resistance plotted at 1681.1. The technical story on the daily timeframe, however, has support lurking around 1550.3, with the said weekly resistance posted to the upside, followed by daily Quasimodo resistance at 1689.3. Daily price structure also notes a possible AB=CD bullish correction that terminates around 1542.3 (black arrows).
Areas of consideration:
The breakout above 1591.7/1593.0 on the H4 timeframe has likely aroused intraday buyer interest, with most likely favouring entry on a retest of the said levels, targeting noted H4 Quasimodo resistances. Conservative traders will likely seek additional confirmation at 1591.7/1593.0 in order to help avoid a potential whipsaw. This could be something as simple as a bullish candlestick pattern, such as a hammer or engulfing formation.
The accuracy, completeness and timeliness of the information contained on this site cannot be guaranteed. IC Markets does not warranty, guarantee or make any representations, or assume any liability regarding financial results based on the use of the information in the site.
News, views, opinions, recommendations and other information obtained from sources outside of www.icmarkets.com.au, used in this site are believed to be reliable, but we cannot guarantee their accuracy or completeness. All such information is subject to change at any time without notice. IC Markets assumes no responsibility for the content of any linked site.
The fact that such links may exist does not indicate approval or endorsement of any material contained on any linked site. IC Markets is not liable for any harm caused by the transmission, through accessing the services or information on this site, of a computer virus, or other computer code or programming device that might be used to access, delete, damage, disable, disrupt or otherwise impede in any manner, the operation of the site or of any user’s software, hardware, data or property.


